http://go.warwick.ac.uk/lib-publications
Original citation:
Tian, Y., Liu, C., Liu, Xianping, Wang, F., Li, X., Qin, Y., Zhang, D. and Shirinzadeh, B.. (2015) Design, modelling and characterization of a 2-DOF precision positioning platform. Transactions of the Institute of Measurement and Control, 37 (3). pp. 396-405.
Permanent WRAP url:
http://wrap.warwick.ac.uk/74984
Copyright and reuse:
The Warwick Research Archive Portal (WRAP) makes this work by researchers of the University of Warwick available open access under the following conditions. Copyright © and all moral rights to the version of the paper presented here belong to the individual author(s) and/or other copyright owners. To the extent reasonable and practicable the material made available in WRAP has been checked for eligibility before being made available.
Copies of full items can be used for personal research or study, educational, or not-for-profit purposes without prior permission or charge. Provided that the authors, title and full bibliographic details are credited, a hyperlink and/or URL is given for the original metadata page and the content is not changed in any way.
Publisher’s statement:
http://dx.doi.org/10.1177/0142331214540692 A note on versions:
The version presented here may differ from the published version or, version of record, if you wish to cite this item you are advised to consult the publisher’s version. Please see the ‘permanent WRAP url’ above for details on accessing the published version and note that access may require a subscription.
Design, modeling and characterization of a 2-DOF precision
positioning platform
Y. Tian1, C. Liu1, X. Liu2, F. Wang1, X. Li1, Y. Qin1, D. Zhang1, B. Shirinzadeh3
1
Key Laboratory of Mechanism Theory and Equipment Design of Ministry of Education, Tianjin University, Tianjin 300072, China
2
School of Engineering, University of Warwick, Coventry CV4 7AL, UK
3
Robotics and Mechatronics Research Laboratory, Department of Mechanical and Aerospace
Engineering, Monash University, Clayton 3800, Australia
Abstract: This paper presents the mechanical design, parameter optimization and
experimental tests of a 2-DOF (Degree of Freedom) flexure-based precision positioning
platform, which has great potential application in many scientific and engineering fields.
During the mechanical design, the leaf parallelogram structures provide the functions of joint
mechanisms and transmission mechanisms with excellent decoupling property. The dynamic
model of the developed positioning platform is established and analyzed using PRBM
(Pseudo Rigid Body Model) methodology. A PSO (Particle Swarm Algorithm) optimization
approach is utilized to perform the parameter optimization and thus improve the static and
dynamic characteristics of the positioning platform. The prototype of the developed 2-DOF
positioning platform has been fabricated using WEDM (Wire Electric Discharge Machining)
technique. A number of experimental testing has been conducted to investigate the
performance of the platform and verify the established models and optimization
methodologies. The experimental results show that the platform has a workspace range in excess of 8.0μm×8.0μm with the stiffness of 4.97 N/µm and the first order natural frequency of 231 Hz. The cross-axis coupling ratio is less than 0.6%, verifying the excellent decoupling
performance.
Keywords: precision positioning platform; PRBM; PSO optimization approach; flexure
1. Introduction
Micro/nano precision positioning platform is widely used in the industrial and academic
areas to conduct leading-edge scientific research (Verma et al., 2005; Tian et al., 2009a). The
prospective and versatile applications include precision manipulations (Qin et al., 2013a),
atomic force microscope (Greco et al., 2013), scanning tunneling microscope (Tian et al.,
2009b), optical fiber alignment (Lee et al., 2011), single molecule experiment in physics (Zheng et al., 2013) and micro-assembly (Tian et al., 2011a). Recent advances in scientific and engineering applications show increasing demands in positioning accuracy, resolution,
response speed, workspace and stability of such kinds of instruments and devices (Casciati et
al., 2013; Ang et al., 2013). The flexure-based micro/nano positioning platform has obtained a
considerable amount of attentions for the advantages including free of backlash, wear and
friction (Hopkins et al., 2012; Tian et al., 2010; Tian et al., 2009c; Tian et al., 2011b; Bhagat et
al., 2013), and thus it has been considered as one of the best candidates for conducting the high accuracy positioning from several nanometer to hundreds of micrometers.
There are two kinds of configurations for the 2-DOF (Degree of Freedom) positioning
platform, namely, serial mechanism (Friedman et al., 2010) and parallel mechanism (Li et al.,
2012a; Xu, 2014). The design of the serial platform is straightforward, however, its
positioning error will be accumulated, thus affecting the motion accuracy of the platform. In
addition, the serial configuration will also increase the mass of the moving part, and thus
reduce the response speed of the platform. On the contrary, the parallel platform shows
distinct advantages in terms of rigidity, accuracy, load capacity and identical performance in
each axis. Hence, parallel mechanisms are more preferable and attract more attentions in the
past few years. However, the output cross-axis decoupling is one of the challenges in the
design of parallel mechanism, which increases the complexity of the design and modeling of
stage in one axial direction without affecting the other direction. For PEA (Piezoelectric
Actuator) is weak to the lateral force and bending, thus large coupling will damage the PEA.
However, the coupling ratio of traditional mechanisms is between 1% and 1.5% mechanism
(Li et al., 2012b; Xu, 2014). Thus it is important to develop the design methodology for
mechanisms with negligible cross-axis couplings.
Parallelogram-based mechanisms can be used to overcome the cross-axis couplings,
which include leaf hinge parallelogram and circular hinge parallelogram (Li et al., 2011; Qin
et al., 2013b). For a parallelogram-based flexure mechanism, it works as a transmission
mechanism in the longitudinal direction due to the large axial stiffness, and a joint in
transverse direction due to the small out-of-plane stiffness (Li et al., 2012b). Compared with
the circular hinge mechanism, the leaf hinge mechanism can implement large working range,
low stress concentration, and small dimension. Thus it is more suitable for the compact
platform design with large bandwidth.
The mechanical structure of the positioning platform plays a main role in the static and
dynamic performance of the micro/nano positioning platform. Thus, a suitable optimization
approach should be used to make the first natural frequency of the platform meet the
requirements of the high bandwidth. A number of approaches including PSO (Particle Swarm
Algorithm), GA (Genetic Algorithm) have been proposed to optimize the parameters of the
micro/nano positioning platform (Lin et al., 2012). It is demonstrated that the PSO approach is
robust and efficient to conduct the parameter optimization, since it has no evolutionary
operators including crossover and mutation. Thus it is generally utilized to optimize the
structure of the platform.
The mechanical design, parameters optimization methodologies of a 2-DOF precision
positioning platform featuring the parallelogram decoupling mechanisms have been
based on PRBM technique. PSO optimization approach is utilized to optimize the geometric
parameters and thus improve the static and dynamic characteristics of the developed platform.
The platform can provide a workspace range in excess of 8.0 μm×8.0 μm with a natural
frequency of 231 Hz, the across axis coupling ratio is less than 0.6%, indicating the excellent
decoupling performance. The main contributions of this paper are as follows: 1) The
mechanical design and optimization methodologies for such kinds of compact planar
positioning platforms have been established. 2) The cross-axis decoupling has been
significantly improved, compared with previous designs.
2. Mechanical design
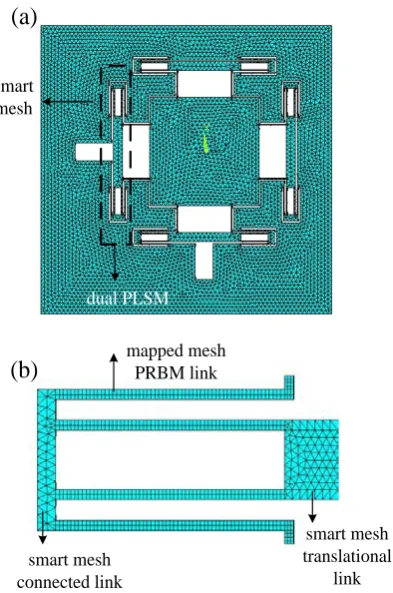
The schematic diagram of the 2-DOF precision positioning platform is shown in Fig.1.
This platform is symmetric design, and thus reducing the effects of the thermal deformation
and external disturbance on the platform. In the proposed platform, the central moving part is
connected to the dual Parallel Leaf-Spring Mechanisms (PLSM) through a set of leaf
parallelogram mechanisms. These leaf parallelogram mechanisms include two types of
configurations: type A is joint mechanism and type B transmission mechanism. The stiffness
of the leaf parallelogram is large in the longitudinal direction and low in the transverse
direction. Therefore, as shown in Fig.1, when the PEA in the Y axis is activated, the leaf
parallelograms in the Y axis (type B) translate the motion to the central moving part due to the
large stiffness in the Y axis. The leaf parallelogram in the X axis (type A) works as a joint due
to its low rigidity in the Y axis. In addition, the PEA in the Y axis only drives the central
platform in Y direction without affecting the X direction and thus the PEA is free from
bending and lateral forces. The platform is designed with a half cylinder between the PEA and
the dual PLSM to form Hertzian contact and thus further reduce/eliminate the bending force
acting on the PEA. The working principle of the platform in the X direction is similar with
T7075 is chosen to construct the platform due to its high strength properties. The Young’s
Modulus is 70 Gpa, Poisson ratio is 0.33 and the density is 2700 kg/m3. The WEDM (Wire
Electric Discharge Machining) technique is utilized to fabricate the flexure-based mechanism
to guarantee the machining accuracy and the performance of the developed positioning
platform.
3. PRBM modeling
As shown in Fig. 2, the dual PLSM combines the advantages of the conventional
parallelogram and double four-bar parallelogram. It has the capability of providing larger
displacement, smaller stress concentration and motion decoupling. As demonstrated in
Fig.2(a), L and b represent the length and width of the translational link, respectively, l and t
are the length and width of the PRBM link, respectively. Fig.2(b) shows the equivalent static
model of the dual PLSM. In addition, as show in Fig.2(c), the leaf parallelogram can provide
pure translation motion in the Y direction without affecting transverse directional motion in
the X direction. The thickness of the dual PLSM is denoted by d.
PRBM technique is a common solution in the design of flexure-based mechanism. In
traditional kinematics theory, it is assumed that all links are completely rigid and/or relatively
small deformable. PRBM technique replaces flexure-based link with rigid link and torsional
springs and remains the load-displacement relationships similar between the flexure-based
mechanism and the PRBM model. Thus, the computational accuracy and efficiency can be
guaranteed for the modeling of flexure-based mechanism.
3.1 Modeling of the leaf hinge
Fig.3 shows the principle of the PRBM technique. Deformation of the cantilevered leaf
hinge under external load is shown in Fig. 3(a). It is noted that the leaf hinge will deflect
when the free end is subjected to the vertical force. The curve of the leaf hinge can be
There are two rigid bodies connected with a spring, which denotes the rotational stiffness of
the flexure-based link. In the PRBM model, the deflection of the free end is equal to that of
the leaf hinge determined by continuous mechanics. The length of the rotational link is γl,
where γ is the parameter to determine the deflection characteristics and trajectory of the free
end of the leaf hinge.
As shown in Fig. 3(b), the deflection of the PRBM link is induced by tangential force Ft,
and thus the torque acting at the spring can be expressed as follows:
T=kθ (1)
where k is the rotational stiffness of flexure-based link, θ is the rotational angle of PRBM
link.
The torque can also be expressed as follows:
t
T =F lγ (2)
where Ft is tangential force, γ is PRBM coefficient, and l is the length of the leaf flexure
hinge.
From mechanics point of view, it can be obtained:
2
t
F l k
EI
θθ = (3)
where kθ is the coefficient of rotational stiffness, E is the modulus of elasticity, I is the
moment of inertia.
Substituting Eqs. (1) and (2) into Eq. (3), the rotational stiffness of the flexure-based link
can be expressed as:
EI k k
l θγ
= (4)
3.2 Modeling of the platform
The 2-DOF precision positioning platform has symmetry structures in the X and Y
without loss generality, the dynamic model in the X direction is developed based on the
PRBM technique and Lagrange’s equation methodology. Accordingly, the first order natural
frequency is obtained and analyzed.
Based on the Newton’s motion law, the kinetic energies of positioning platform are given
as follows:
1) The kinetic energy of connected link
( )2 2
1 3 1
1 4
2
T = × m γl θ (5)
2) The kinetic energy of PRBM link
2
2 1
2 2 1
2
2
2 1 1 1
1 1
8
2 2 2
1 1 1
8
2 2 2
l
T m J
m l l J
γ θ θ
γ θ γ θ θ
= × + + × + + (6)
3) The kinetic energy of translational link
2
3 1 1
1
2 2
2
T = × m× γ θl (7)
4) The kinetic energy of type B hinge
(
)
24 2 1
1
4 2
2
T = × m γ θl (8)
5) The kinetic energy of type A hinge
2
2 1
5 2 1
2
1 1
4 (2 )
2 2 2
l
T m γ θ J θ
= × +
(9)
6) The kinetic energy of moving part
(
)
26 4 1
1 2 2
T = m γ θl (10)
Thus, the total kinetic energy of the platform can be obtained as:
( ) ( )
0 1 2 3 4 5 6
2 2 2
1 2 3 4 1 1
4 20 2 2 16
T T T T T T T
m m m m γl θ Jθ
= + + + + +
= + + + ⋅ ⋅ +
(11)
central platform, respectively, J is the moment of inertia of PRBM link,θ1 is the angular
displacement about the Z axis, as shown in Fig.4.
The potential energy of the platform is obtained as follows:
32 8
2 2 2
1 1 1
2 1
1 1
(2 ) 32
2 2
32
U k k k
EI k
l
θ
θ θ θ
γ θ
= + =
=
∑
∑
(12)
The Lagrange’s equation is given as follows:
1
1 1
1
d T T U
c dt θ θ θ θ
∂ − ∂ +∂ = − ∂ ∂ ∂
(13)
where c is the damping coefficient.
Substituting Eqs. (11) and (12) into Eq. (13), the governing equation of motion of the
platform can be given as follows:
(
) ( )
21 2 3 4 1
1 1
8 40 4 4 32
64 0
m m m m l J
EI
c k
l
θ
γ θ
θ γ θ
+ + + ⋅ + + + = (14)
Then, the stiffness of platform in the Y direction can be expressed as follows:
3
64k EI
K l
θ
γ
= (15)
The first order natural frequency in the Y direction can be given as follows:
( ) ( )2
1 2 3 4
4
8 40 4 4 32
k EI f
m m m m l J l
θ γ π γ = + + + ⋅ + (16)
4. PSO optimization
The PSO optimization approach is utilized to perform the optimization. The flowchart
of PSO method is shown in Fig. 5. PSO is an optimization approach based on iterative
method, compared with GA, its advantages include no crossover and no mutation, and thus
there are fewer parameters to be regulated and it is easy to perform. The optimization
1) The computational system initializes velocity and position of all particles.
2) The system evaluates all particles, putting every particle’s optimal velocity and optimal
position into Pbest.
3) Comparing all particles’ optimal velocity and position, the system will put best velocity
and best position into gbest.
4) Updating all velocity and position in gbest via PSO formula.
5) Comparing all particles’ velocity and position which have been updated with all
particles’ optimal velocity and position which are stored in gbest. If the system is not
satisfied with any particle, go back to step 2 and regenerate new particles until one
satisfied particle is found. This particle is the optimal design.
In the Step 4, the PSO formula can be expressed as follows:
( )
1 ,( )
11[ , ,( )
] 22[ , ,( )
], t wv t cr p x t cr p x t
vij + = ij + ij− ij + ij− ij
(
)
( )
(
)
, 1 . , 1
i j i j i j
x t+ =x t +v t+ (17)
In the PSO formula, the parameters c1 and c2 are the learning factors, w denotes the
weight function, r1 and r2 are random numbers distributes uniformly in the range from 0 to 1.
The accuracy of the PSO approach is highly dependent on the parameters of the PSO formula
including number of particles, learning factors, weight function, motion range and dimensions
of particles. The number of particles is highly dependent on the complexity of the problem,
for general optimization problem, 20-40 particles are suitable, if number of the particles is
excessive, it will extend the optimization time and decrease the optimization efficiency. On
the contrary, the optimization accuracy can not be guaranteed. The weight function w makes a
well balance between the capability of expanding in all search space and exploring in local
space. The learning factor c1 is related to expanding capability, while c2 is related to exploring
capability. If the value of c1 is too large, particle moves only in local space, but not in all
which degrades the optimization accuracy.
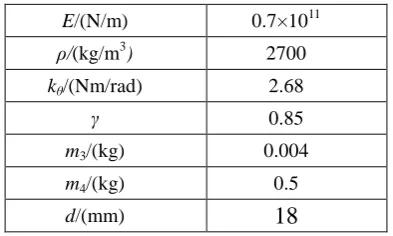
As shown in Fig.2(a), the design variables for the platform are: L, b, l and t. The
objective function is the first natural frequency in the Y direction devoted as f. The geometric
and physic parameters of the platform are shown in Table 1. Based on the given parameters
and the PSO optimization approach, the mechanical design optimization of the positioning
platform can be performed. The convergent process of the PSO optimization is shown in Fig.
6. The optimal value search stops at the 50 generation. Fig. 6(a) shows the convergent process
of the best and average fitness values. It is noted that the best fitness value can reach up to the
final value at generation 6 and keep constant during the further generation. The mean fitness
will also drops to the final value at generation 10, but slightly fluctuates near the final value
when the generation increases. The average distance between the individuals is shown in Fig.
6(b). It can be seen that the value of the average distance generally decreases with the
increasing of the generation. After generation 25, the average distance reaches up to the
minimal value and remains constant till the stop of the optimization, which indicates the
convergent stability of the PSO optimization. Fig.6(c) shows the particles’ distribution. It is
noted that most of the particles gathered in the 231.4 Hz, indication that the optimized first
order natural frequency of the positioning platform is 231.4 Hz. The corresponding optimized
parameters are shown in Table 2. For the purpose of comparison, the optimization results of
GA are also provided. It is noted that the obtained values of geometric parameters are slightly
deferent between the two optimization methods. However, the PSO optimization method can
obtain the higher first natural frequency and thus improve the working bandwidth of the
developed precision positioning platform. This is mainly due to the inherent property of PSO
optimization, which has no crossover and mutation operators.
Fig.7 shows the relationship between the parameters and the first natural frequency,
shown in Tab.3. The first natural frequency is normalized to 100 Hz. it can be seen that the
parameters t and l have more significant influence on the first order natural frequency than the
parameters b and L. The first order natural frequency increases with the increasing t, but
decreases with the increasing l, b and L.
Fig.8 shows the influence of the parameters t and l on the first order natural frequency
and normalized stiffness. It is noted that the influence of parameter l on the first order natural
frequency is more significant than that of parameter t. However, the influence of the
parameter l on stiffness is less than that of parameter t. The first order natural frequency and
stiffness have similar decreasing trends against increasing parameters t and l, respectively.
It can be seen from Figs.7 and 8 that the first order natural frequency and stiffness are
more sensitive to the parameters t and l. In order to develop a high performance positioning
platform, it is crucial and important to conduct the parameter optimization of the
flexure-based mechanism.
5. Finite element analyses
In order to obtain further insights into the performance of the micro/nano positioning
platform, the finite element analysis (FEA) is conducted based on the commercial software
ANSYS. According to the optimized geometric parameters, the finite element model is
established in ANSYS software, as shown in Fig. 9. The element type is chosen as SOLID
92, which is a 3D 10 node element and each node has 3 translational DOF in the x, y and z
directions. In order to improve the computational accuracy, the mapped mesh technique is
conducted in the sections of the leaf hinges. Other sections of the platform are meshed
using smart and free methodology.
Based on the established finite element model, the static analysis is firstly conducted to
obtain the stiffness of the platform in the X and Y directions. Since the stiffness is one of the
not only the working range of the piezo-driven flexure-based mechanism but also the
natural frequency of the entire system. During the static analysis, the constant force with the
magnitude of 10 N is applied on the moving part in the X and Y directions, respectively. The
corresponding displacement of the moving part is collected during the post process of the
FEA. Based on the Hook’s law, the static stiffness of the positioning platform can be
obtained. From the static finite element analyses, it is noted that the stiffness of the platform
is estimated as 4.9 N/µm. After the static analyses, the modal analysis is performed to
extract to first four order mode shapes and the corresponding natural frequencies within the
range from 0 Hz to 2 KHz. The first four order mode shapes are shown in Fig.10. Due to
the symmetric structure, the first two order mode shapes are the translational motion of the
moving part in the Y and X directions with the corresponding natural frequency of 235 Hz.
This is also the desired mobility of the positioning platform. The third order mode shape is
the rotation of the moving part about the Z axis with natural frequency of 713 Hz. The
fourth order mode shape is the translation motion of the moving part in the Z direction with
the natural frequency of 1568 Hz. Based on the values of the natural frequencies, it can be
concluded that the flexure-based mechanism has a lower stiffness in the desired motion
direction, and higher stiffness in other directions. This indicates that the developed
positioning platform can implement 2-DOF positioning and have large capability of
resisting external disturbance. It must be pointed out that the stiffness in the X and Y
directions can be improved by the installed PEAs, and thus the natural frequencies of the
positioning platform can be further improved.
6. Experimental tests
In order to examine the performance of the developed positioning platform and verify
the established mechanical design and optimization methodologies, a number of experimental
6.1 Stiffness measurement
Fig.11 shows the experimental setup for the stiffness test. The platform is fixed on the
optical table Newport RS-4000. The applied force is measured by a pull push force gauge
from ALGOL, and the displacement of the moving part is recorded by laser based sensor from
KEYENCE LK-G5000. The applied force increases from 0 N to 20 N with the step of 2 N,
and the corresponding displacement of the moving part is measured. In order to eliminate the
random error, the measurement procedure is repeated three times. Fig. 12 shows the stiffness
testing results. It is noted that the relationship between the applied force and displacement of
the moving part of the platform is linear. The stiffness can be calculated based on Hook’s law
as 4.97 N/µm. The stiffness comparisons among the analytic computation, FEA and
experimental testing are shown in Table 4. It can be seen that there are marginally discrepancy
between the obtained results. The error between the analytical method and the experimental
test is 1.01% and that between FEA and experimental testing is 1.27%. The errors are mainly
due to the theoretical assumptions of flexure hinges and the machining errors of WEDM for
the prototype manufacture, as well as the sensing and measurement uncertainty of the
experimental measurement system.
6.2 Modal analysis
Fig.13 shows the experimental setup for the modal analysis of the positioning platform.
The impact modal analysis is conducted to obtain the natural frequency of the positioning
platform. Two B&K accelerometers are mounted on the moving part of the platform to
measure the response caused by impact force. An impact hammer provides pulse impact
excitation to the platform and a force sensor attached to the hammer is utilized to measure the
impact force. The force and corresponding acceleration signals are amplified by a charge
amplifier and then sent to the dynamic analyzer instrument. Using the modal analysis
be obtained. In order to reduce the random errors, the average method is adopted to improve
the testing accuracy. A low-pass filter with cutoff frequency of 1 KHz is utilized to eliminate
the external disturbance. Fig.14 shows the obtained experimental results. Due to the
geometric symmetry, the dynamic characteristics in the X and Y directions are almost the same.
The first curve peak corresponds to the first and second order mode shapes with frequency of
231 Hz, and the second curve peak denotes the third mode shape with frequency of 720 Hz.
The first two mode shapes are the translations of the moving platform in the X and Y direction
respectively. The third mode shape is the rotation of the moving platform about the Z axis.
For simplification and without loss generality, Table5 shows the comparisons of the first order
natural frequencies in the X direction among analytic computation, FEA and experimental
testing. It is noted that the experimental result is in good agreement with the analytical
computation and FEA. The errors between the analytical computation, FEA and experimental
tests are respectively 0.87% and 1.73%, respectively. The slight differences mainly result
from the manufacturing errors, sensing and measurement uncertainties, and the theoretical
assumptions of analytical model. However, the experimental testing can validate the
feasibility and reliability of the proposed design and optimization methodologies.
6.3 Workspace test
Fig.15 shows experimental setup for the workspace test. The platform is fixed on the
optical table. The PEA is activated by PEA amplifier THORLABS MDT T693A, and the
displacement of the moving part is measured by laser based sensor from KEYENCE
LK-G5000. The matlab simulink toolbox is used to construct the signal generation and record
code, and then the code is downloaded into the dSPACE DS1103 controller, wich is used to
supply the command signal to the PEA amplifier. The displacement of the moving part is
measured by the laser sensor in real time and the measured signal is collected by the dSPACE
platform is shown in Fig. 16, where the maximum voltage applied at the PEA is 100 V, which
is less than the nominal maximum driving voltage (150 V) to protect the PEAs. Since the
workspace of the developed positioning platform is a square shape, a 2D rectangular
trajectory is utilized to examine the reachable workspace of the platform. It is noted that the
workspace is in excess of 8.0 μm×8.0 μm. The workspace dimension can be further increased
by increasing the driving voltage to the maximum values, and the PEAs with larger nominal
displacement can further improve the workspace. However, due to the hysteresis of the PEAs,
the workspace of the platform is not a regular square. This irregularity may also be induced by
the coupling between the two axes.
In order to examine the coupling effect, the PEA in the Y direction is activated, and both
the displacement of the moving part in the X and Y directions is recorded and plotted in Fig.
17. The displacement of the moving part in the X direction is considered as the coupling
motion. It can be seen from Fig. 17(a) that the hysteresis exists in the trajectory of the moving
part under open loop control condition. The maximum difference between the expansion and
retraction trajectories is approximately 1.42 μm. This hysteresis phenomenon can be
reduced/eliminated by closed-loop control methodology and thus improving the positioning
accuracy of the developed positioning platform. The maximum coupling motion of the
moving part in the Xdirection is 0.04 μm, indicating that the coupling ratio is approximately
0.5%. The coupling ratio in Y direction is about 0.6% when the X direction is activated. These
show the excellent decoupling performance of the developed positioning platform.
7. Conclusions
The mechanical optimization design, dynamic modeling and characterization
methodologies of a flexure-based mechanism have been conducted. A 2-DOF precision
positioning platform is developed based on dual PLSM and the decoupling performance
mechanisms. In order to improve the static and dynamic characteristics of the positioning
platform, PSO optimization approach is utilized to improve the dynamic performance. From
the FEA results, it is noted that the parameters of the dual PLSM link have significant
influences on the first natural frequency and the stiffness of the entire platform. Experimental
results show that the platform has a workspace in excess of 8.0 μm×8.0 μm with a stiffness of
4.97 N/μm and a first natural frequency of 231 Hz, and the coupling ratio is negligible small.
Compared with other 2-DOF mechanisms, the advantage of developed positioning
platform is the high position accuracy and low cross-axis coupling ratio (less than 0.6%) due
to the dual PLSM structure and geometric symmetric design, which can provide high lateral
stiffness for the guide system. The experimental measurement and characterization
demonstrate the effectiveness of the proposed mechanical optimization design and modeling
methodologies. The obtained key enabling techniques can provide the guidelines for the
development of such kinds of compact positioning platform with high decoupling motion
capability.
Acknowledgement
This research is supported by National Natural Science Foundation of China (Nos.
51175372, 51275337), National Key Special Project of Science and Technology of China (No.
2011ZX04016-011), Reserved Academic Program of Peiyang Scholar, and Program for New
Century Excellent Talents in University (No. NCET-11-0374).
References
Ang KK, Dai J (2013) Response analysis of high-speed rail system accounting for abrupt change of foundation stiffness. Journal of Sound and Vibration 332(12): 2954-2970.
Bhagat U, Shirinzadeh B, Tian Y, Zhang D (2013) Experimental analysis of laser interferometry-based robust motion tracking control of a flexure-based mechanism. IEEE Transactions on Automation Science and Engineering 10(2): 267-275.
Casciati F, Wu L (2013) Local positioning accuracy of laser sensors for structural health monitoring. Structural Control & Health Monitoring 20(5): 728-739.
mechanism designer from inverse kinematic solvability constraints. Applied Bionicsand Biomechanics 7(3): 209-216.
Greco G, Lanerc TS, Torrassa S (2013) Microtopography of the eye surface of the crab Carcinus maenas: an atomic force microscope study suggesting a possible antifouling potential. Journal of the Royal Society, Interface/the Royal Society 10(84): 20130122.
Hopkins JB, Panas RM (2012) Design of flexure-based precision transmission mechanism using screw theory. Precision Engineering 37(2): 299-307.
Lee HS, Park JY, Cha SM (2011) Ribbon plastic optical fiber linked optical transmitter and receiver modules featuring a high alignment tolerance. Optics Express 19(5): 4301-4309.
Li YM, Huang JM, Tang H (2012b) A compliant parallel XY micromotion stage with complete kinematic decoupling. IEEE Transactions on Automation Science and Engineering 9(3): 538-553. Li YM, Xu QS (2012a) Design and robust repetitive control of a new parallel-kinematic XY
piezostage for micro/nano-manipulation. IEEE/ASME Transactions on Mechatronics 17(6): 1120-1132.
Li YM, Xu QS (2011) A novel piezo-actuated XY stage with parallel, decoupled and stacked flexure structure for micro/nano positioning. IEEE Transactions on Industrial Electronics 58(8): 3601-3615.
Lin CJ, Lin PT (2012) Particle swarm optimization based feedforward controller for a XY PZT positioning stage. Mechatronics 22(5): 614-628.
Qin Y, Shirinzadeh B, Zhang D (2013b) Compliance modeling and analysis of statically indeterminate symmetric flexure structures. Precision Engineering 37(2): 415-424.
Qin Y, Tian Y, Zhang D, Shirinzadeh B, Fatikow S (2013a) A novel direct inverse modeling approach for hysteresis compensation of piezoelectric actuator in feedforward applications. IEEE/ASME Transactions of Mechatronics 18(3): 981-989.
Tian Y, Liu X, Zhang D, Chetwynd DG (2009a) Dynamic modeling of the fidelity of random surface measurement by the stylus method. Wear 266(5-6): 555-559.
Tian Y, Shirinzadeh B, Zhang D (2009b) A flexure-based mechanism and control methodology for ultra-precision turning operation. Precision Engineering 33(2): 160-166.
Tian Y, Shirinzadeh B, Zhang D (2009c) A flexure-based five-bar mechanism for micro/nano manipulation. Sensors and Actuators A: Physical 153(1): 96-104.
Tian Y, Shirinzadeh B, Zhang D (2010) Design and dynamics of a 3-DOF flexure-based parallel mechanism for micro/nano Manipulation. Microelectronic Engineering 87(2): 230-241.
Tian Y, Shirinzadeh B, Zhang D, Zhong Y (2011b) Modeling and analysis of a 3RRR parallel micro-positioning mechanism. PIMechE Part C, Journal of Mechanical Engineering Science 255(5): 1027-1043.
Verma S, Kin W, Shakir H (2005) Multi-axis maglev nanopositioner for precision manufacturing and manipulation applications. IEEE Transactions on Industrial Application 41(5): 1159-1167.
Xu QS (2014) Design and development of a compact flexure-based XY precision positioning system with centimeter range. IEEE Transactions on Industrial Electronics 61(2): 8931-903.
List of figure and table captions
Fig.1 Schematic diagram of the 2-DOF precision positioning platform
Fig.2 PLSM mechanic model
Fig.3 PRBM model of link
Fig.4 Rotational angle θ1 due to the force F
Fig.5 Flowchart of the PSO optimization approach
Fig.6 PSO optimization process
Fig.7 Relationship between the parameters and the first natural frequency
Fig.8 Relationship between first natural frequency/stiffness and parameters (t and l)
Fig. 9 Finite element model
Fig.10 Modal analyses results
Fig.11 Experimental setup for stiffness test
Fig.12 Static stiffness of the positioning platform
Fig.13 Experimental setup for modal analysis
Fig.14 Frequency responses of the X and Y axes
Fig.15 Experimental setup of workspace test
Fig.16 Workspace of the platform
Fig.17 Hysteresis loop and coupling motion of the platform
Table 1 Material and physical parameters
Table 2 Optimization results of PSO and GA
Table 3 Ranges of the parameters and frequency
Table 4 Results and error of stiffness
X Y
moving part
type A
PEA
type B dual PLSM
half cylinder structure
activated
translational link
connected
link PRBM link fixed end
l
L
b t
(a)
8
(b)
X Y (c)
actual radius EI trajectory
initial position
l
(a)
spring
PRBM link
PRBM radius gl
(b)
F
Ft F
n
θ
θ1
F
Initialize velocity (v) and position (x) randomly
Evaluate all particles
P1 P2 Pn
Pbest1 Pbest2 Pbestn
Pbest
gbest
Optimal design
Y N
………
………
Satisfied?
Fig.6 PSO optimization process a) Converge process of PSO b) Average distance between individuals c) Score histogram
0 10 20 30 40 50
200 250 300 350 400 450 Generation F it n es s v al u e
a) Best fitness Mean fitness
10 20 30 40 50
0 2 4 6 8x 10
-3 Generation Ave rg ae Di st an ce b)
2250 230 235 240 245 250
Fig.7 Relationship between the geometric parameters and the first natural frequency
0.50 0.55 0.60 0.65 0.70
1.5 2.0 2.5 3.0 1.5 2.0 2.5 (mm) N o rm al iz ed p ar am et er (a) t
12 13 14 15 16 17 18
1.5 2.0 2.5 3.0 3.5 (mm) N o rm al iz ed p ar am et er (b) l
4.0 4.4 4.8 5.2 5.6
2.20 2.21 2.22 2.23 2.24 (mm) N o rm al iz ed p ar am et er (c) b
36 38 40 42 44 46 48 50
Fig.8 Relationship between first natural frequency /stiffness and parameters (t and l)
0.501 0.55 0.60 0.65 0.70
1.5 2 2.5 3 (mm) N o rm al iz ed p ar am et er t
first natural frequency stiffness
12 13 14 15 16 17 18
0.2 0.4 0.6 0.8 1 (mm) N o rm al iz ed p ar am et er l
smart mesh
dual PLSM
mapped mesh PRBM link
smart mesh connected link
smart mesh translational
link (b)
[image:29.595.198.395.118.415.2](a)
(a) (b)
(c) (d)
Y X
Z Z
Fig.10. Modal analyses results (a)1st mode shape (235Hz) (b)2nd mode shape
Fig.12 Static stiffness of the positioning platform
0 1 2 3 4 5
0 5 10 15 20 25 30
Displacement (µm)
F
o
rc
e
(N
)
Fig.14 Frequency responses ofthe X and Y axes
0 200 400 600 800 1000
0 20 40 60 80 100 120 140
Frequency (Hz)
A
m
pl
it
ude
(
dB
)
X axis Y axis Peak 1
Fig.16 Workspace of the platform
0 2 4 6 8 10
0 2 4 6 8 10
displacement (µm)
d
is
p
lacem
en
t (
µ
m
)
x
Fig.17 Hysteresis loop and coupling motion of the platform a) The motion in Y
direction b) The motion in X direction
0 20 40 60 80 100
0 2 4 6 8 10 Voltage (V) Di spl ac em ent ( µ m) (a) up down
0 20 40 60 80 100
Table 1 Material and physical parameters
E/(N/m) 0.7×10¹¹
ρ/(kg/m3) 2700
kθ/(Nm/rad) 2.68
γ 0.85
m3/(kg) 0.004
m4/(kg) 0.5
[image:38.595.181.417.276.351.2]d/(mm) 18
Table 2 Optimization results PSO and GA
Parameter PSO GA
L/(mm) 40.0 42
b/(mm) 5.0 5.2
l/(mm) 15.0 16
t/(mm) 0.63 0.57
[image:38.595.179.416.400.464.2]f/(Hz) 231.4 209.6
Table 3 Ranges of the parameters and frequency
Lower bound Upper bound Freq.change
t/(mm) 0.50 0.70 1.0
l/(mm) 12.0 18.0 1.5
b/(mm) 4.0 5.6 0.032
L/(mm) 36.0 50.0 0.035
Table 4 Results and error of stiffness
Analytic FEA TEST ERROR(%)
Stiff.(N/μm) 4.92 4.90 4.97 1.01/1.21
Table 5 Comparisons of natural frequency in the X direction