The influence of self- and peer-reflection on collaborative learning in educational institutions
Abstract
Collaborative learning is a widely used learning technique in educational institutions. However, it is often executed in a way that all its advantages are not used. This is because simply placing students together does not lead to good collaborative learning. It has been shown that the integration of process reflection can solve this problem. Process reflection for collaborative learning in schools can be executed as peer- or self-reflection. This study aimed to demonstrate the effects on collaborative learning when using peer- or self-reflection. Twenty-four
The influence of self- and peer-reflection on collaborative learning in educational institutions Different educational institutions offer diverse learning methods for students. One broadly used method is the collaborative learning approach. Collaborative learning is the process of two or more students working together in a learning situation in order to reach a common goal (Saab, van Joolingen, & van Hout-Wolters, 2007). Research has shown that this type of learning has several advantages compared to for example a teacher centered learning approach. Weinberger, Stegman, & Fischer (2007) found that students can profit from the knowledge of other students. Collaborative learning stimulates students to share skills and knowledge with each other, which leads to a better organization of information and a better construction of knowledge (Saab, van Joolingen, & van Hout-Wolters (2007). The factors of organization and information have a direct influence on the outcome of the collaborative learning and can be seen as the cognitive
performance of the students. Therefore, the cognitive performance can be seen as one of the main indicators of good or bad collaborative performance.
However, research has shown that simply placing students together into groups, does not guarantee successful collaboration. The consequences of bad collaborative learning are the lack of knowledge acquisition (of students), the sucker effect, and the effects of free-riding and social loafing (Kreijns et al, 2003). In order to guarantee successful collaboration, it is important that a social interaction between students is taking place to assure collaborative learning (Kreijns et al., 2003). This is also supported by Weinberger & Fischer (2006), who state that students have to engage in argumentative discussions and interactions to guarantee the acquirement of new knowledge in groups. However, social processes are not only fundamental for collaborative learning. Good collaborative learning provides also the opportunity to increase social and communications skills, develop a positive attitude towards co-members, and build relationships and group cohesion (Johnsons & Johnson, 1989, 1999). This shows that good collaborative learning not only requires, but also stimulates the students to achieve a well-functioning group. These social (non-task-related) processes such as team development, strong group cohesiveness, and feelings of trust and belonging can be referred to as social performance (Phielix, 2012). This shows that social performance is seen as an indicator of good collaborative learning.
instruction on the constructive communication and the learning activities for collaborative learning based on these principles. Further research has shown that instruction supports the knowledge acquisition of students during collaborative learning (Chen, Wang, Kirschner, & Tsai, 2018). From this it can be seen that collaborative learning is only useful when it is executed with the right instructions and when students interact with each other. However, these factors are not always given when students engage in collaborative learning.
In order to solve this problem, research has shown that the lack of social interaction between students can be overcome by including process reflection in collaborative learning (McLeod & Liker, 1992). Process reflection consists of assessing the process, giving feedback on the process and setting a goal to write down the results of the reflection of the process. In this context, assessment is defined as the judgement of a work or process, based on explicit criteria and evidence (Crowell, 2015). In a study by Prins, Sluijsmans & Kirschner (2006), it is stated that assessment gets more effective when it is followed by a reflection. Feedback includes giving and getting information about the current performance, and should reduce the discrepancy between current performance and a desired goal (Hattie & Timperley, 2007). These goals are set in order to note what went well and what should be improved. These goals can be seen as an indicator of good reflection.
Related research has shown that incorporating process feedback in collaborative learning has a positive effect on the motivation, satisfaction and performance of students (Geister et al., 2006). These positive aspects can be improved by using a digital feedback tool, which can help to increase the social processes and improve the feedback (Fjermestad, 2004; Phielix, Prins, Kirschner, Erkens, & Jaspers, 2011). Next to the positive influence of process reflection on the social interaction of students, it is shown that students should reflect on their own learning and on the performance of their peers as well as share explanations and expectations in order to improve their learning process (Baker & Lund, 1997).
do it by themselves and are therefore not dependent on other students. It is also shown that self-reflection encourages students to look to themselves and judge their own work compared to others (Somervell, 1993). Furthermore, students get more aware of their own performance, which can motivate them to reduce discrepancies between the self-described and the actual behavior (Mabe & G. West, 1982). However, students using self-reflection over estimate their own performance (Sullivan & Hall, 1997).
In comparison to self-reflection, peer-reflection is dependent on other students (peers) and has shown to lead to higher responsibility among students, since it encourages them to think more about the learning process, improve their individual- and social interactions and makes them enjoy the assessment (Dochy, Segers, & Sluijsmans, 1999). Furthermore, peer-reflection shows a more realistic assessment of the performance of the students compared to self-reflection (Dochy et al., 1999). In addition to that, research has shown students to work harder when compared with their peers (Klein, 2001).
Current study
Research has shown the advantages of collaborative learning when implemented in the right way. For that, students should not only get placed together, but they should get a clear set of instructions and they should socially interact with each other as stated in the RIDE rules (Saab et al., 2007). Previous research has shown that process reflection in collaborative learning improves student’s social interaction and their general learning (Geister et al., 2006). However, given the two approaches of reflection – self-reflection and peer-reflection- it is not clear which effects they have on collaborative learning. Therefore, the aim of this study is to research the effect that different types of reflections have on the collaborative learning of students. For that purpose, a digital feedback tool for groups designed by researchers from the University of Twente (Eshuis, Vrugte, Anjewierden, Bollen, Sikken, & de Jong, 2019) was adapted and used to answer the following research question:
Does the use of self- or peer-reflection affect the effectiveness of reflection in collaborative
learning?
What is the effect of self- or peer-reflection on the number of goals set by students to
enhance their collaborative learning?
Hypothesis: Students using peer-reflection in collaborative learning set more goals to enhance their collaborative learning and have therefore more aspects that reflect their
collaborative learning process. This comes, because peer-reflection encourages students to think more about their learning process and have a more realistic judgement about their performance (Dochy et al., 1999). The more realistic and therefore better peer-reflection leads to a higher number of negative assessments, which leads to a higher number of goals that state what can be improved.
Secondly, the focus is set on the social interaction of the students. Research has shown that good social interaction is necessary for good collaborative learning. Therefore, the second sub-question is:
What is the effect of self- or peer-reflection on students perceived social performance in
collaborative learning?
Hypothesis: Students using peer-reflection in collaborative learning have a higher perceived social performance than students using self-reflection, because peer-reflection encourages social interaction and more communication about the learning process in the group (Dochy et al., 1999).
Lastly, the focus is set on the outcome of the collaborative learning, more specifically on the cognitive performance and the knowledge acquisition of students. Therefore, the last sub-question is:
What is the effect of self- or peer-reflection on students’ cognitive performance in
collaborative learning?
Hypothesis: Students using peer-reflection in collaborative learning have a better cognitive performance than students using self-reflection because a better social interaction (expected from the second sub-question) leads to better collaborative learning which is connected with a higher amount of knowledge acquisition (Saab, et al., 2007).
A between-groups design was employed. There was one independent variable (form of reflection) with two levels (digital self-assessment and digital peer-assessment). This led to an experiment with two conditions, the condition one was using peer-reflection and the condition two was using self-reflection. For each condition groups of three students were assigned, which received a collaborative task. The tasks (collaborative working task) and information given (presentation of RIDE rules) were the same for both conditions. Just the version of the used reflection tool differed for each condition. To assess the effectiveness of each condition three dependent variables were measured, namely, the amount of set goals, the perceived social performance and the cognitive performance of the students.
Participants
A total of 24 participants in the age group of 9 to 12 years participated (M=11.09, SD=0.44) in the study. Sampling was done through a cluster sampling and included 13 female participants and 11 male participants. All participants go the same fifth class of a German secondary school that prepares them for high school. The participants were assigned to 8 groups of each three students based on a previous received grade. The pre-grades consist of the written and oral performance of the students in history for the last half a year. The grades can vary from 0 points (minimum) to 15 points (maximum). The researcher assigned the groups with an odd number to condition one (peer-assessment) and the groups with an even number were assigned to condition two (self-assessment). The groups were formed in a way that the groups have similar pre-grade averages and therefore condition one and two have no significant differences in their pre-grade with averages of 8.92 points (condition one, using peer-reflection) and 9.08 points (condition two, using self-reflection); t(22)=-0.188, p=.853. The participants have based on their education some experience with collaborative experience but no further knowledge or experience about the digital feedback tool.
Materials
Task. Each group had to prepare a group presentation about a historical topic in the time of the Roman Empire. The topics were given by the teacher to make sure it fitted the syllabus of the class. At the start, each group received historical articles and information that are connected with their topic. The groups had to decide by themselves where they put the focus, how to split up the tasks and in which way they wanted to present their results. This task triggered
which is one of the main goals in a collaborative learning task (Saab et. al, 2006). Therefore, the task was fitting to enable collaborative learning of the students.
Collaboration Instruction. An instruction about good collaboration was given. This instruction was based on the RIDE rules for effective collaborative working. The researcher presented the information to the students before they started working on their collaborative assignment. It started with the general RIDE rules and was followed by a part about each RIDE rule including its sub-rules that give more specific guidelines for each RIDE rule. Each sub-rule was explained with the help of several examples so that the students could connect the
theoretical rules with real world cases. Furthermore, the students were asked to share their own experience from previous collaborative working assignments in order to guarantee that they understand all parts of the RIDE rules. In the end there was space for students to ask questions regarding the RIDE rules.
Collaboration reflection tool. The used digital reflection tool was designed with the aim to enable and improve the reflection of students in a collaborative working environment. The tool was designed by researchers and programmers of the University of Twente (Eshuis et al., 2019) and translated to German. For the purpose of the current research the tool was adjusted in two versions. The first version supports peer-reflection of the students in their group and the second version supports self-reflection of the students.
In the feedback phase a graphical representation of the own assessment or of the peer assessment (depending on the condition) can be seen. For the condition including the peer assessment, an average score for each RIDE rules were presented and could be compared with the assessment provided by other students. After the students saw and understood their results they could go to the next phase.
The last phase, the feed forward phase, the students received questions to each RIDE rule in order evaluate their behavior and set goals for the next time. The questions were, “what went well?” and “what can be improved?”. These questions are supposed to encourage the students’ reflection and their goal setting. To make sure that this evaluation and goal setting is based on the RIDE rules, a brief explanation of each RIDE rule was shown with the questions.
Therefore, the tool has the same structure for both groups, but it was either used individually (self-reflection) or together (peer-reflection) with the other group members. In addition to this, the tool includes the opportunity of goal settings for the group. It was adjusted in a way that the groups either decide on goals for the group together (when using peer-reflection) or decide on goals individually (when using self-reflection).
Feed up phase (self-reflection) Feedback phase (self-reflection)
Figure 1
The three phases of the collaboration reflection tool. First two phases (feed up and feedback) are shown for self-reflection. The third phase (feed forward) is shown for peer- and self-reflection.
Measurements
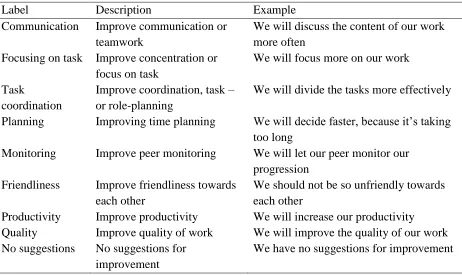
[image:10.612.76.538.422.698.2]Goals. The number of set goals in the reflection for each condition was counted by the researcher. In order to be able to compare the results, the goals in condition one (peer-reflection) of each group were counted as the same for each individual, the individual counting was done for the students in condition two (self-reflection).To make sure that the coding was reliable, a coding scheme from Phielix (2011) was adopted. The coding scheme consists of nine categories and can be seen in the table 1. If the goal set by students fit in one of the first eight categories, it was counted as a set goal. Every comment that was part of the ninth category (no suggestion) or did not fit at all, was not counted as a goal. This coding scheme was used because it has shown to cover all goals that are important for collaborative learning. The goals were just assessed on their quantity and not their quality because the set goals showed a similar level of quality.
Table 1
Coding scheme for set goals to improve collaborative working in the group
Label Description Example
Communication Improve communication or teamwork
We will discuss the content of our work more often
Focusing on task Improve concentration or focus on task
We will focus more on our work Task
coordination
Improve coordination, task – or role-planning
We will divide the tasks more effectively Planning Improving time planning We will decide faster, because it’s taking
too long
Monitoring Improve peer monitoring We will let our peer monitor our progression
Friendliness Improve friendliness towards each other
We should not be so unfriendly towards each other
Productivity Improve productivity We will increase our productivity Quality Improve quality of work We will improve the quality of our work No suggestions No suggestions for
improvement
Social Performance Questionnaire. A questionnaire about social performance in groups was used. The questionnaire gives an overview of the group’s cohesiveness, development of positive relationships, feelings of trust and belonging, and sense of community (Phielix, 2012). The questionnaire was designed, tested and used by Phielix (2011) and translated into German. The questionnaire consists of 30 items and includes four different validated scales which were transformed into a five-point Likert scale. The four scales were originally designed by different researchers, the intra-group conflict scale was adapted from Saavedra, Early & van Dyne (1993), the instructional beliefs about problem-based collaboration scale was adapted from Clarebout, Elen & Lowyck (1999), the team development scale was adapted from Kormanski (1990) and the group-satisfaction scale was adapted from Savicki, Kelly & Lingenfelter (1996). This questionnaire was chosen, because it was used in a similar research and had good
reliabilities. The intra-group conflict scale tests the level of perceived amount of conflict between the group members and has an excellent reliability with a Cronbach’s alpha of .92 (7 items). The scale of ‘instructional beliefs’ about problem-based collaboration tests the perceived level of group effectiveness and how group members felt about working and solving problems in a group, and has a good reliability with a Cronbach’s alpha of .81 (7 items). The scale of ‘team
development’ provides information about the perceived level of group coherence and has an
excellent reliability with a Cronbach’s alpha of .92 (10 items). The fourth scale is the ‘
group-satisfaction’ scale which tests the perceived satisfaction of the group functioning and has an
acceptable reliability with a Cronbach’s alpha of .76 (6 items). The Cronbach’s alpha of the constructed scale ‘social performance’ has an excellent reliability with Cronbach’s alpha of .90 (Phielix, 2011). After the translation into German the reliabilities of the scales decreased. There was a good reliability for ‘team development’, a questionable reliability for ‘intra-group
conflicts’ and ‘group-process satisfaction’ and a poor reliability for ‘attitude towards
collaborative problem solving’(see Table 2). Question 13 of the questionnaire (subscale
Instructional beliefs about problem-based collaboration) had to be excluded, because there were major understanding problems of the students, which could also be seen in the reliability. The reliability of the subscale increased from a Cronbach’s alpha of .28 to Cronbach’s alpha of .51. Table 2
Scale k Example Cronbach’s alpha Intra-Group conflicts 7 I found myself unhappy and in conflict with
members of my group
.59
Attitude towards collaborative problem solving
6 Collaborating in a group is a challenge .51
Team development 10 Group members contribute ideas and solutions to problems
.84
Group-process satisfaction
6 I felt that my group worked very hard together to solve this problem
.66
Perceived Social performance (total)
29 (See all items of four scales stated above) .83
Assessment of the cognitive performance. For the measurement of the cognitive performance each group presentation was assessed by an experienced teacher in the field of history and lots of grading experience. Each student in the group received the same grade. The grade consisted of three different components namely, the structure and content of the
presentation, the presentation style and task distribution, and the inclusion of the other students and answering questions of them. However, this can still be seen as a reliable measurement for cognitive performance of the students because the main part of the grade consisted of the content of the presentation and the answering of question towards their topic. These two factors are directly connected with the cognitive performance. The assessment scale was the German Grading system where the best grade is 15 points and the lowest grade are 0 points. A student passes with 5 points.
Procedure.
school setting during a group work lasting three session. The parents and legal guardians received an informed consent from the school, which included information about the research provided by the researcher. The whole study consisted of three sessions. The first and the third session took each 90 minutes and the second session took 45 minutes. The three sessions took place in the same week. The collaborative group assignment was part of the syllabus in the class of history and was instructed by the teacher. The first session started by a general introduction of the researcher where the students were informed about the schedule and the goals (improvement of collaborative learning) of the study. It was followed by a presentation of the RIDE rules which explains good collaborative working. It was made sure that all students understood and could apply these rules in their collaborative working assignment. These instructions of the researcher took around 20 minutes. Afterwards, the teacher took over and explained the task to the students. The students worked on this assignment in groups of triads for around 45 minutes. In the last 25 minutes, the researcher presented the collaboration reflection tool and gave instructions how to use it. The students did not get any information whether they were assigned to condition one(peer-reflection) or two(self-reflection). The first session ended with the use of the
collaboration tool where the students reflected on the first session of their group assignment. The second session had only two different parts and was therefore shorter. Firstly, the students worked around half an hour in their groups at the collaborative assignment and afterwards they used the collaborative reflection tool. In the second session the reflection tool was used as an offline version, because there were limitations on the available time for this session. The paper pen version included the same reflections and goal settings as the online version, but it could be executed in the classroom and without any technical devices of the computer room. The last session had three parts. The first part was finalizing the group assignment and took around 50 minutes. Afterwards, the students had around 20 minutes to use the collaborative reflection tool for the last time. The last part for the students was to complete the social performance
questionnaire which took around 20 minutes. The presentations took place a week after the last session and were graded by the teacher.
In order to answer the first sub-question about the effect of self- or peer-reflection on the
amount of the goals set by the students to enhance their collaborative learning, an independent
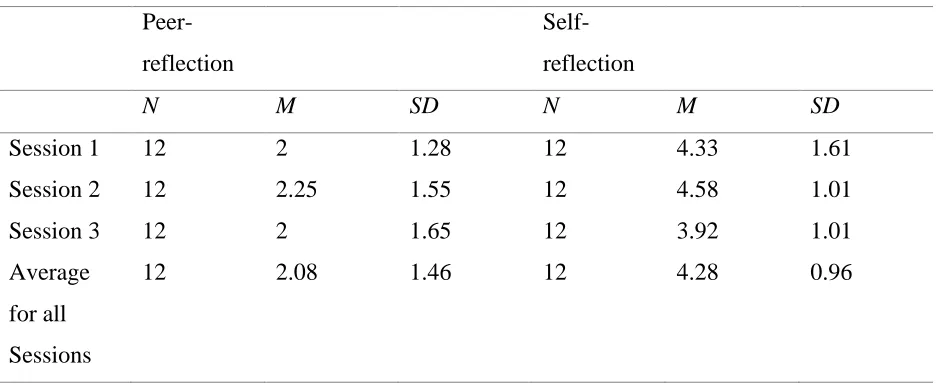
[image:14.612.73.546.276.471.2]t-test was executed. In this case the independent variable was the condition (peer-reflection vs self-reflection) and the dependent variable was the set goals per students. The independent t-test revealed that the groups using self-reflection (condition two) had a significantly higher number of set goals per students than the groups using peer-reflection (condition one), t(22)=-4.339; p<0.001, with a difference of the means of d=1.33(SD) (see table 3).
Table 3
Descriptive statistics for goal settings per group
Peer-reflection
Self-reflection
N M SD N M SD
Session 1 12 2 1.28 12 4.33 1.61
Session 2 12 2.25 1.55 12 4.58 1.01
Session 3 12 2 1.65 12 3.92 1.01
Average for all Sessions
12 2.08 1.46 12 4.28 0.96
Sub- Question 2
In order to answer the second sub-question about the effect of self- or peer-reflection on
the students’ perceived social performance in collaborative learning, a one-way MANOVA was
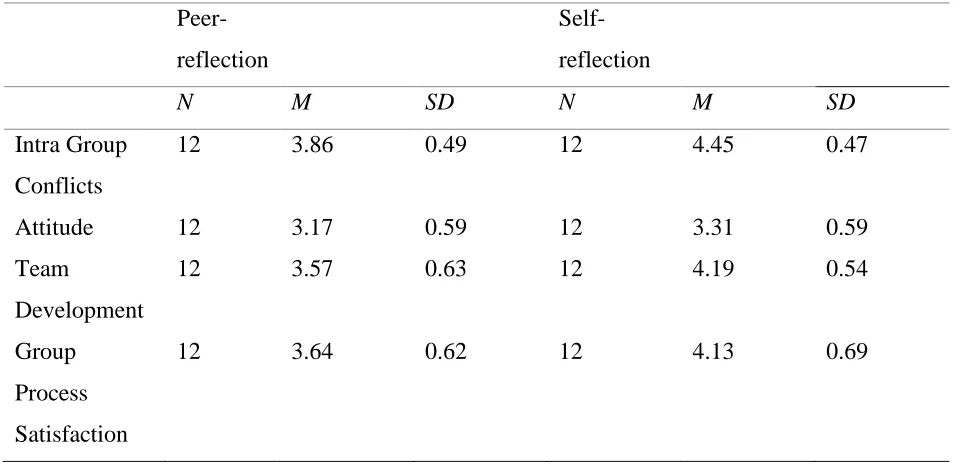
executed. In this case the independent variable was the condition (peerreflection vs. self -reflection) and the dependent variables were the subscales of the social performance questionnaire. The results show an overall significant effect of the independent variable
(condition) on the social performance variables, Wilk’s Lambda = .589, F(4,19)=3.31; p=.032. The tests of between-subjects effects revealed that there were significantly higher values for the self-reflection condition for the intra group conflict scale, F(1,22)=9.25; p=.006, with a
difference between conditions for the instructional beliefs about problem-based collaboration
scale, F(1,22)=0.34; p=.569, andthe group-process satisfaction scale, F(1,22)=3.28; p=.084(see
[image:15.612.70.553.195.428.2]table 4).
Table 4
Descriptive statistics of the perceived Social Performance
Peer-reflection
Self- reflection
N M SD N M SD
Intra Group Conflicts
12 3.86 0.49 12 4.45 0.47
Attitude 12 3.17 0.59 12 3.31 0.59
Team
Development
12 3.57 0.63 12 4.19 0.54
Group Process Satisfaction
12 3.64 0.62 12 4.13 0.69
Sub-Question 3
In order to answer the third sub-question about the effect of self- or peer-reflection on the
students’ cognitive performance in collaborative learning an independent t-test was executed.
The test revealed that there was no significant difference in cognitive performance between students using peer-reflection and students using self-reflection, t(14)=1.603; p=0.13 (see table 5).
Table 5
Descriptive Statistics of the Cognitive Performance
Peer-reflection
Self-reflection
Cognitive Performance
12 11.25 0.87 12 10 2.56
Discussion
The aim of the current study was to investigate whether self- or peer-reflection affect the effectiveness of reflection in collaborative learning. The results clearly show that the type of reflection affects the effectiveness of the reflection regarding the number of set goals and the perceived social performance. No effect was found on the cognitive performance of the students.
The first major finding was that students using self-reflection in collaborative learning set more goals than students using peer-reflection. This is contrary to the initial expectation that students using peer reflection would set more goals, therefore, the first hypothesis was rejected. Previous research showed that peer-reflection leads to more exchange of individual experiences of students which would be connected with a higher number of things that can be reflected on and therefore more set goals (Falchikov, 1995). However, as can be seen this was not the case in the current research.
One possible explanation for the contradictory result in the current research is the participants young age. Mercer (1996) states that young students often have difficulty engaging spontaneously in good cooperative discussions because they are not aware of what is expected of them. Since students already had difficulty getting into good cooperative discussions, this could explain the smaller number of set goals in the peer-reflection condition compared to students executing self-reflection. Students in the self-reflection condition did not have to engage in cooperative discussions during the reflection and could therefore concentrate more on
themselves and their own reflection. Furthermore, peer reflection is more time consuming which can lead to less time to come up with goals. The findings show that self-reflection leads to a higher number of set goals compared to peer-reflection.
(2012) who state that there is no correlation between the number of reflections (set goals) and the outcome performance of the students.
Therefore, future research should focus on the quality of the reflection instead of the number of set goals.
The second major finding showed that students experience a better social performance when using self-reflection instead of peer-reflection. This is contrary to the initial expectation that students using peer reflection would perceive a better social performance. Therefore, the second hypothesis was rejected. Even though this is not in line with previous research (Dochy et al., 1999), the study shows some more specific outcomes. It can be seen that students using peer-reflection perceive more conflicts and less team development in their groups. This can be the result of increased critique and a lack of constructive feedback of the students. As shown by Prilla, Degeling & Herrmann (2012), young students need the practice and experience to be able to reflect together. Furthermore, as previously mentioned, young students struggle with engaging in good collaborative interaction spontaneously (Mercer, 1996). Poor peer-reflection can lead to reduced and worse communication and increased conflict in a group, which can explain the found results. These problems occur less when using self-reflection because students do not interact with each other for the reflection. Furthermore, peer-reflection shows a more realistic assessment of the performance of the students compared to self-reflection (Dochy et al., 1999). This leads to the fact that students get more aware of their own pitfalls and mistakes. This can also lead to a more realistic and consequently in a more negative perception of the learning situation which can be seen in the lower perceived social performance of the students using peer-reflection.
Despite the conditions consisting of similar groups based on the pre-grades of the students, it is important to take into account when interpreting the results, that the perceived social performance is also influenced by the previous social interaction and sympathy between students. Therefore, it can be that the groups had differences before the collaborative group work. Regardless of this being a limitation that counts for both conditions, in future research the social interaction between the students should be taken into account before the study by
measuring the social performance beforehand.
expectation that students using peer reflection have a better cognitive performance. Therefore, the third hypothesis was rejected. Previous research has shown that peer-reflection is connected with better collaborative learning and therefore leads to a better cognitive performance (Saab et al., 2007). However, research has also shown that social performance has a direct influence on cognitive performance (Prilla et al., 2012). This could explain why there was no difference between the conditions. As seen from the results, students using peer-reflection perceived a lower level of social performance and decreased the positive effect of on the cognitive performance compared to students using self-reflection. Literature shows that there are more factors that influence the group achievement and therefore the cognitive performance of students. For example, a good group leadership and a higher level of perceived individual accountability can influence the cognitive performance of the students (An, Kim & Kim, 2008). These factors can have an influence on the cognitive performance and can have balanced the consequences of the lower social performance.
Another factor that has an influence on the results is the construction of the final grade that was used as a measurement for the cognitive performance. The grade did not only consist of factors that are directly connected with cognitive performance (content and answering of
questions regarding the topic), the grade consisted also of factors that were not related with cognitive performance such as presentation style and the structure of the presentation.
For practice it means that the type of reflection has no direct influence on the cognitive performance and that students should be encouraged to use either of the reflection types. By deciding which reflection should be chosen, it should be seen what is more suitable for the situation and external factors like time management, preferences of the students or organizational aspects can be taken into account.
For this study it should be taken into account that the groups were assembled based on the best available pre-grade of the students. However, this grade did not only cover assessment for collaborative learning but also for other parts of the class. For future research it would be more precise to use grades from previous collaborative learning exercises but this limitation counts for both conditions. In addition to that, the final grade that was used to measure the cognitive performance, should only include factors that are directly related with the cognitive performance. A possible solution would be a domain knowledge test or an individual
leadership or the individual accountability of the students that could mediate between the type of reflection and cognitive performance. Perceived social performance alone cannot explain the cognitive performance of the students.
Next to some limitations regarding the sub-question, some general limitations can be found. Firstly, the limited experience of the students with computers may have had an influence on the current research. Only a small part of the students was capable of writing in an acceptable pace on the computer and were able to understand all basic functions of the computer. Most students needed a lot of time for simple tasks like logging in and writing down goals. This led to distraction during the reflection phase and the full potential of the digital feedback tool could not be used. Especially, students in the peer-reflection condition struggled to state the goals together in the digital feedback tool, because the tool was more complex for peer-reflection. The higher complexity of the tool made it more difficult to concentrate on the peer-reflection and time and effort was used to understand and handle the complexity of the digital tool. This problem did not occur for the offline version of the feedback tool. Furthermore, the digital feedback tool had sometimes small issues such as freezing which lead to minor distraction during the reflection sessions. However, this problem occurred for both condition and has no influence on the results. For further research with this tool, these technical issues should be corrected as well as minor understanding problems should be fixed. Therefore, the social performance questionnaire should be tested for each age group and different translations to guarantee the tool is completely
understandable. There were minor understanding problems of the questionnaire. The students had major understanding issues with one question, which had to be excluded afterwards for both conditions.
Future research should focus on effects of self- and peer-reflection in different age groups. Mercer (1996) stated that young students have more difficulty with engaging in good cooperative dialogue, it should be researched in which age group peer- and self-reflection could increase its advantages. Furthermore, it is stated that students need instruction and experience in order to execute good peer-reflection (Prilla et al., 2012). In future research it should be tested if the addition of instructions for precise and constructive feedback can improve the quality of peer-reflection.
References
Baker, M., & Lund, K. (1997). Promoting reflective interactions in a CSCL environment. Journal
of Computer Assisted Learning, 13, 175-193. doi:10.1046/j.1365-2729.1997.00019.x
Bell, S. (2010). Project-Based Learning for the 21st Century: Skills for the Future. The Clearing
House: A Journal of Educational Strategies, Issues and Ideas, 83(2), 39-43.
doi:10.1080/00098650903505415
Chen, J., Wang, M., Kirschner, P. A., & Tsai, C.-C. (2018). The Role of Collaboration, Computer Use, Learning Environments, and Supporting Strategies in CSCL: A Meta-Analysis.
Review of Educational Research, 88(6), 799-843. doi:10.3102/0034654318791584
Clarebout, G., Elen, J., & Lowyck, J. (1999, August). An invasion in the classroom: Influence on instructional and epistemological beliefs. Paper presented at the eighth bi-annual
conference of the European Association of Research on Learning and Instruction (EARLI),
Goteborg, Sweden.
Crowell, T. L. (2015). Student Self Grading: Perception vs. Reality. American Journal of
Educational Research, 3(4), 450-455. doi:10.12691/education-3-4-10
Dochy, F., Segers, M., & Sluijsmans, D. (1999). The use of self-, peer and co-assessment in higher education: A review. Studies in Higher Education, 24(3), 331-350. doi:10.1080/03075079912331379935
Duijnhouwer, H., Prins, F. J., & Stokking, K. M. (2012). Feedback providing improvement strategies and reflection on feedback use: Effects on students’ writing motivation, process, and performance. Learning and Instruction, 22(3), 171-184.
doi:https://doi.org/10.1016/j.learninstruc.2011.10.003
Eshuis, E., Vrugte, J., Anjewierden, A., Bollen, L., Sikken, J., & de Jong, T. (2019). Improving the quality of vocational students’ collaboration and knowledge acquisition through
instruction and joint reflection.
Falchikov, N. (1986). Product comparisons and process benefits of collaborative peer group and self assessment. Assessment and Evaluation in Higher education, 11(2), 146-166. doi: 10.1080/0260293860110206
Falchikov, N. (1995). Peer Feedback Marking: Developing Peer Assessment. Innovations in
Fjermestad, J. (2004). An analysis of communication mode in group support systems research.
Decis. Support Syst., 37(2), 239-263. doi:10.1016/s0167-9236(03)00021-6
Geister, S., Konradt, U., & Hertel, G. (2006). Effects of Process Feedback on Motivation, Satisfaction, and Performance in Virtual Teams. Small Group Research, 37(5), 459-489. doi:10.1177/1046496406292337
Klein, W. M. P. (2001). Post Hoc Construction of Self-Performance and Other Performance in Self-Serving Social Comparison. Personality and Social Psychology Bulletin, 27(6), 744-754. doi:10.1177/0146167201276009
Kormanski, C. (1990). Team building patterns of academic groups. The Journal for Specialists in
Group Work, 15(4), 206-214.
Kreijns, K., Kirschner, P. A., & Jochems, W. (2003). Identifying the pitfalls for social interaction in computer-supported collaborative learning environments: a review of the research.
Computers in Human Behavior, 19(3), 335-353.
https://doi.org/10.1016/S0747-5632(02)00057-2
Mabe, P., & G. West, S. (1982). Validity of Self-Evaluation of Ability: A Review and
Meta-Analysis (Vol. 67).
McLeod, P. L., Liker, J. K., & Lobel, S. A. (1992). Process Feedback in Task Groups: An Application of Goal Setting. The Journal of Applied Behavioral Science, 28(1), 15-41. doi:10.1177/0021886392281003
Mercer, N. (1996). The quality of talk in children's collaborative activity in the classroom.
Learning and Instruction, 6(4), 359-377. https://doi.org/10.1016/S0959-4752(96)00021-7
Phielix, C. (2012). Enhancing Collaboration through Assessment & Reflection.
Phielix, C., Prins, F. J., Kirschner, P. A., Erkens, G., & Jaspers, J. (2011). Group awareness of social and cognitive performance in a CSCL environment: Effects of a peer feedback and reflection tool. Computers in Human Behavior, 27(3), 1087-1102. https://doi.org/10.1016/j.chb.2010.06.024
Prilla, M., Degeling, M., & Herrmann, T. (2012). Collaborative reflection at work. Proceedings
Of The 17Th ACM International Conference On Supporting Group Work - GROUP '12.
Prins, F. J., Sluijsmans, D. M. A., & Kirschner, P. A. (2006). Feedback for General Practitioners in Training: Quality, Styles, and Preferences. Advances in Health Sciences Education, 11(3), 289. doi:10.1007/s10459-005-3250-z
Saab, N., Van Joolingen, W. R., & Van Hout-Wolters, B. H. A. M. (2007). Supporting communication in a collaborative discovery learning environment: The effect of instruction. Instructional Science, 35(1), 73-98. doi:10.1007/s11251-006-9003-4
Saavedra, R., Early, P. C., & Van Dyne, L. (1993). Complex interdependence in task-performing groups. Journal of Applied Psychology, 78, 61–72.
Savicki, V., Kelley, M., & Lingenfelter, D. (1996). Gender, group composition, and task type in small task groups using computer-mediated communication. Computers in Human
Behavior, 12, 549–565.
Somervell, H. (1993). Issues in Assessment, Enterprise and Higher Education: the case for self‐ peer and collaborative assessment. Assessment & Evaluation in Higher Education, 18(3), 221-233. doi:10.1080/0260293930180306
Sullivan, K., & Hall, C. (1997). Introducing Students to Self‐assessment. Assessment &
Evaluation in Higher Education, 22(3), 289-305. doi:10.1080/0260293970220303
Weinberger, A., & Fischer, F. (2006). A framework to analyze argumentative knowledge construction in computer-supported collaborative learning. Computers & Education, 46(1), 71-95. https://doi.org/10.1016/j.compedu.2005.04.003
Appendix Social performance questionnaire translated into German
Aussage Trifft
gar nicht zu Trifft eher nicht zu Trifft teils zu/trifft teils nicht zu Trifft eher zu Trifft voll zu
Es war eine große Anspannung zwischen unseren Gruppenmitgliedern
Die Gruppenmitglieder haben sich nicht gegenseitig gestört
Die meisten Gruppenmitglieder kommen gut miteinander aus
Die Art wie sich andere Gruppenmitglieder verhalten haben, hat mich oft frustriert
Ich fühlte mich unwohl und hatte Konflikte mit anderen Gruppenmitgliedern
Leute, von denen meine Arbeit abhängig war, haben mich oft im Stich gelassen
Ich hatte Konflikt mit anderen
Gruppenmitgliedern wegen falschem oder fehlendem Verhalten
In einer Gruppe eine Aufgabe zu bearbeiten ist langweilig
Probleme in einer Gruppe zu lösen ist langweilig Gruppenarbeiten sind effizient
Es fordert mich heraus komplexe/aufwendige Probleme zu lösen
Es fordert mich heraus in einer Gruppe zu arbeiten
Es ist nicht effizient in einer Gruppe zu arbeiten Es fordert mich heraus Probleme in einer Gruppe zu lösen
Alle Gruppenmitglieder sind freundlich, sorgen sich umeinander und interessieren sich
füreinander
Alle Gruppenmitglieder erkennen Konflikte in der Gruppe und gehen sie an
Alle Gruppenmitglieder hören einander verständnisvoll zu
Alle Gruppenmitglieder schließen andere in den Entscheidungsprozess ein
Alle Gruppenmitglieder erkenne und respektieren persönliche Unterschiede
Alle Gruppenmitglieder bringen Ideen mit ein Alle Gruppenmitglieder wertschätzen die Ideen anderer
Alle Gruppenmitglieder erkenne gute Gruppenleistungen
Alle Gruppenmitglieder schätzen die Kommentare der anderen
Ich habe es genossen mit meinen Gruppenmitgliedern zu reden
Ich habe mich gut gefühlt, dass ich mit meiner Gruppe zu einem Ergebnis gekommen bin Es hat sich nicht so angefühlt, dass andere Schüler mir zugehört haben, wenn ich eine Idee hatte
Ich konnte meine Gedanken und Gefühle jederzeit mit meiner Gruppe teilen
Ich hatte nicht das Gefühl, dass die anderen meine Gedanken und Gefühle verstanden haben Ich hatte das Gefühl, dass meine Gruppe hart zusammen an der Aufgabe gearbeitet hat
Original subscales in English
Intra-group conflict scale (Saavedra, Early & Van Dyne, 1993)
3 (‘Most people in our group got along with one another’)
4 (‘Given the way group members performed their roles I often felt frustrated’)
5 (‘I found myself unhappy and in conflict with members of my group’) 6 (‘People I depended on to get my job done in the group often let me
down’)
7 (‘I found myself in conflict with other group members because of their actions (or lack of actions)’)
Instructional beliefs about problem-based collaboration (Clarebout, Elen & Lowyck, 1999)
1 2 3 4 5 1 Working on a task in a group is boring
2 Solving problems in a group is boring 3 Working in a group is efficient
4 Solving complex problems is challenging 5 Working in a group is challenging
6 Working in a group is inefficient
7 Solving problems in a group is challenging Team Development Scale (Kormanski, 1990)
1. Commitment--Group members understand group goals and are committed to them. 2. Acceptance--Group members are friendly, concerned, and interested in each other. 3. Clarification--Group members acknowledge and confront conflict openly.
4. Belonging--Group members listen with understanding to others.
5. Involvement--Group members include others in the decision-making process. 6. Support--Group members recognize and respect individual differences. 7. Achievement--Group members contribute ideas and solutions to problems. 8. Pride--Group members value the contributions and ideas of others.
9. Recognition--Group members recognize and reward group performance.
10.Satisfaction--Group members encourage and appreciate comments about group efforts. Group-process Satisfaction Scale (Savicki, Kelly & Lingenfelter, 1996)
1. I enjoyed talking with my group on the network.
2. I felt good that I could participate with my group in coming to a conclusion about the problem.
3. I did not feel that people listened to me when I had an idea about the problem. (R)
4. I felt that I could express my thoughts and feelings openly to others on the network while solving the problem.