1
Illness perceptions and depression
after stroke
Bachelor Psychology year 3
Bachelor’s thesis
Supervisors: Dr. Erik Taal & Dr. Christina Bode
Samuel Kölsch
2
Abstract
In the current study, it was investigated both the development of illness perceptions and
depressive symptoms as well as the correlation of the respective constructs. Depression in
stroke patients is a well-known phenomenon, which negatively impacts the course of the
disease. Furthermore, earlier findings showed that illness perceptions are related to depressive
symptoms in several diseases. However, the relation between the two constructs has never been
examined with a sample of stroke patients. Therefore, it was executed a prospective
observational cohort study with 51 stroke patients. It was examined the relation between
depressive symptoms and illness perceptions as well as the development of the separate
constructs. The constructs were assessed by means of questionnaires that were filled out one
week after stroke, 3, 6 and 12 months after study onset. The main findings were that there is no
significant change in the mean scores of the respective constructs over time. Furthermore, there
were found multiple strong correlations between illness perceptions and depressive symptoms
at several time points. The results have to be considered carefully because there was a high
dropout rate. Consequently, only 25 participants finished the study to the end, and a selective
dropout may have biased the results. Concludingly, the present study found a strong positive
relation between perceived threat of the illness and depressive symptoms, which indicates that
on average the more threatening stroke patients perceive their illness the more depressive
symptoms they have and vice versa.
Introduction
Ischemic stroke is a severe damage to the nervous system, which impacts both physical
as well as mental aspects of affected patients. One of the mental consequences is known as Post
stroke Depression (PSD). Interestingly, the development of depression after stroke varies from
patient to patient. One factor that may play a role in the development of depression is the illness
perception of stroke patients, since in other chronic diseases illness perceptions are related to
depression (Westbrook, Maddocks, & Andersen, 2016). Nevertheless, the correlation between
illness perception and PSD has not been researched yet. Therefore, the aim of the present study
3 Stroke: Etiology, Prevalence and Impact
Stroke is traditionally defined as a neurological dysfunction, which is caused by
infarction or hemorrhage in a part of the brain, in the spinal cord or in the retina (Hankey, 2017).
In the global ranking of the most burdensome diseases in 2010, stroke was ranked on the third
place behind heart disease and respiratory infection (Murray et al., 2012). The number of stroke
patients is rising significantly. Strong, Mathers and Bonita (2007) prognosed that without any
intervention, the number of global first-ever strokes will rise to 23 million in 2030. Stroke leads
to multiple severe health consequences, such as sensory, motor and cognitive difficulties.
Furthermore, stroke patients generally have trouble to maintain their balance and to walk
(Mansfield et al., 2018).
Besides physical restrictions, stroke also has a negative impact on patient’s mental
health. Narushima and Robinson (2002) showed that stroke is a clear risk-factor for depression.
First, in order to prevent confusion, it has to be made a distinction between clinical depression
and depressive symptoms. A clinical depression or major depressive disorder is a mental illness,
which can only be diagnosed, if the patient displays five of the 9 DSM-5 criteria (American
Psychiatric Association, 2013). In contrast, depressive symptoms do not imply a mental
disorder but rather refer to specific symptoms related to depression such as fatigue or loss of
energy. In the present study depressive symptoms are analyzed regarding their relation with
illness perceptions.
Depressive symptoms in stroke patients
The prevalence of depressive symptoms in stroke patients varies across studies between
18% to 61% due to different samples, questionnaires or study-designs (Srivastava, Taly, Gupta,
& Murali, 2010). Hackett, Yapa, Parag, and Anderson (2005) found in their systematic review
of observational studies until 2004 that 33% of stroke patients experience significant depressive
symptoms at any given time after stroke onset. Longitudinal studies, regarding the course of
depression after stroke onset provide contradictory results. On the one hand, Verdelho, Henon,
Lebert, Pasquier, and Leys (2004) found in a hospital-based study a gradual decrease of
depressive symptoms in stroke patients. Thus, in the first assessment after 6 months 43% of the
stroke patients displayed depressive symptoms. After 1 year the value decreased to 36%, after
2 years to 24% and finally to 18% after 3 years. In contrast, King, Shade-Zeldow, Carlson,
Feldman, and Philip (2002) found an initial decrease of depressive symptoms after 1 year (from
4
PSD decreases mental recovery, physical recovery and increases the mortality risk of
stroke patients (Narushima & Robinson, 2002). Consequently, PSD should be considered in the
treatment of patients in order to improve the recovery process. There may be multiple reasons
for the development of PSD. Westbrook et al. (2016) investigated the risk-factors of PSD by
means of a meta-analysis. They found that the main risk factor is a history of mental illness.
Moreover, female gender, severity of stroke and level of handicap are risk factors for the
development of depression in stroke patients (Westbrook et al., 2016). Another factor that may
be related to PSD are the illness perceptions, patients have about their disease. The relation
between illness perception and PSD is unclear yet. However, studies constantly showed a
relation between certain dimensions of illness perceptions and depression in other chronic
diseases such as cancer (Westbrook et al., 2016; Llewellyn, McGurk, & Weinman, 2007).
Hence, generally if patients perceive their disease as chronic severe and incurable, they are
more likely to develop depressive symptoms (Westbrook et al., 2016; Llewellyn et al., 2007).
In turn, depressive symptoms are associated with passive coping strategies, impacting the
course of the disease negatively (Crane & Martin, 2004). Consequently, it is crucial to take
illness perceptions into account to improve the recovery process. Accordingly, a study of a
sample with the autoimmune disease SLE showed that a positive change of illness perceptions
leads to reduced levels of stress and improved physical as well as mental well-being (Goodman,
Morrissey, Graham, & Bossingham, 2005).
Illness perceptions
Illness perceptions are part of a broader model: The Common-Sense Model of
self-regulation (CSM) (Hale, Treharne, & Kitas, 2007). Leventhal and colleagues developed the
CSM to investigate the perception of health threats, coping mechanisms and the appraisal of
coping mechanisms in the face of diseases. The model is hierarchically organized and consists
of three main constructs. The first construct “representation” refers to the illness perceptions
patients have, based on their experience. On the basis of these illness perceptions, patients try
to manage the impact of their disease, which is summarized under the second construct
“coping”. Finally, the third construct “appraisal” implies an assessment and eventual
modification of the former used coping strategies (Leventhal et al., as cited in Hale et al., 2007).
Illness perceptions are the core concept of the CSM because they are the foundation for
coping and planning strategies, patients use to deal with their disease. Accordingly, Heijmans
(1999) found that patients who perceive their illness as being chronic, severe and uncontrollable
5
is crucial because they influence coping mechanisms and in turn the course of the disease.
Illness perceptions are divided in five dimensions: Identity, Cause, Time-line, Consequences,
Curability/controllability (Hale et al., 2007). The first dimension “identity” is about labeling
the disease with all of its related symptoms. The second component is the “cause”of the disease,
which is developed by personal experiences, the opinion of doctors and significant others as
well as media sources. The third concept “time-line” describes the belief of patients of how
long the disease will last. The “consequences” are the patients beliefs about the physical and
social impact their disease will have in the future. The “curability/controllability” is not only
the patients perception of the curability of their disease but also the extent to which they believe
to have control over their disease (Hale et al., 2007).
The main questionnaire measuring the five dimensions of illness perception is the
IPQ-R (Illness Perception Questionnaire-IPQ-Revised). However, in the present study the brief IPQ is
used for the measurement. In contrast to the IPQ-R, the brief IPQ contains 9 dimensions.
Namely, in the brief IPQ there are added the dimensions: coherence, emotional representation,
concern and the dimension of control is divided into personal control and treatment control
(Broadbent, Petrie, Main, & Weinman, 2006).
Relation between illness perceptions and depressive symptoms
Research shows that the illness perceptions, patients hold about their disease are related
to depression (Westbrook et al., 2016; Llewellyn et al., 2007). However, in most of the studies
about illness perception’s relation to depression, the subjects consist of cancer patients. Since
the disease of cancer differs significantly from stroke, the results of the studies have to be
applied carefully. Nevertheless, the studies can be used as an indication for stroke patients
because both diseases are similar in some respects. Both stroke and cancer are chronic diseases
that have a severe impact on patients mental and physical health. Furthermore, in both
conditions patients tend to withdraw from social activities (Mansfield et al., 2018).
First, the results of Hagger and Orbell (2006) showed a relation between the different
dimensions of illness perception and depression in cervical- and colorectal cancer patients.
They found that perceived control was significantly correlated both with anxiety and depression
in the colorectal sample. Thus, patients who thought they were not able to influence their bowel
problems were more prone to depression. Additionally, identity was significantly associated
with depression. Hence, the more patients perceived their symptoms as severe the more likely
they were to display depression. Finally, time-line had a significant correlation with depression.
6
symptoms. The dimensions ‘cause’ and ‘consequences’ were not significantly related to
depression.
Furthermore, Westbrook et al. (2016) investigated the relation between the separate
dimensions of illness perceptions and depressive symptoms in leukemia patients. Their
cross-sectional study showed a significant correlation between consequences and depressive
symptoms. Nevertheless, in contrast to Hagger and Orbell (2006), it was not found any
significant relation between identity nor control with depressive symptoms (Westbrook et al.,
2016). Llewellyn et al. (2007) provided a longitudinal study design regarding the impact of
dimensions of illness perceptions on depression in head and neck cancer patients. Patients were
assessed before treatment and finally 6-8 months after treatment. Interestingly, their main
finding was that timeline before treatment is a significant predictive factor for depression 6-8
months after treatment. Thus, patients who regarded their condition as long lasting were more
prone to develop depression.
Besides the impact of illness perceptions in cancer patients, there are multiple studies of
other illness populations such as noncardiac chest pain (NCCP) and systemic lupus
erythematosus (SLE) that show a significant relation between illness perceptions and depressive
symptoms (Israel, White, & Gervino, 2015; Nowicka-Sauer et al., 2018). In their cross-
sectional study, Israel et al. (2015) tested the relation of the dimensions of illness perceptions
with depression in NCCP patients. They used the IPQ-R to evaluate illness perceptions and the
DASS- depression scale for the assessment of depression. The main result was a weak but
significant relation between the dimension ‘consequences’ and depression. The other
dimensions of the IPQ-R were not related to depression. Additionally, in 2018, Nowicka-Sauer
et al. studied the relation between illness perceptions and depressive symptoms in patients with
SLE. In contrast to the other studies illness perceptions were regarded in total and not in separate
dimensions. It was found a strong relationship between threatening illness perceptions and
depressive symptoms.
Concludingly, the reported literature showed that there is a relationship between illness
perceptions and depressive symptoms in several diseases. However, the specific dimensions of
illness perceptions that were related to depressive symptoms differed from study to study. These
differences may be caused by different kinds of samples and diseases that were examined in the
studies. The purpose of the present study was to investigate the relation between illness
perceptions and depressive symptoms in a sample of stroke patients. Accordingly, 4 research
questions were posed to examine this relation:
7
2. How do depressive symptoms and illness perceptions develop over time?
3. Are illness perceptions a predictive factor for depressive symptoms in stroke patients at
every measurement point?
4. How is stroke severity related to illness perceptions and depressive symptoms at every
point of measurement?
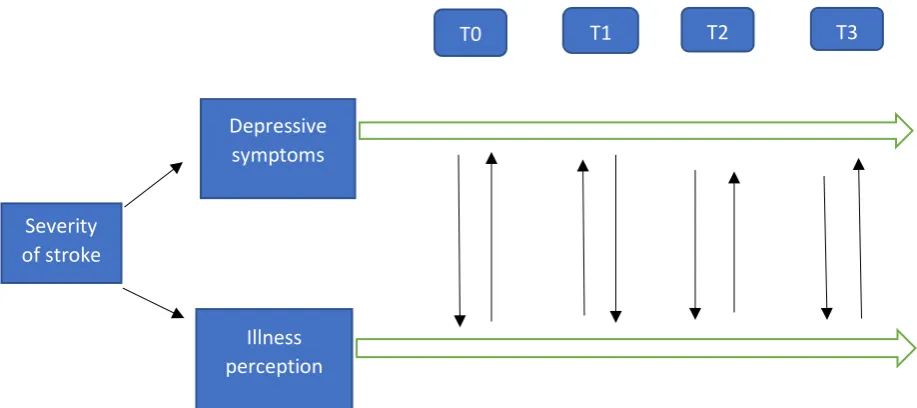
There were multiple possible outcomes regarding the relationship of the two constructs
illness perception and depressive symptoms, as it is represented in Figure 1. First, the severity
of the stroke may influence both depressive symptoms and illness perception and consequently
stroke severity may act as a confounding variable. The different times of measurement are
represented in Figure 1 as T0, T1 etc. The model does not only show a separate development
of both constructs over time but also it shows an interrelation between depressive symptoms
[image:7.595.81.540.463.667.2]and illness perception.
Figure 1. possible relationship between depressive symptoms and illness perception
Severity of stroke
Depressive symptoms
Illness perception
8
Methods
Design
For the present study, a prospective observational cohort study-design was employed.
In total, there were performed 4 measurements over time. The first measurement was done one
week after stroke, the following ones were executed 3, 6 and 12 months post stroke.
Participants
Initially, the purposive sample consisted of 51 stroke patients (34 male 17 female).
However, merely 27 (19 male, 8 female) patients completed the study till the end. The
participants of the study consisted of clinically diagnosed first ever ischemic stroke patients. In
Table 1 the age distribution of the patients is reviewed. Furthermore, participants were required
to display a significant stroke severity. Hence, only participants with a score of ≥ 2 on the
National Institutes of Health Stroke Scale (NIHSS) were included into the sample. In table 1
the distribution of the NIHSS score is displayed.
Table1. Descriptive statistics of age and NIHSS score (N=51)
Minimum Maximum Mean
Std. Deviation
NIHSS 0 10 3.37 2.70
Age 45 86 66.88 9.67
Patients were excluded from the study, if they were engaging in certain types of therapy
such as chemotherapy; they had severe speaking problems due to aphasia, cognitive disabilities,
or did not had sufficient skills in the Dutch language; were pregnant; had a history of diseases
such as multiple sclerosis or Cushing’s disease. The complete exclusion criteria are displayed
in Appendix A.
Materials
In order to investigate the severity of stroke in the patients, the 15-item scale NIHSS
was used (Williams, Yilmaz, & Lopez-Yunez, 2000). The scale ranges from 0 to 42, in which
higher values indicate higher stroke severity. Patients were assessed one-week post stroke and
9
questionnaire, blood test, a hormone screening protocol and a urine osmolality test.
Furthermore, the use of medication was considered. Additionally, the functional status of the
patients was assessed by means of the modified Rankin scale (mRS) ranging from 0 (no
symptoms) to 5 (severe symptoms) A score of 2 or more indicated an unfavorable functional
outcome.The questionnaires that were used for the assessment took 30-45 minutes and covered
the following constructs: Demographic features, Treatment for depression (drugs and/or
psychological treatment), Menstruation, Fatigue, Quality of sleep, Depression, Illness
perception and pain. The present study was part of a broader research setting. Hence, for the
present study there were only analysed the questionnaires for depression and illness perception.
Furthermore, the scores of the NIHSS were considered.
To measure depressive symptoms, the CES-D (Center for Epidemiologic Studies
Depression Scale) was used (Andresen, Malmgren, Carter, & Patrick, 1994). The CES-D
contains 20 items that measure the frequency of depressive symptoms. The items are short
statements and the patients had to indicate how often they behaved or felt in accordance to the
statement. Consequently, patients had to indicate on a scale from 0 to 3 how often they had the
respective feelings or thoughts, while 0 represents low frequency and 3 represents the highest
frequency of displaying the specific behaviour or feeling. The complete scale of the CES-D is
shown in Appendix C.
A summary score indicated the severity of depressive symptoms, in which higher values
implied more severe symptoms. The maximal score is 60 and a score of 16 or more indicates
significant depressive symptoms of the patients. Regarding the psychometric properties, the
CES-D has a satisfactory reliability with a Cronbach's alpha of .80-.90 (Beekman, Van
Limbeek, Deeg, Wouters, & Van Tilburg, 1994). Accordingly, in the present study it was
calculated a Cronbach’s alpha of .89.
Illness perceptions were assessed by means of the brief IPQ. The brief IPQ has
significant values for test-retest reliability, predictive validity and concurrent validity
(Broadbent et al., 2006). Moreover, a Cronbach’s alpha value of .74 was reported
(Nowicka-Sauer et al., 2018). Accordingly, a reliability analysis in the present study provided a
Cronbach’s alpha value of .70. The brief IPQ questionnaire contains 9 items, each measuring
one of the nine dimensions: consequences, timeline, personal control, treatment control,
identity, concern, coherence, emotional response and cause (Broadbent et al., 2006). The brief
IPQ questionnaire is displayed in Appendix B. Additionally, a total score of the brief-IPQ may
be calculated by recoding items 3,4,7 and finally adding the scores of each item. The final score
10
assessed on a scale from 0 to 10. However, in the current study, each of the items except cause
is scored on a Likert scale from 0 to 9 and consequently the maximal total score is 72. Even
though each item measures a different dimension, the total score indicates the psychological
threat patients are perceiving through their disease. Besides the 8 items that are measured on a
scale, the ninth item, which measures the perceived cause for the illness is nominal. Thus,
patients were asked to indicate factors that may have caused their disease. These potential
causes were grouped into categories by two researchers, which are represented in table 2.
Table2. Categories of the IPQ item ‘cause’
Code Subcategories
Disease Diabetes, Cardiovascular disease
Physical Impairments
Medication
Psychological factors Stress, fear, depression, fatigue
Age
Heredity
Lifestyle Smoking, alcohol, nutrition, weight, sport
No idea
Misfortune
Other
Data analysis
The gathered data were analyzed by means of SPSS. First, certain items of the CES-D
and brief IPQ had to be recoded in order to calculate a total score. Thereupon, in order to
investigate the reliability of both questionnaires, the Cronbach’s alpha value was calculated
through a reliability analysis. After there was calculated a total score for both questionnaires,
descriptive statistics were calculated for the total scores of depressive symptoms, illness
perceptions and stroke severity at the first measurement point(T0) to get an overview of the
data. Next, mean scores and standard deviations of the separate items of the IPQ were
calculated. Before any further analysis, depressive symptoms-, illness perceptions- and stroke
Kolomogorov-11
Smirnow test. It was found that the sum scores of both stroke severity and depressive symptoms
were not normally distributed at multiple time points. Therefore, for the following correlational
analyses, there was used bootstrapping. Consequently, a Pearson’s r correlation tested the
relation between depressive symptoms illness perceptions and stroke severity in the first
measurement with a sample of 51 participants. For the following calculations it was only used
a sample of 25 participants because this is the number of participants who finished the study
completely. Next, it was tested for a significant change in the mean scores of the separate
variables over time. Hence, the mean scores of depressive symptoms and illness perceptions
were calculated for the four measurement points. An ANOVA with repeated measures was
applied for the illness perception total score. In contrast, for both the depressive symptoms total
score and the separate items of the IPQ the non-parametric alternative of a Friedman test was
applied.
A Pearson’s r correlation was run to test the relation between depressive symptoms,
illness perceptions and stroke severity at all 4 measurement points. For any correlational
analysis, it was only used the total score of the brief IPQ, which was referred to as threatening
illness perceptions. The separate dimensions were not included in the correlation analysis, since
their reliability was not acceptable regarding the present sample size. A regression analysis was
not necessary because the NIHSS score was not related to depressive symptoms at any
measurement point. Consequently, stroke severity could be excluded as a confounding variable.
Results
Descriptives of the first measurement
The analysis was executed with a total sample of 51 participants. The properties of the
sample are reviewed in the participants section. In table 3 it can be concluded from the standard
deviations that there is a high variation in the sample regarding depressive symptoms, stroke
severity and illness-perceptions. Furthermore, the mean score for depressive symptoms is 12.6
and 17 participants (28%) have a score higher than 15, which indicates significant depressive
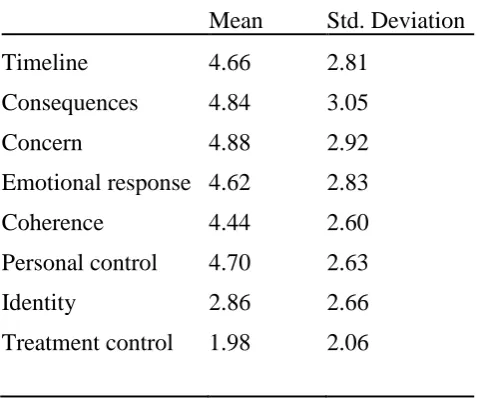
symptoms. Table 4 shows that except for treatment control and identity, participants score on
12
Table3. Descriptive statistics of depressive symptoms, stroke severity and illness perceptions in 51 participants after stroke at T0
Minimum Maximum Mean Std. Deviation
Depressive
symptoms1
0 37.00 12.60 9.99
Stroke severity2 0 10 3.37 2.70
Illness perception3 9.00 57.00 32.98 12.34
1 Depressive symptoms refer to the total score of the CES-D questionnaire
2 Stroke severity is derived from the total NIHSS score
[image:12.595.70.309.299.498.2]3 Illness perceptions refer to the total score of the brief IPQ
Table 4. Means and standard deviations of the separate IPQ items with N=51
Mean Std. Deviation
Timeline 4.66 2.81
Consequences 4.84 3.05
Concern 4.88 2.92
Emotional response 4.62 2.83
Coherence 4.44 2.60
Personal control 4.70 2.63
Identity 2.86 2.66
Treatment control 1.98 2.06
An executed Pearson’s r correlation does not show any significant relation between
depressive symptoms and illness perceptions at the first measurement (Table 5). However,
illness perceptions are moderately positively related to stroke severity (r=.38, p=.006).
Table5. Pearson correlation with bootstrapping between illness perceptions, depressive symptoms and stroke severity at T0 (N=51)
Depressive symptoms
Illness perceptions
Stroke severity
Illness perceptions r .27
95% CI Lower -.01
13
Stroke severity r .08 .38**
95% CI Lower -.28 .11
Upper .42 .60
**. Correlation is significant at the 0.01 level (2-tailed).
Development of the separate constructs over time
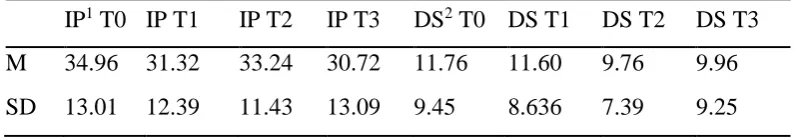
In table 6, sum scores of the CES-D questionnaire show the average development of
depressive symptoms over time. For this measurement it was only used the sample of
participants who finished the study to the end (n=25). Especially at the third(T2) and fourth(T3)
measurement it can be observed a slight decrease of the average score of depressive symptoms
in the sample. However, a Friedman test did not provide a significant result (X²=2.89, p=.409).
[image:13.595.68.469.574.644.2]Hence, a significant change of depressive symptoms over time can be excluded.
Table 6 also displays the development of the average sum score of the brief IPQ. The
main observation is that during the first measurement, patients perceive their illness as most
threatening with a mean of 34.96 (13.01). Nevertheless, based on the one-way ANOVA it
cannot be observed a significant change of illness perceptions over time (F=1.04, p=0.37).
Regarding the separate dimensions of the brief IPQ, a significant change over time in the item
treatment control was found (X²=17.6, p=.001). It was observed a significant increase of the
recoded item, which equals an increase of the unmodified item: (T0: M=2.68, SD=1.77, T1:
M=3.24, SD=1.74, T2: M=4.6, SD = 2.59, T3: M=4.5, SD=2.66).
Table6. mean scores and standard deviations of depressive symptoms and illness perceptions over the four time points (n=25)
IP1 T0 IP T1 IP T2 IP T3 DS2 T0 DS T1 DS T2 DS T3
M 34.96 31.32 33.24 30.72 11.76 11.60 9.76 9.96
SD 13.01 12.39 11.43 13.09 9.45 8.636 7.39 9.25
1 IP = Illness perceptions
2 DS = depressive symptoms
The development of the nominal item ‘cause’ is displayed in table 7. The factors:
14
development of patients’ stroke. However, it can be observed a decline in psychological factors
and lifestyle over time. In the first and second measurement psychological factors made up 31%
while in the third and fourth it declined to 20%. In contrast the perceived cause ‘physical impairments’ and ‘disease’ increased slightly over time (Table 7).
Table7. Frequencies (percentages fort the categories of the IPQ item ‘cause’)
Code T0 T1 T2 T3
Disease 16(23) 10(20) 10(23) 17(36)
Physical Impairments 3(4) 2(4) 4(10) 5(12)
Medication 1(2) 2(4) 0(0) 0(0)
Psychological factors 22(31) 16(31) 9(20) 10(20)
Age 1(2) 1(2) 2(4) 3(7)
Heredity 5(7) 1(2) 4(10) 3(7)
Lifestyle 14(19) 17(33) 6(13) 5(12)
No idea 2(3) 0(0) 3(7) 0(0)
Misfortune 5(7) 2(4) 4(10) 3(7)
Other 1(2) 0(0) 1(3) 1(3)
Correlation between the constructs over time
The correlations between illness perceptions, depressive symptoms and stroke severity
over the 4 time points was investigated by means of a Pearson’s r correlation. Table 8 shows
clearly that except for the first measurement(T0), there is a significant relation between illness
perceptions and depressive symptoms. Thus, the relations between the two questionnaires at
the second measurement (r=.52, p=.008), third measurement (r=.60, p=.002) and fourth
measurement (r=.55, p=.004) are significant and strong. Interestingly, there is not only a
relation between illness perceptions and depressive symptoms at the same measurement time,
but Table 7 shows clearly a correlation between the two factors across time. Hence, depressive
symptoms at T1 are moderately related to illness perceptions at T2 (r=.50, p=.012), illness
perceptions at T2 are strongly positively related to depressive symptoms at T3(r=.60, p=.006)
15
p=.048). Therefore, both illness perception predict depressive symptoms at certain time points
and the other way around. Stroke severity was not significantly related to depressive symptoms
at any time point and illness perceptions and stroke severity were only significantly related at
T0.
Table8. Pearson correlations with bootstrapping over time between depressive symptoms, illness-perceptions and severity of stroke (n=25).
**. **Correlation is significant at the 0.01 level (2-tailed). *. Correlation is significant at the 0.05 level (2-tailed).
1 DS = depressive symptoms
2 IP = Illness perceptions
3 NIHSS= stroke severity
DS T0 DS T1 DS T2 DS T3 IP T0 IP T1 IP T2 IP T3
DS1 T1 r .66**
95% CI Lower .16
Upper .90
DS T2 r .67** .73**
95% CI Lower .30 .32
Upper .87 .92
DS T3 r .56** .79** .71**
95% CI Lower .05 .40 .27
Upper .84 .93 .90
IP2 T0 r .19 .03 .28 -.02
95% CI Lower -.17 -.30 -.05 -.38
Upper .52 .30 .61 .34
IP T1 r .28 .52** .30 .33 .21
95% CI Lower -.15 .19 -.19 -.03 -.18
Upper .61 .73 .63 .61 .57
IP T2 r .27 .50* .60** .59** .40* .47*
95% CI Lower -.16 .12 .32 .35 .02 .02
Upper .66 .75 .77 .78 .71 .78
IP T3 r .17 .37 .40* .55** .36 .35 .82**
95% CI Lower -.25 -.04 .01 .26 -.06 -.05 .69
Upper .54 .65 .63 .75 .72 .70 .91
NIHSS3 r .04 .00 .22 -.16 .42* -.15 .32 .08
95% CI Lower -.33 -.33 -.10 -.43 .00 -.57 -.12 -.43
16
Discussion
Main results of the study
The present study was conducted to investigate relationships of illness perceptions and
depressive symptoms over time. Furthermore, the separate development of the two variables
over one year was evaluated. The present study was the first to consider the relation between
the respective constructs in stroke patients and therefore provides novel data in this regard. In
the first week after stroke 28% of the patients displayed significant depressive symptoms.
However, the results did not show any major changes in the development of depressive
symptoms over time. Since, there is no information about the treatment of depressive symptoms
it cannot be concluded whether the treatment was helpful or not. Similar results were found for
the development of illness perceptions. Hence, overall illness perceptions did not show
significant variations over the four measurement times. Only the recoded item treatment control
increased significantly at the third and fourth measurement, implying that patients perceive their
disease as less controllable by treatment over time.
Regarding the item ‘cause’ of the brief IPQ it could be observed a probable change in
multiple aspects. First, psychological factors as a perceived cause decreased after the second
measurement. This may be related to a better understanding of the disease because patients
were probably confronted with their disease through meetings with their doctor and
acquirement of knowledge about the disease. Interestingly, lifestyle as a perceived cause
decreased over time as well, even though lifestyle is actually one of the main risk factors for
stroke disease (Chiuve et al., 2008). In contrast, patients perceived over time that other diseases
like diabetes or cardiovascular problems are major causes for their stroke. As Prabhakaran and
Chong (2014) showed, these diseases are indeed risk factors for stroke and may indicate a better
understanding by participants about their disease over time.
Additionally, it was found a strong relationship between depressive symptoms and
illness perceptions at every measurement point except the first one. Therefore, patients who
perceive their illness as more threatening experience more depressive symptoms and vice versa.
Interestingly, at the first measurement, there was not found any correlation between the two
constructs. One possible explanation for this outcome may be that at the beginning of the
disease illness perceptions are not stable because patients first have to develop them over time.
Partly, the two constructs were related across time. Hence, depressive symptoms at T1 and T2
were related to illness perceptions at T2 and T3 respectively. Furthermore, measurements of
illness perceptions at T1 were strongly related to depressive symptoms at T2. Therefore,
17
the direction of the causality between the constructs is not clear. Hence, no conclusion can be
drawn about the prediction of depression by illness perceptions. Unexpectedly, it was not found
any significant relation between stroke severity with depressive symptoms nor with threatening
illness perceptions. One possible reason for this result may be the selective dropout. Namely,
patients with low stroke severity may have been more likely to cancel the study, which may
have biased the results.
Relating the results to former literature
Multiple studies have already investigated the relation between illness perceptions and
depressive symptoms in many diseases such as NCCP, SLE, cancer etc. (Israel et al., 2015;
Nowicka-Sauer et al., 2018, Llewellyn et al.).However, the current study was the first to test
this relatedness in stroke patients. Nevertheless, there were found many differences in the
relation between the variables compared to former studies, which used different samples.
As in the present study, Nowicka-Sauer et al. (2018) found in their cross-sectional study
a strong positive relation between threatening illness perceptions and depressive symptoms. In
the mentioned study it was also used the brief IPQ and for the assessment of depressive
symptoms it was used the Beck Depression Inventory. However, in the mentioned study it was
used a sample of SLE patients. Even though SLE is a chronic disease like stroke, there are
multiple physiological and psychological differences regarding the impact of the disease, which
impedes the comparison to the current study.
Israel et al. (2015) studied the relation between the separate dimensions of illness
perceptions and depressive symptoms in patients with NCCP. It was found a weak but
significant relation between the dimension ‘consequences’ and depressive symptoms. However,
Israel et al. (2015) only considered the separate dimensions of illness perceptions, while the
present study evaluated the total score of illness perceptions. Both Hagger et al. (2006) and
Westbrook et al. (2016) studied the relation between separate dimensions of illness perceptions
and depressive symptoms. the current study found a relation between depressive symptoms and
illness perceptions. While Hagger et al. found a significant relation between the dimensions
control identity and timeline with depressive symptoms, Westbrook et al. (2016) only found
that the dimension ‘consequences’ was significantly related to depressive symptoms. As in the
present study, Hagger et al. (2006) and Westbrook et al. (2016) found significant relations
between illness perceptions and depressive symptoms. However, comparison of the results is
limited because the mentioned studies used the separate dimensions of illness perceptions,
18
study, Hagger et al. (2006) considered cervical- and colorectal cancer patients and Westbrook
et al. studied a sample of Leukemia patients.
Like in the current study, Llewellyn et al. (2007) used a longitudinal design to test the
causal effects between depressive symptoms and illness perceptions. Nevertheless, in contrast
to the present study, they used a sample of head and neck cancer patients. It was found a
predicting effect of illness perceptions on depressive symptoms, more specifically they found
that the dimension identity significantly predicted depressive symptoms. In contrast, in the
present study the direction of causality between threatening illness perceptions and depressive
symptoms was not clear and should be further investigated in future research.
In contrast to the present study, Hackett and Anderson (2005) found in their systematic
review of population-, hospital-, and rehabilitation-based stroke studies that stroke severity is
significantly related to depression. The reason for the missing relation between stroke severity
and depressive symptoms is unclear. One possible explanation may be the selective dropout,
which is further discussed in the limitations section.
Strengths, limitations and future research
The present study was the first to investigate the longitudinal relation between
threatening illness perceptions and depressive symptoms in stroke patients. The study provided
multiple strengths, which should be highlighted. First, the selection criteria for participants were
very detailed and specific. Patients were assessed in multiple regards, such as stroke severity,
overall health etc. and only if they met the specific criteria, they were assigned to the study.
Furthermore, at every measurement point, patients had to go through a thorough assessment of
both physical and psychological examination. Thus, the physical and mental conditioned was
checked throughout the whole study. In addition, the CES-D and brief IPQ had to be filled out
by the patients at every measurement point, giving an adequate overview of the development
of depressive symptoms and illness perceptions over time. Additionally, through the
longitudinal design relations between depressive symptoms and illness perceptions could be
observed not only at one time point but at multiple time points as well as across time.
The main limitation of the current study was the high attrition rate. Merely 25 patients,
which is less than half of the total sample(N=51) completed the study completely.
Consequently, development of depressive symptoms and illness perception over time could
only be analyzed with 25 patients, which is a rather small sample. Moreover, causality between
the constructs could not be checked through sophisticated analysis due to the small sample size.
19
characteristics such as high depression, or negative perception of their illness may have been
more likely to stop the study than other participants. Moreover, patients with high stroke
severity may have died in the time period of the study, leading to another selective dropout.
Consequently, the generalizability of the results is limited.
Another limitation was the use of the brief IPQ. While, the brief IPQ is normally rated
on a scale from 0 to 10, in the present study it was used a scale from 0 to 9. This small difference
may have led to different psychometric properties of the questionnaire in terms of lower
reliability. Namely, in other literature it was reported a Cronbach’s alpha value of .74, while in
the present study it was calculated a value of .70 (Nowicka-Sauer et al., 2018). Furthermore,
the brief IPQ only contains one question per dimension. Consequently, illness perceptions could
only be regarded as a whole and not in separate dimensions because one question per dimension
does not provide sufficient reliability in case of the present sample size.
In the present study it was found a strong positive relation between illness perceptions
and depressive symptoms in stroke patients. Future research should focus on the type of
relationship in terms of causality between the two constructs with a larger sample size.
Furthermore, future studies should focus more on the separate dimensions of illness
perceptions. Thus, it should be used the extended version of the IPQ in order to see, which
dimensions of illness perceptions are related to depressive symptoms.
Conclusion
The present study investigated the relationship between illness perceptions, depressive
symptoms and stroke severity. Furthermore, the development of the separate constructs over
time was evaluated. First, in the sample nearly one third of the patients presented depressive
symptoms at the first measurement point. The development of the separate constructs illness
perceptions and depressive symptoms seemed to be stable over time. Namely, it was not found
a significant change of the mentioned constructs over the four measurement points.
Furthermore, it was found a strong positive relation between depressive symptoms and illness
perceptions at multiple measurement points. Moreover, there were found significant relations
across time between the two constructs. However, the direction of causality is not clear because
it could not be tested with complex analysis due to the small sample size. In contrast to former
research, it was not found any significant relation between stroke severity and depressive
symptoms at any measurement point. Future research should investigate the direction of
20 References
American Psychiatric Association. (2013). Diagnostic and statistical manual of mental disorders. Washington, USA: American Psychiatric Publishing.
Andresen, E. M., Malmgren, J. A., Carter, W. B., & Patrick, D. L. (1994). Screening for
Depression in Well Older Adults: Evaluation of a Short Form of the CES-D. American
Journal of Preventive Medicine, 10(2), 77–84. https://doi.org/10.1016/s0749-3797(18)30622-6
Beekman, A. T., Van Limbeek, J., Deeg, D. J., Wouters, L., & Van Tilburg, W. (1994). A
screening tool for depression in the elderly in the general population: the usefulness of
Center for Epidemiological Studies Depression Scale (CES-D). Tijdschr Gerontol Geriatr., 25(3), 95–103. Retrieved from
https://www.ncbi.nlm.nih.gov/pubmed/8036649
Broadbent, E., Petrie, K. J., Main, J., & Weinman, J. (2006). The Brief Illness Perception
Questionnaire. Journal of Psychosomatic Research, 60(6), 631–637. https://doi.org/10.1016/j.jpsychores.2005.10.020
Chiuve, S. E., Rexrode, K. M., Spiegelman, D., Logroscino, G., Manson, J. E., & Rimm, E.
B. (2008). Primary Prevention of Stroke by Healthy Lifestyle. Circulation, 118(9), 947–954. https://doi.org/10.1161/circulationaha.108.781062
Crane, C., & Martin, M. (2004). Social learning, affective state and passive coping in irritable
bowel syndrome and inflammatory bowel disease. General Hospital Psychiatry, 26(1), 50–58. https://doi.org/10.1016/j.genhosppsych.2003.07.005
Goodman, D., Morrissey, S., Graham, D., & Bossingham, D. (2005). The Application of
Cognitive—Behaviour Therapy in Altering Illness Representations of Systemic Lupus
Erythematosus. Behaviour Change, 22(03), 156–171. https://doi.org/10.1375/bech.2005.22.3.156
Hackett, M. L., Yapa, C., Parag, V., & Anderson, C. S. (2005). Frequency of Depression
After Stroke. Stroke, 36(6), 1330–1340.
https://doi.org/10.1161/01.str.0000165928.19135.35
Hackett, M. L., & Anderson, C. S. (2005). Predictors of Depression after Stroke. Stroke,
36(10), 2296–2301. https://doi.org/10.1161/01.str.0000183622.75135.a4
Hagger, M. S., & Orbell, S. (2006). Illness representations and emotion in people with
abnormal screening results. Psychology & Health, 21(2), 183–209. https://doi.org/10.1080/14768320500223339
21
regulation of health and illness: how can we use it to understand and respond to our
patients' needs? Rheumatology, 46(6), 904–906. https://doi.org/10.1093/rheumatology/kem060
Hankey, G. J. (2017). Stroke. The Lancet, 389(10069), 641–654. https://doi.org/10.1016/s0140-6736(16)30962-x
Heijmans, M. (1999). The role of patients’ illness representations in coping and functioning with Addison’ s disease. British Journal of Health Psychology, 4, 137–149. Retrieved from https://onlinelibrary.wiley.com/doi/epdf/10.1348/135910799168533
Israel, J. I., White, K. S., & Gervino, E. V. (2015). Illness Perceptions, Negative Emotions,
and Pain in Patients with Noncardiac Chest Pain. Journal of Clinical Psychology in Medical Settings, 22(1), 77–89. https://doi.org/10.1007/s10880-015-9419-6
King, R. B., Shade-Zeldow, Y., Carlson, C. E., Feldman, J. L., & Philip, M. (2002).
Adaptation to Stroke: A Longitudinal Study of Depressive Symptoms, Physical
Health, and Coping Process. Topics in Stroke Rehabilitation, 9(1), 46–66. https://doi.org/10.1310/kdta-welc-t2wr-x51w
Llewellyn, C. D., McGurk, M., & Weinman, J. (2007). Illness and treatment beliefs in head
and neck cancer: Is Leventhal's common sense model a useful framework for
determining changes in outcomes over time? Journal of Psychosomatic Research,
63(1), 17–26. https://doi.org/10.1016/j.jpsychores.2007.01.013
Mansfield, A., Inness, E. L., & Mcilroy, W. E. (2018). Stroke. Handbook of Clinical Neurology, , 205–228. https://doi.org/10.1016/b978-0-444-63916-5.00013-6
Murray, C. J. L., Vos, T., Lozano, R., Naghavi, M., Flaxman, A. D., Michaud, C., . . . Lopez,
A. D. (2012). Disability-adjusted life years (DALYs) for 291 diseases and injuries in
21 regions, 1990–2010: a systematic analysis for the Global Burden of Disease Study
2010. The Lancet, 380(9859), 2197–2223. https://doi.org/10.1016/s0140-6736(12)61689-4
Narushima, K., & Robinson, R. G. (2002). Stroke-related depression. Current Atherosclerosis Reports, 4(4), 296–303. https://doi.org/10.1007/s11883-002-0009-3
Nowicka-Sauer, K., Hajduk, A., Kujawska-Danecka, H., Banaszkiewicz, D., Smoleńska, Ż.,
Czuszyńska, Z., & Siebert, J. (2018). Illness perception is significantly determined by
depression and anxiety in systemic lupus erythematosus. Lupus, 27(3), 454–460. https://doi.org/10.1177/0961203317751858
22
CONTINUUM: Lifelong Learning in Neurology, 20, 296–308. https://doi.org/10.1212/01.con.0000446102.82420.64
Shi, Y., Yang, D., Zeng, Y., & Wu, W. (2017). Risk Factors for Post-stroke Depression: A
Meta-analysis. Frontiers in Aging Neuroscience, 9. https://doi.org/10.3389/fnagi.2017.00218
Srivastava, A., Taly, A., Gupta, A., & Murali, T. (2010). Post-stroke depression: Prevalence
and relationship with disability in chronic stroke survivors. Annals of Indian Academy of Neurology, 13(2), 123. https://doi.org/10.4103/0972-2327.64643
Verdelho, A., Henon, H., Lebert, F., Pasquier, F., & Leys, D. (2004). Depressive symptoms
after stroke and relationship with dementia: A three-year follow-up study. Neurology,
62(6), 905–911. https://doi.org/10.1212/01.wnl.0000115107.66957.8c
Westbrook, T. D., Maddocks, K., & Andersen, B. L. (2016). The relation of illness
perceptions to stress, depression, and fatigue in patients with chronic lymphocytic
leukaemia. Psychology & Health, 31(7), 891–902. https://doi.org/10.1080/08870446.2016.1158259
Williams, L. S., Yilmaz, E. Y., & Lopez-Yunez, A. M. (2000). Retrospective Assessment of
23 Appendix A. Exclusion criteria
Patients were excluded from the study if they were treated with chemotherapeutics; are
receiving (oral or intravenous) corticosteroid therapy for more than 1 month; are pregnant; are
not able to complete a questionnaire due to severe aphasia, non-Dutch speaking or severe
cognitive disturbances; have a history of: hypothalamic/pituitary disease that significantly
affects the study results, e.g. Cushing’s disease; cranial irradiation or another significant
intracranial lesion; multiple sclerosis; chronic fatigue syndrome; psychiatric condition that
interferes with interpretation of the study. (den Hertog & Martina 2019).
Appendix B. brief IPQ
How much does your illness affect your life?
0 1 2 3 4 5 6 7 8 9 10
no affect at all severely affects my life
How long do you think your illness will continue?
0 1 2 3 4 5 6 7 8 9 10
a very short time forever
How much control do you feel you have over your illness?
0 1 2 3 4 5 6 7 8 9 10
absolutely no control extreme amount of control
How much do you think your treatment can help your illness?
0 1 2 3 4 5 6 7 8 9 10
not at all extremely helpful
24
0 1 2 3 4 5 6 7 8 9 10
no symptoms at all many severe symptoms
How concerned are you about your illness?
0 1 2 3 4 5 6 7 8 9 10
not at all concerned extremely concerned
How well do you feel you understand your illness?
0 1 2 3 4 5 6 7 8 9 10
don't understand at all understand very clearly
How much does your illness affect you emotionally? (e.g. does it make you angry, scared,
upset or depressed?)
0 1 2 3 4 5 6 7 8 9 10
not at all affected emotionally extremely affected emotionally
Please list in rank-order the three most important factors that you believe caused your illness.
The most important causes for me:-
1. __________________________________
2. __________________________________
3. __________________________________
Appendix C. CES-D