http://wrap.warwick.ac.uk/
Original citation:
Dal Borgo, Mariela, Goodridge, Peter , Haskel , Jonathan and Pesole, Annarosa (2012) Productivity and growth in UK industries : an intangible investment approach. Working Paper. Coventry, UK: Department of Economics, University of Warwick. (CAGE Online Working Paper Series).
Permanent WRAP url:
http://wrap.warwick.ac.uk/57854
Copyright and reuse:
The Warwick Research Archive Portal (WRAP) makes this work of researchers of the University of Warwick available open access under the following conditions. Copyright © and all moral rights to the version of the paper presented here belong to the individual author(s) and/or other copyright owners. To the extent reasonable and practicable the material made available in WRAP has been checked for eligibility before being made available.
Copies of full items can be used for personal research or study, educational, or not-for-profit purposes without prior permission or charge. Provided that the authors, title and full bibliographic details are credited, a hyperlink and/or URL is given for the original metadata page and the content is not changed in any way.
A note on versions:
The version presented here is a working paper or pre-print that may be later published elsewhere. If a published version is known of, the above WRAP url will contain details on finding it.
WORKING PAPER SERIES
Centre for Competitive Advantage in the Global Economy
Department of Economics
May 2012 No.88
Productivity and Growth in UK Industries: An Intangible
Investment Approach
Productivity and Growth in UK Industries: An Intangible
Investment Approach*
Mariela Dal Borgo University of Warwick
Peter Goodridge
Imperial College Business School
Jonathan Haskel
Imperial College Business School; CEPR and IZA
Annarosa Pesole
Imperial College Business School
Keywords: innovation, productivity growth JEL reference: O47, E22, E01
April 2012
Abstract
This paper tries to calculate some facts for the “knowledge economy”. Building on the work of Corrado, Hulten and Sichel (CHS, 2005,9), using new data sets and a new micro survey, we (1) document UK intangible investment and (2) see how it contributes to economic growth. Regarding investment in knowledge/intangibles, we find (a) this is now greater than tangible investment at, in 2008, £141bn and £104bn respectively; (b) that R&D is about 11% of total intangible investment, software 15%, design 17%, and training and organizational capital 22%; (d) the most intangible-intensive industry is manufacturing (intangible investment is 20% of value added) and (e) treating intangible expenditure as investment raises market sector value added growth in the 1990s due to the ICT investment boom, but slightly reduces it in the 2000s. Regarding the contribution to growth, for 2000-08, (a) intangible capital deepening accounts for 23% of labour productivity growth, against computer hardware (12%) and TFP (40%); (b) adding intangibles to growth accounting lowers TFP growth by about 15% (c) capitalising R&D adds 0.03% to input growth and reduces lnTFP by 0.03% and (d) manufacturing accounts for just over 40% of intangible capital deepening plus TFP.
I. Introduction
What drives growth in increasingly knowledge-intensive economies? The sources of
growth are of course an enduring subject of interest for academics and policy-makers
alike, and since at least Solow (1956), have been studied in a growth accounting
framework. Whilst this gives the proximate sources, namely capital deepening, skills
and total factor productivity, and not the ultimate sources (e.g. legal framework) it is,
most are agreed, an important first step in marshaling data and uncovering stylized
facts that other frameworks might explain.
The productivity consequences of the ICT revolution have been studied in a
growth accounting framework by many authors in many countries (see e.g. Timmer et
al., 2010; Jorgenson et al., 2007). But hanging over this literature is an early
suggestion (Brynjolfsson and Hitt, 2000, for example), that investment in computer
hardware needed complementary investments in knowledge assets, such as software
and business processes, to reap productivity advantages. This re-awakened interest in
the application of the sources of growth framework to information and
knowledge-intensive economies. For free knowledge (e.g. from universities or the internet), the
framework is quite clear: if competitive assumptions hold, total factor productivity
growth (TFPG) measures the growth contribution of knowledge that is costless to
obtain and implement.
However, there are two points illustrated nicely by Tufano’s (1998)
description of a typical financial product innovation. He states it requires:
“an investment of $50,000 to $5 million, which includes (a)
payments for legal, accounting, regulatory, and tax advice, (b) time spent
systems for pricing and trading, and (d) capital and personnel commitments
to support market-making.”
First, in this example knowledge is not costless to obtain or commercialise and
so cannot be relegated to TFPG. Second, a long-established literature adds R&D to
the growth accounting framework. But some industries, e.g. finance and retailing, do
no (measured) R&D1. Thus one needs to consider knowledge investment besides
R&D: this example suggests training, marketing and organisational investments for
example. Thus our objective in this paper is to better measure growth and its sources
for the UK economy where:
(i) knowledge development and implementation is not costless, and
(ii) R&D is not the only knowledge investment.
To do this, this paper implements the framework set out in the widely-cited
papers by Corrado et al. (2005; henceforth, CHS), and first applied in a UK setting in
Giorgio Marrano et al. (2009). Whilst CHS builds upon the methods of capitalising
tangible assets, and intangible assets such as software which are now capitalised in
national accounts, it was the first paper to broaden the approach to a fuller range of
intangible or knowledge assets.2 Thus it fits with the range of innovation investments
mentioned above.
More specifically, we seek to do two things in this paper. First, we seek to
measure investment in intangible assets at an aggregate and industry level. We
believe it of interest for it tries to document knowledge investment in industries where
measured R&D is apparently very low, such as finance and retailing. Current data
1
The qualification measured is important. In the UK at least, the Business Enterprise R&D survey (BERD) defines R&D to respondents as ‘undertaken to resolve scientific and technological uncertainty’. Indeed, up until very recently, no firms in financial intermediation for example were even sent a form. See below for more discussion.
2
can document the physical, software and human capital deepening in these industries
(and also R&D, when capitalised in the National Accounts in 2014). However, this
paper tries to ask and answer whether we are missing significant investment in
knowledge or ideas in these sectors.3
Second, we use these data to perform a sources-of-growth analysis for the UK
using the CHS framework. Whilst one might have reservations about the assumptions
required for growth accounting (see below), we believe this is also of interest. The
main reason is that it enables us to investigate a number of questions that could either
not be addressed without these data, or all relegated to the residual. First, as CHS
stress, the capitalisation of knowledge changes the measures of both inputs and
outputs. Insofar as it changes outputs, it alters the labour productivity picture for an
economy. Thus we can ask: what was the productivity performance in the late 1990s
when the UK economy was investing very heavily (as we document below) in
intangible assets during the early stages of the internet boom?
Second, we can then ask: how was that performance accounted for by
contributions of labour, tangible capital, intangible capital and the residual? Here we
can describe how sources of growth will differ when R&D is capitalised and how
other knowledge contribute and alter TFP. Third, we also ask and try to answer this
question at industry level. So we can ask, for example, how much productivity in
non-R&D intensive sectors, such as retail and financial, was accounted for by other
intangibles or was it mostly TFPG?
3
In adapting and extending the framework that CHS used for the US, we
proceed as follows. First, we gather data on the intangible assets that CHS suggest,
but by industry. Fukao et al. (2009) and van Rooijen-Horsten et al., (2008) do this for
Japan and Holland, but they do not do growth accounting to derive the contributions
of the industries to the total. Second, we update some of the methods of CHS. For
example, much intangible spend, like R&D, is account. CHS had no
own-account estimates for design or for financial services. We apply the National
Accounts software method to estimate such own-account spending, using interviews
with design and financial companies to identify occupations and time use and thereby
derive intangible spend from wage data.4 In addition, there is almost no information
on the depreciation of intangible assets.5 Thus we conducted a survey of over 800
companies on the life lengths of their intangible spend, by asset, to gather data on
depreciation.
Third, we provide (gross output based) growth accounting results by industry
aggregated consistently into value-added based growth accounting for the UK market
sector, using the approach of Jorgenson et al. (2007). Thus we can examine the
contributions of different industries to overall growth. This then speaks to the
question of, for example, how much manufacturing versus financial services
contributed to overall TFP growth.
On specifically UK data, our work is closely related to the industry-level work
by Basu et al. (2004). They incorporated software as a productive asset and looked at
productivity and TFPG in 28 industries from 1990 to 2000. They did not have data
4
Official own-account software investment is estimated by (1) finding software writing occupations, (2) applying a multiple to their wage bills to account for overhead costs and (3) applying a fraction of time such occupations spend on writing long-lived software as opposed to short term bug fixes, maintenance etc. We duplicate this approach for finance and design.
5
however on other intangible assets and so whilst they were able to document software
and hardware spending across industries, they were not able to look at other
co-investments in innovation. However, Oliner et al. (2008) considered a proxy for
intangible investments applying the Basu et al. (2004) framework to US data. As will
be clear, our work builds on these studies and we rely heavily on their important work
on measuring software and also tangible assets, now embodied in official UK data
collection. Likewise, our work is also closely related to EUKLEMS (O’Mahony and
Timmer, 2009). Their dataset includes software, and we extend their framework with
additional intangibles, explicitly setting out the industry/market sector aggregation.
Whilst growth accounting is an internally consistent method for analysing
productivity growth there are of course limits to the analysis that caveat our work.
First, in the absence of independent measures of the return to capital we are compelled
to assume constant returns to scale and perfect competition to measure the output
elasticities of capital residually from the cost share of labour. A consistent framework
for growth and innovation accounting with these assumptions relaxed is outside the
scope of this current paper. But we hope that readers sceptical of the growth
accounting assumptions would still find of interest the findings on knowledge
investment and how their addition to the growth accounting framework changes the
usual findings (which turns out to be quite considerably). We also hope that readers
likewise sceptical of capitalising the full range of intangibles will find our work on
R&D, which is to be officially capitalised in 2014, of interest.
Second, like other work in this area, we are of course limited in what we can
do by data uncertainty. Measures of intangible assets are clearly difficult to obtain,
are as yet uncertain. Our industry data covers seven broad industries in the UK
market sector since finer detail on intangible spend is very hard to obtain.
We have two sets of findings (a) on knowledge spending and (b) implications
for growth. On knowledge spending, first, investment in long-lived knowledge, which
creates intangible assets, now exceeds tangible investment by £37bn. In 2008,
intangible and tangible investment was at around £141bn and £104bn respectively.
R&D is about 10% of such spend. Training, design and software are the largest
categories of intangible investment, and are particularly important in services. The
effect on market sector gross value added (MGVA) of treating intangible expenditure
as investment is to raise MGVA growth in the 1990s, but slightly reduce it in the
2000s. The latter finding is similar to that found in the US (Oliner et al., 2008 and
Corrado and Hulten, 2010). Second, around 60% of this spending is own account.
Thus measures of the “creative economy” (ONS, 2006) that assemble data for a list of
“creative industries” are missing significant creative activity outside those industries.
On the implications for growth, for 2000-08, the most recent period with data
available, intangible capital deepening accounts for 23% of labour productivity
growth, a larger contribution than computer hardware (12%), other tangible
investments (18%, buildings, vehicles, plant) or human capital (7%). The largest
contribution is TFP, at 40%. These findings are quite robust to variations in
depreciation and assumptions on intangible measures. Capitalised R&D accounts for
about 2% of LPG and lowers the contribution of TFP by 2 percentage points.
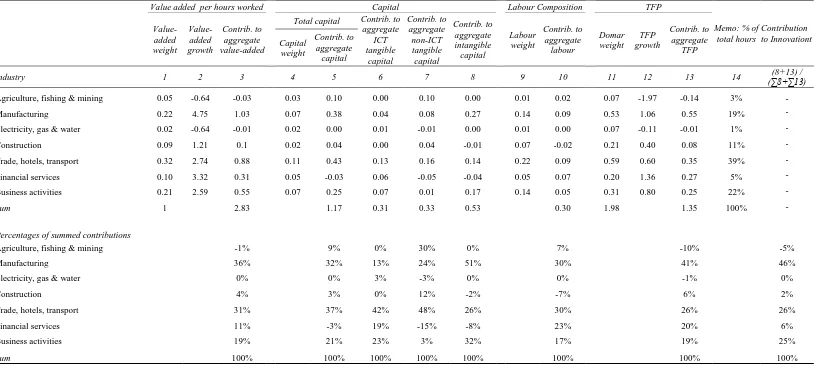
Regarding industries, the main finding here is the importance of
manufacturing, which contributes just over 40% of the total contribution to MGVA
also find important roles for retail/hotels/transport, (27% of the total contribution),
business services (22%) and finance (12%).
The rest of this paper proceeds as follows. Section II sets out a formal model,
and section III our data collection. Sections IV to VI our results and section VII
concludes.
II. A formal model and definitions
In this paper we undertake growth accounting for the UK market sector. But we are
also interested in how industries contribute to the overall market changes and to
analyse that we follow Jorgenson et al. (2007).6 The key point is that at industry
level, a value added production function exists under restrictive assumptions and it is
therefore preferable to work with TFP computed from gross output. But at the
aggregate level, productivity is best defined using value added (to avoid double
counting). So what is the relation between the industry components of growth and the
whole market sector?
We start with two definitions of TFPG. Supposing there is one capital, labour
and intermediate asset (respectively K, L and X) which produce output Yj in industry
j. That capital asset might or might not be intangible capital. Thus for each industry,
we have the following gross output defined ∆lnTFPj
, , ,
lnTFPj lnYj vK j lnKj vL j lnLj vX j lnXj
(1)
6
Where the terms in “v” are shares of factor costs in industry nominal gross
output, averaged over two periods. For the economy as a whole, the definition of
economy wide ∆lnTFP based on value added is
lnTFP lnV vK lnK vL lnL
(2)
Where the “v” terms here, that are not subscripted by “j”, are shares of K and
L payments in economy wide nominal value added. Now we write down two
definitions. First, define the relation between industry gross output and industry value
added as
, ,
lnYj vV j lnVj vX j lnXj
(3)
which says that (changes in real) industry gross are weighted averages of
changes in real value added and intermediates. Second, write changes in aggregate
real value added as a weighted sum of changes in industry real value added as
follows.
, , , , 1
ln j ln j, j V j j ( V j j) , j 0.5( j t j t )
j j
V w V w P V P V w w w
(4)We may then write down value added growth in the industry as a weighted
average of K, L and (gross output-based) ΔlnTFPj
, ,
, , ,
1
ln j K j ln j L j ln j ln j
V j V j V j
v v
V K L TFP
v v v
where the weights on K and L are a combination of the shares of K and L in
industry gross output and the shares of industry gross output in aggregate value added.
We are now in position to write down our desired relationship, that is the
relation between economy-wide real value added growth and its industry
contributions
, ,
, , ,
ln j K j ln j j L j ln j j ln j
j V j j V j j V j
v v w
V w K w L TFP
v v v
(6)Which says that the contributions of Kj and Lj to whole-economy value added
growth depend upon the share of Vj in total V (wj) the share of K and L in gross and
value added. The contribution of ΔlnTFPj depends on the share of Vj in total V (wj)
and the share of industry value added in gross output. The weight on TFP is
approximately (P YY j, j/P VV ) which is the usual interpretation of the Domar (1961)
weight. It sums to more than one, since an improvement in industry TFP contributes
directly to the average of all TFPs and indirectly if it produces output that is then an
intermediate in other industries.7
Finally, in reality we do not have one capital and labour unit, but many. These
are then aggregated across different types. For labour, see below, we use, education,
age (experience), and gender; for capital, different types of both tangible assets and
intangible assets. Denoting the capital and labour types k and l we have following
7
industry and aggregate variables for each type where industry is defined as industry j
and the aggregate variables are unsubscripted:
, , , , , ,
1
ln ln ,
ln ln ,
/ ( ), / , , ,
0.5( )
k k
k
l l l
k K k k K k k l l l l L l l j k j j l j
k l j j
t t t
K w K capital type k
L w L labour type l
w P K P K w P L P L K K k L L l
w w w
(7)In our results we document the following. First, we set out the gross output
growth accounting results for each industry, (1). Second, we take these data and set
out the contributions for each industry to the growth of aggregate value added, (4).
Third, we sum up the contributions across industries to the decomposition of
aggregate (market sector) value-added, (6). In each case we carry out the
decomposition with and without intangibles.
Before proceeding to the data, some further theory remarks on the
measurement of capital. As pointed out by e.g. Jorgenson and Griliches (1967) the
conceptually correct measure of capital in this productivity context is the flow of
capital services. This raises a number of measurement problems set out, for example,
in the OECD productivity manual (2001). We estimate the now standard measure as
follows. First, we build a real capital stock via the perpetual inventory method
whereby for any capital asset k, the stock of that assets evolves according to
, , (1 , ) , 1
k t k t k t k t
Where I is investment over the relevant period and the geometric rate of
depreciation. Real tangible investment comes from nominal tangible investment
deflated by an investment price index. Second, that investment price is converted into
a rental price using the Hall-Jorgenson relation, where we assume an economy-wide
rate of return such that the capital rental price times the capital stock equals the total
economy-wide operating surplus.8
III. Data
Time period and data sources
For the industry analysis, ONS does not publish real intermediate input data and so we
used the EUKLEMS November 2009 release, which gives data up to 2007. For
intangibles, our industry level data is available 1992-2007 since this is when
Input-Output (IO) tables are consistently available from. Data for the whole market sector
is available going back to 1980 up to 2008 (the most recent year National Accounts
are available). Thus we work with two data sets: (1) market sector, 1980-2008,
consistent with National Accounts 2008, and (2) industry level 1992-2007 (the data
turn out to be very close over the overlapping years). Appendix Table A.1 documents
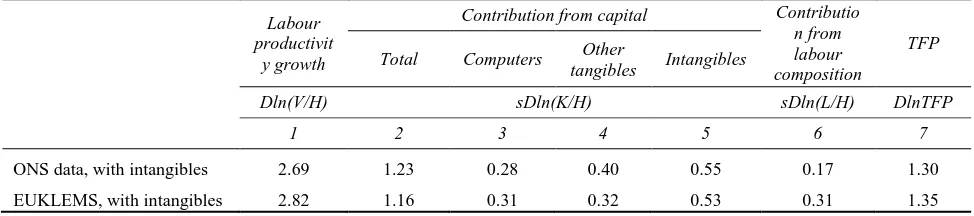
our data sources in detail with a comparison between our sources and the ONS.
Appendix Table A.2 compares the growth-accounting results when using KLEMS and
ONS data respectively.
8
Industries
The EUKLEMS data includes measures of output, and various categories of
employment and capital at the industry level for 71 industries, classified according to
the European NACE revision 1 classification. We then aggregate these data to the
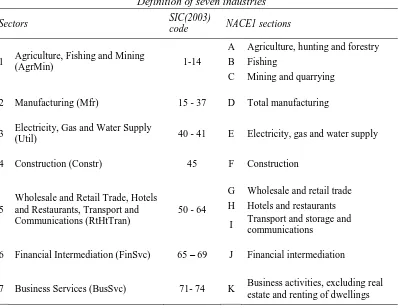
seven industries described in TABLE 1. The choice of the seven industries is dictated
by the availability of the intangible data: training and management consulting data are
[image:15.595.96.494.298.606.2]only available at these aggregated levels.
TABLE 1
Definition of seven industries
Sectors SIC(2003)
code NACE1 sections
1 Agriculture, Fishing and Mining
(AgrMin) 1-14
A Agriculture, hunting and forestry B Fishing
C Mining and quarrying
2 Manufacturing (Mfr) 15 - 37 D Total manufacturing
3 Electricity, Gas and Water Supply
(Util) 40 - 41 E Electricity, gas and water supply
4 Construction (Constr) 45 F Construction
5
Wholesale and Retail Trade, Hotels and Restaurants, Transport and Communications (RtHtTran)
50 - 64
G Wholesale and retail trade H Hotels and restaurants
I Transport and storage and communications
6 Financial Intermediation (FinSvc) 65 – 69 J Financial intermediation
7 Business Services (BusSvc) 71- 74 K Business activities, excluding real estate and renting of dwellings
We measure output for the market sector, defined here as industries A to K,
excluding actual and imputed housing rents. Note this differs from the ONS official
market sector definition, which includes part of sections O and P, as well as the
heterogeneous mix of personal and recreational services9, including hard-to-measure
areas like museums and refuse collection, we omitted them. We also used
disaggregated real value added data for this industry definition.
For the years where industry level data is available, the data are bottom-up,
that is, derived at the industry level and aggregated subsequently. Aggregation of
nominal variables is by simple addition. Aggregates of real variables are a
share-weighted superlative index for changes, benchmarked in levels to 2005 nominal data.
For other years, the intangible data are for the market sector and the other output and
input data from ONS, latest National Accounts, aggregated from industry values.
Outputs and tangible inputs
EUKLEMS also provides growth accounting data, but since we have expanded the
amount of capital and changed value added we do our own growth accounting. In
addition, the EUKLEMS labour composition data is slightly different to the ONS data
(ONS have access to more data). From the output and intermediate accounts of the
EU KLEMS dataset we have used the series of industry Gross Output and Gross
Value Added at current basic prices, intermediate inputs at current purchasers’ prices
and their corresponding price and volume indices. Intermediate inputs comprise
energy, materials and services.
The tangible capital variables from EUKLEMS that we used are nominal and
real gross fixed capital formation, the corresponding price index, real fixed capital
stock and capital compensation, all disaggregated by type of assets. Capital
compensation equals the sum of the gross operating surplus, which includes the
9
remainder of mixed income, plus taxes on production, after subtracting labour
compensation of the self-employed. In practice, it is derived as value added minus
labour compensation. We shall of course amend capital compensation to incorporate
compensation for intangible capital assets.
The EUKLEMS capital data distinguishes nine asset types, of which we use
transport equipment, computing and communications equipment and other machinery
and equipment, and total non-residential investment. We use ONS estimates for
software. We excluded residential structures (they are not capital for firm
productivity analysis).
Depreciation rates for ICT tangible capital are as in the EUKLEMS, which in
turn follows Jorgenson et al. (2005). Depreciation is assumed to be geometric at rates
for vehicles, buildings, plant and computer equipment of 0.25, 0.025, 0.13, and 0.40
respectively. As for intangible assets, they are assumed to be the same for all
industries. We discuss depreciation in the context of intangible assets in more detail
below, but the asset-specific depreciation rates for intangibles are as follows: 33% for
software, 60% for advertising and market research, 40% for training and
organisational investments, 20% for R&D (broadly defined, thus including Design,
Mineral Exploration, Financial Innovation, Artistic Originals and non-scientific
R&D). Given that the EU KLEMS database does not provide data on capital tax rates
by country, industry and year, and that Timmer et al. (2010) point out that evidence
for major European countries shows that their inclusion has only a very minor effect
on growth rates of capital services and TFP, we did not introduce a tax adjustment.
The capitalisation of intangibles requires various adjustments to the output and
input data. The exact treatment depends on whether the asset capitalised was
part of gross output. So a bank that sells financial services using own-account
software is also treated as a software producer. Data on intermediate consumption are
unaffected. In the case of purchased assets, these are currently recorded within
intermediate consumption. The capitalisation process removes these intermediate
purchases and allocates them to investment or Gross Fixed Capital Formation (GFCF)
in the National Accounts nomenclature. Thus intermediate consumption is reduced,
GFCF is increased, gross output is unaffected and value-added is increased. The
above changes of course refer to levels. Impacts on growth rates will depend on the
relative growth rates of intangible outputs and other final output and their weights in
value-added.
Labour services
The labour services data are for 1992-2007 and are our own estimates based on
EUKLEMS person-hours by industry. We use these along with Labour Force Survey
microdata to estimate composition-adjusted person hours, where the adjustment uses
wage bill shares for composition groups for age, education and gender. Person hours
are annual person-hours, with persons including the employed, self-employed and
those with two jobs. For the longer period based on market sector aggregates, we use
an equivalent method, using LFS microdata to generate wages and average hours
worked at the individual level and then gross up using population weights.
Labour and capital shares
The Compensation of Employees (COE) data are consistent with the labour services
data. Mixed income is allocated to labour according to the ratio of labour payments to
MGVA excluding mixed income. With intangibles capitalised, MGVA changes, and
(GOS) is always computed as MGVA less COE so that GOS +COE =MGVA by
construction.
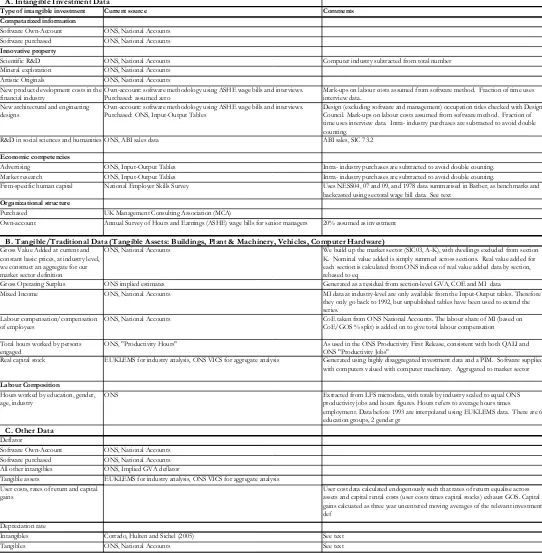
Details of measurement of intangible assets
CHS (2006) distinguish three classes of intangible assets:
i) computerised information: software and databases
ii) innovative property: (scientific & non-scientific) R&D, design
(including architectural and engineering design), product development
in the financial industry, exploration of minerals and production of
artistic originals.
iii) economic competencies: firm investment in reputation, human and
organisational capital.
Our intangible data update industry-level data reported in Gill and Haskel
(2008). Own account investment is allocated to the industry wherein the investment
is carried out. Purchased is allocated to industries via the input output tables.
Particular industry categories (e.g. product development in finance, exploration of
minerals, copyright) are allocated to that industry.10
Computerised information
Computerised information comprises computer software, both purchased and
own-account, and computerized databases. Software is already capitalised and thus we use
these data, by industry, as described by Chesson and Chamberlin (2006). Purchased
software data are based on company investment surveys and own-account based on
10
the wage bill of employees in computer software occupations, adjusted downwards
for the fraction of time spent on creating new software (as opposed to, say, routine
maintenance) and then upwards for associated overhead costs (a method we use for
design below). Software is already included in the EUKLEMS, but for consistency,
we subtract it out of all variables and build our own stock and implied service flow
using the ONS data.
Innovative property
For business Scientific R&D we use expenditure data by industry derived from the
Business Enterprise R&D survey (BERD). To avoid double counting of R&D and
software investment, we subtract R&D spending in “computer and related activities”
(SIC 72) from R&D spending since this is already included in the software investment
data.11 We note that BERD is collected according to Frascati Manual definitions and
to be incorporated into National Accounts requires some adjustments (for example,
Frascati data on tangible capital investment by R&D producers needs to be converted
into capital rental payments. In practice these types of adjustments turn out to be
rather small (Corrado, Goodridge and Haskel, 2011).
Like computerised information, mineral exploration, and production of
artistic originals (copyright for short) are already capitalised in National Accounts
and the data here are simply data for Gross Fixed Capital Formation (GFCF) from the
ONS. The production of artistic originals covers, “original films, sound recordings,
manuscripts, tapes etc., on which musical and drama performances, TV and radio
programmes, and literary and artistic output are recorded.” Based on work currently in
11
progress for the IPO (Goodridge and Haskel, 2011) we suspect that these investment
numbers are understated and so should be regarded as a lower bound on the true
numbers. Expenses on mineral exploration are valued at cost (ONS National
Accounts, 2008) and explicitly not included in R&D.
The measurement methodology for New product development costs in the
financial industry follows that of own account software above (and therefore replaces
the CHS assumption of 20% of intermediate consumption by the financial services
industry). This new method reduces this category substantially. Further details are in
Haskel and Pesole (2011) but a brief outline is as follows. First, we interviewed a
number of financial firms to try to identify the job titles of workers who were
responsible for product development. Second, we compared these titles with the
available occupational and wage data from the Annual Survey on Hours and Earnings
(ASHE). The occupational classification most aligned with the job titles was
‘economists, statisticians and researchers’. Third, we asked our interviewees (1) how
much time was spent by these occupations on developing new products that would
last more than a year (some firms based their estimates on staff time sheets), and (2)
about associated overhead costs. Armed with these estimates, we went to the
occupational data in the ASHE and derived a time series of earnings for those
particular occupations in financial intermediation. Own-account investment in
product development is therefore the wage bill, times a mark-up for other costs
(capital, overheads etc.), times the fraction of time those occupations spend on
building long-term projects. All this comes to around 0.52% of gross output in 2005
(note that reported R&D in BERD is 0.01% of gross output).
For new architectural and engineering design we again updated the CHS
we used the software method for own-account, and purchased data, by industry, are
taken from the supply-use tables (see details in Galindo-Rueda et al., 2010). The
choice of occupations and the time allocation are, as in financial services, taken from
interviews with a number of design firms. Interestingly, almost all of the design firms
we interviewed have time sheets for their employees which break out their time into
administration, design and client interaction/pitching for new business (almost all
firms target, for example, that junior designers spend little time on administration and
senior more time on pitching). Finally, R&D in social sciences and humanities is
estimated as twice the sales of SIC73.2 “Social sciences and humanities”, where the
doubling is assumed to capture own-account spending. This is a small number.
Economic competencies
Advertising expenditure is estimated from the IO Tables by summing intermediate
consumption on Advertising (product group 113) for each industry. Firm-specific
human capital, that is training provided by firms, was estimated as follows. Whilst
there are a number of surveys (such as the Labour Force Survey) who ask binary
questions (such as whether the worker received training around the Census date), to
the best of our knowledge there is only one survey on company training spending,
namely the National Employer Skills Survey (NESS) which we have available for
2004, 2006, 2007.12 We also have summary data for 1988 (from an unpublished
paper kindly supplied by John Barber). The key feature of the survey, like the US
Survey of Employer-provided Training (SEPT) used in CHS, is that it asks for direct
employer spending on training (e.g. in house training centres, services purchased from
12
outside providers, etc.) and indirect costs via the opportunity cost of the employee’s
time whilst spend training and therefore not in current production.13 This opportunity
costs turns out to be about equal to the former.
One question is whether all such surveyed training creates a lasting asset or is
some of it short-lived. We lack detailed knowledge on this, but have subtracted
spending on Health and Safety training, around 10% of total spend. Whilst this
subtraction lowers the level of training spending, it turns out to affect the contribution
of training to growth at only the 4th decimal place. A second question is the extent to
which such training financed by the firm might be incident on the worker, in the sense
of reducing worker pay relative to what it might have been without training,
unobserved by the data gatherer. O’Mahony and Peng (2010) use the fraction of time
that training is reported to be outside working hours, arguing that such a fraction is
borne by the worker. Our data is all for training in working hours.
It might be argued that including both firm-specific human capital and labour
composition is double counting. For example, labour composition includes age: if the
increased wages of more experienced workers is partly due to the additional training
they have received, there may be some double-counting of the contribution of that
training. Recall however that firm-specific human capital data are training costs paid
for by the firm. Following Becker (1962), firms will pay only for training specific to
the firm: training that will yield no market wage increase. If this holds there is no
double counting: general skills are captured in market-wide wages and so in labour
composition, and firm-specific skills in firm-provided training costs.
13
Finally, our data on investment in organisational structure relies on purchased
management consulting, on which we have consulted the Management Consultancy
Association (MCA), and own-account time-spend, the value of the latter being 20% of
managerial wages, where managers are defined via occupational definitions. We test
the robustness of the 20% figure below.
Prices and depreciation
Rates of depreciation and the prices of intangible assets are less well established. The
R&D literature appears to have settled on a depreciation rate of around 20%, and
OECD recommends 33% for software. Solovechik (2010) has a range of 5% to 30%
for artistic originals, depending on the particular asset in question. To shed light on
this and the depreciation of other assets, in our intangible assets survey we asked for
life lengths for various intangibles (Awano et al., 2009). The responses were close to
the assumed depreciation rates in CHS., depending on the assumptions one makes
about declining balance depreciation. Once again, we shall explore the robustness of
our results to depreciation, but note in passing that our assets are assumed to
depreciate very fast and so are not very sensitive to depreciation rates, unless one
assumes much slower rates, in which case intangibles are even more important than
suggested here.
The asset price deflators for software are the official deflators (own-account
and purchased), but otherwise the GDP deflator is used for intangible assets. This is
an area where almost nothing is known, aside from some very exploratory work by
the BEA and Corrado et al. (2011). These papers attempt to derive price deflators for
knowledge from the price behaviour of knowledge intensive industries and the
productivity of knowledge producing industries. Two observations suggest that using
impact of knowledge on the economy. First, many knowledge-intensive prices have
been falling relative to GDP. Second, the advent of the internet and computers would
seem to be a potential large rise in the capability of innovators to innovate, which
would again suggest a lowering of the price of knowledge due to strong growth in
productivity in the process of innovation itself, in contrast to the rise in prices implied
by the GDP deflator. Thus our use of the GDP deflator almost certainly understates
the importance of intangible assets.
Relation of intangible approach to other approaches
Haskel et al. (2009, 2011) discusses how this work relates to the definition of
innovation and the Frascati and Oslo manuals. It is clearly consistent with the work
on IT and economic growth (see, for example, Jorgenson et al., 2007), the
capitalisation of software and the forthcoming capitalisation of R&D in national
accounts, both of which are part of the process of recognizing spending on intangibles
as building a (knowledge) capital stock. van Ark and Hulten (2007) point out that
with an expanded view of capital, following the CHS argument, innovation “…would
appear in several forms in the sources of growth framework: through the explicit
breakout of IT capital formation, through the addition of intangible capital to both the
input and output sides of the source of growth equation, through the inclusion of
human capital formation in the form of changes in labor ‘quality’, and through the
‘multifactor productivity’ (MFP) residual. For shorthand, we refer to ‘innovation’
contribution as the sum of the intangible contribution and TFP (and sometimes labour
Accuracy of intangible measures
The following points are worth making. First, data on minerals, copyright, software
and R&D are taken from official sources. As mentioned above, preliminary work
suggests an undercounting of copyright spending. Second, data on workplace training
are taken from successive waves of an official government survey, weighted using
ONS sampling weights. Once again one might worry that such data are subject to
biases and the like but this does look like the best source currently available.
Third, data on design, finance and investment in organisational capital are
calculated using the software method for own-account spending, but the IO tables for
purchases. The use of the IO tables at least ensures the purchased data are consistent
with official National Accounts. The use of the own account software method means
that we have to identify the occupations who undertake knowledge investment, the
time fraction they spend on it and additional overhead costs in doing so. For design
and financial services we have followed the software method by undertaking
interviews with firms to try to obtain data on these measures. Such interviews are of
course just a start but our estimates are based then on these data points. For
own-account organisational change we use an assumed fraction of time spent (20%) by
managers on organisational development. This remains a subject for future work:
below we test for robustness to this assumption.
To examine all further, we undertook two further studies. First, we used
survey data kindly supplied by Stephen Roper and described in detail in Barnett
(2009). These data ask around 1,500 firms about their spending on software,
branding, R&D, design and organisational capital. The firms are sampled from
spending on the intangible assets with those proportions in our manufacturing and
business services gives similar answers.
Second, we undertook a new survey of firms, the results of which are fully
documented in Awano et al. (2010). In terms of the spending numbers here, that
micro study found spending on R&D, software, marketing and training to be in line
with the macro-based numbers in this report. However, the implied spending on
design and organisational capital were very much lower in the survey. This again
suggests that these investment data require further work.
IV. Results
Intangible spending: market sector over time
FIGURE 1 presents market sector nominal total tangible and intangible investment
data. In the late 1990s intangible investment has exceeded tangible. Note that,
intangible investment falls less and recovers more quickly during recessions.
However, depreciation rates for intangible assets are significantly faster than those for
tangibles. Thus a relatively small slowdown in intangible investment turns out to
generate the same fall in capital stock as a steep fall in tangible spend, so the changes
in resulting capital services are similar.
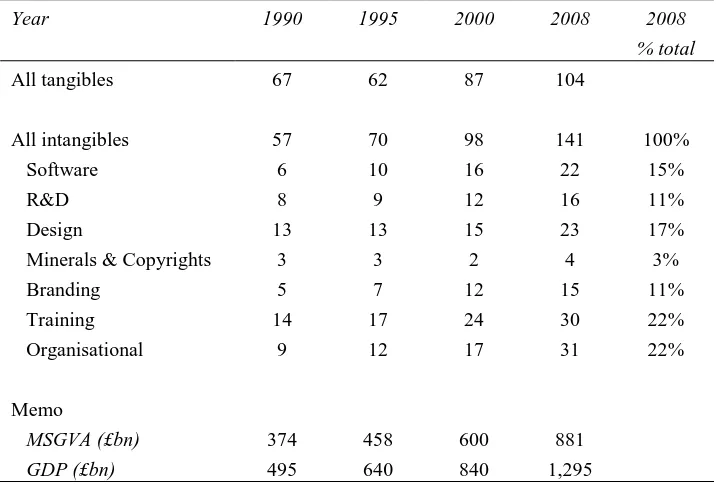
TABLE 2 shows investment by intangible asset for 1990, 1995, 2000 and
2008 with tangible investment for comparison. The intangible category with the
highest investment figures is training, growing to approximately a third of tangible
investment by 2008. For information we also report GDP and MGVA excluding
Figure 1: Market sector tangible and intangible investment, £bn, 1990-2008
Source: ONS data for tangibles, this paper for intangibles. All data in current prices.
TABLE 2
Tangible and intangible investment, by asset, £bns
Year 1990 1995 2000 2008 2008
% total
All tangibles 67 62 87 104
All intangibles 57 70 98 141 100% Software 6 10 16 22 15% R&D 8 9 12 16 11% Design 13 13 15 23 17% Minerals & Copyrights 3 3 2 4 3% Branding 5 7 12 15 11% Training 14 17 24 30 22% Organisational 9 12 17 31 22%
Memo
MSGVA (£bn) 374 458 600 881
GDP (£bn) 495 640 840 1,295
Notes: Data are investment figures, in £bns, current prices. R&D refers to both scientific and non-scientific R&D, and financial product development. ‘Design’ refers to architectural & engineering design. MSGVA is market sector gross value added without intangibles, that is, sector A to K, excluding real estate and software and mineral investment. GDP is UK GDP from KLEMS.
Source: ONS data for tangibles, this paper for intangibles.
50 60 70 80 90 100 110 120 130 140 150
1990 1991 1992 1993 1994 1995 1996 1997 1998 1999 2000 2001 2002 2003 2004 2005 2006 2007 2008
[image:28.595.119.477.437.679.2]Industry intangible investment
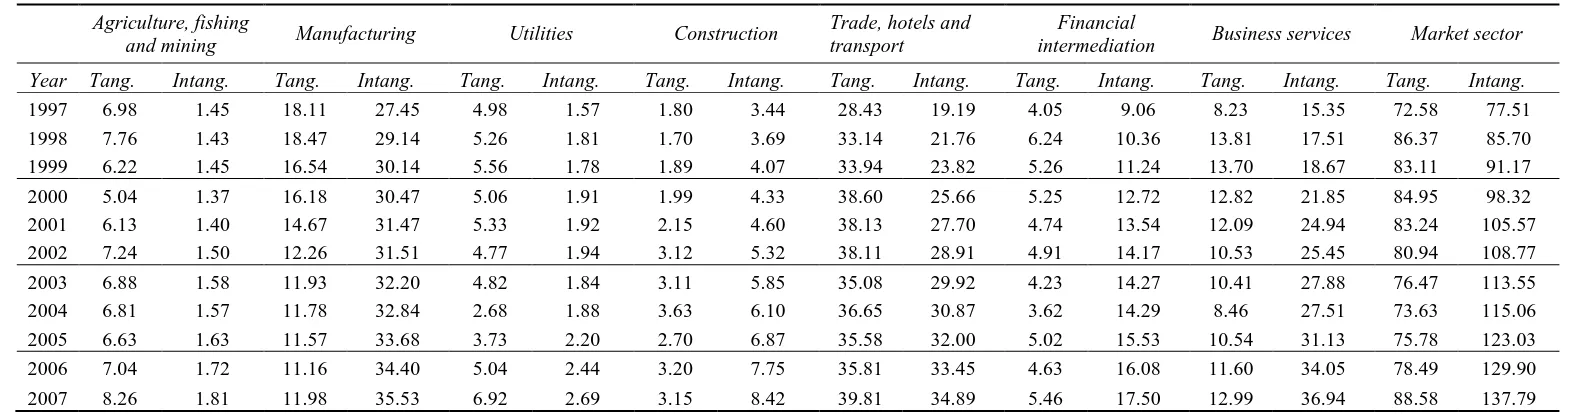
TABLE 3 reports tangible and intangible investment by industry, 1997-2005. Finance
and manufacturing invest very strongly in intangibles relative to tangibles: in both
sectors, intangible investment is three times that in tangibles. It is interesting to note
in passing that this raises important questions on how to classify manufacturing since
it is undertaking a very good deal of intangible activity (manufacturing own-account
intangible investment is 15% of value added by 2007 for example).
If we express the data in TABLE 3 as a proportion of industry value-added
(adjusted for intangibles) we find that financial services is the most intangible
intensive, at (averaged 1997-2007) 20% of industry value-added, followed by
manufacturing at 19% and business services at 17%. Construction, utilities and
distribution are all between 9 and 12% with agriculture and mining at 5%. In
financial services intangible investment made up an even higher share of value-added
in the late 1990s, due to the software boom, especially in the run up to Y2K.
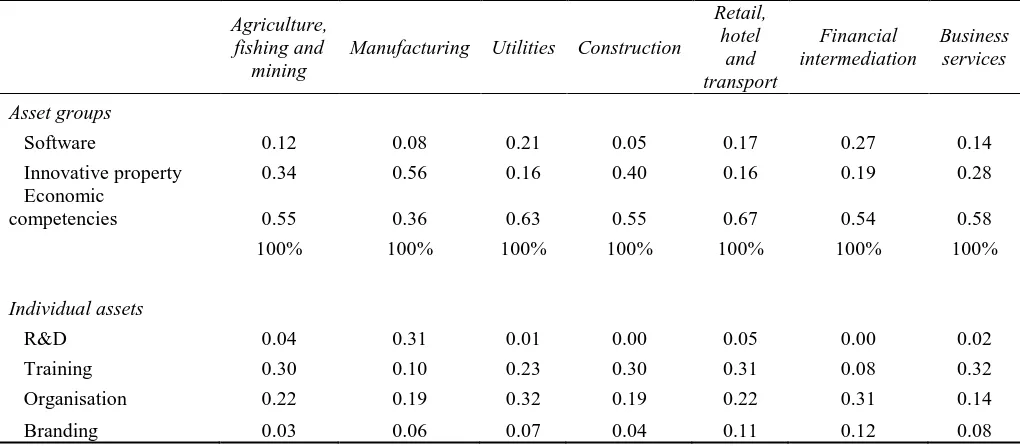
Which particular intangible assets are most important in which industries?
TABLE 4 shows the asset share of total intangible spending by industry (in 2007 the
shares are very stable over time). Starting with manufacturing, the largest share of all
intangible spending is innovative property (56%), with software being an 8%.
Compare with financial intermediation, where innovative property accounts for only
19% whereas ’economic competencies’ (training, branding and organization building)
accounts for over 50%, whilst software is 27%. Similarly, in retailing, software and
TABLE 3
Tangible and intangible investment by industry, 1997-2007, current prices £bns
Agriculture, fishing
and mining Manufacturing Utilities Construction
Trade, hotels and transport
Financial
intermediation Business services Market sector
Year Tang. Intang. Tang. Intang. Tang. Intang. Tang. Intang. Tang. Intang. Tang. Intang. Tang. Intang. Tang. Intang.
1997 6.98 1.45 18.11 27.45 4.98 1.57 1.80 3.44 28.43 19.19 4.05 9.06 8.23 15.35 72.58 77.51 1998 7.76 1.43 18.47 29.14 5.26 1.81 1.70 3.69 33.14 21.76 6.24 10.36 13.81 17.51 86.37 85.70 1999 6.22 1.45 16.54 30.14 5.56 1.78 1.89 4.07 33.94 23.82 5.26 11.24 13.70 18.67 83.11 91.17 2000 5.04 1.37 16.18 30.47 5.06 1.91 1.99 4.33 38.60 25.66 5.25 12.72 12.82 21.85 84.95 98.32 2001 6.13 1.40 14.67 31.47 5.33 1.92 2.15 4.60 38.13 27.70 4.74 13.54 12.09 24.94 83.24 105.57 2002 7.24 1.50 12.26 31.51 4.77 1.94 3.12 5.32 38.11 28.91 4.91 14.17 10.53 25.45 80.94 108.77 2003 6.88 1.58 11.93 32.20 4.82 1.84 3.11 5.85 35.08 29.92 4.23 14.27 10.41 27.88 76.47 113.55 2004 6.81 1.57 11.78 32.84 2.68 1.88 3.63 6.10 36.65 30.87 3.62 14.29 8.46 27.51 73.63 115.06 2005 6.63 1.63 11.57 33.68 3.73 2.20 2.70 6.87 35.58 32.00 5.02 15.53 10.54 31.13 75.78 123.03 2006 7.04 1.72 11.16 34.40 5.04 2.44 3.20 7.75 35.81 33.45 4.63 16.08 11.60 34.05 78.49 129.90 2007 8.26 1.81 11.98 35.53 6.92 2.69 3.15 8.42 39.81 34.89 5.46 17.50 12.99 36.94 88.58 137.79
TABLE 4
Shares of total industry intangible investment by intangible asset categories, 2007
Agriculture, fishing and
mining
Manufacturing Utilities Construction
Retail, hotel
and transport
Financial intermediation
Business services
Asset groups
Software 0.12 0.08 0.21 0.05 0.17 0.27 0.14 Innovative property 0.34 0.56 0.16 0.40 0.16 0.19 0.28 Economic
competencies 0.55 0.36 0.63 0.55 0.67 0.54 0.58 100% 100% 100% 100% 100% 100% 100%
Individual assets
R&D 0.04 0.31 0.01 0.00 0.05 0.00 0.02 Training 0.30 0.10 0.23 0.30 0.31 0.08 0.32 Organisation 0.22 0.19 0.32 0.19 0.22 0.31 0.14 Branding 0.03 0.06 0.07 0.04 0.11 0.12 0.08
Notes: Innovative property is R&D, mineral exploration and copyright creation, design, financial product development and social science research. Economic competencies are advertising & market research, training and organisational investment. All data are shares of total investment: upper panel sums to 100% since categories are exhaustive, lower panel shows a sample of individual assets that are part of the asset groups in the upper panel.
To shed light on the importance of non-R&D spend outside manufacturing, the
lower panel sets out some detail on selected individual measures. As the top line
shows, R&D accounts, in manufacturing, for 31% of all intangible spend, but 0% in
finance, and 5% in trade. Training, in line 2, accounts for 10% in manufacturing,
31% in trade and 8% in finance. Investment in organisational capital, line 3, is 19%
in manufacturing, 22% in trade and a considerable 31% in finance. Finally, branding
is twice as important in trade and finance as in manufacturing. Thus we can conclude
that the ‘non-R&D’ intangible spending, outside manufacturing, is mostly due to
V. Growth accounting results: market sector
Growth accounting results for the market economy
Our growth accounting results are set out in TABLE 5. Consider first the top panel of
data, which reports the contributions to growth in a standard framework that doesn’t
include intangibles. Labour productivity growth (LPG; column 1) rose in the 1990s
and then fell back somewhat in the 2000s. The rise in the late 1990s is due to the
introduction of a new methodology for Financial Services Indirectly Measured
(FISIM), and other methodological changes in the 2008 National Accounts (see
Giorgio Marrano et al., 2009).14 The contribution of labour quality, column 2, is
fairly steady throughout. Tangible capital input, in columns 3 and 4, grew quickly in
the 1990s, but fell in the 2000s, especially computer hardware. Thus the overall TFP
record was a rise in the second half of the 1990s and then a fall (column 6).
Consider now the second set of results in panel 1. The inclusion of intangibles
raises output growth in the 1990s, with little effect in the 2000s, due to a decline in
intangible investment growth in the 2000s following the boom in intangible
investment in the preceding years. The impact of labour quality, column 2, falls due
to the fall in the labour share. The contribution of tangible capital, columns 3 and 4,
falls somewhat relative to the upper panel as the inclusion of intangibles alters the
factor shares of these inputs. In column 5 we see the contribution of the intangible
inputs; stronger in the 1990s and weaker – though still important – in the 2000s. Thus
14
the overall TFPG record in column 6 is acceleration in the late 1990s and then some
[image:33.595.30.569.219.597.2]weakening.
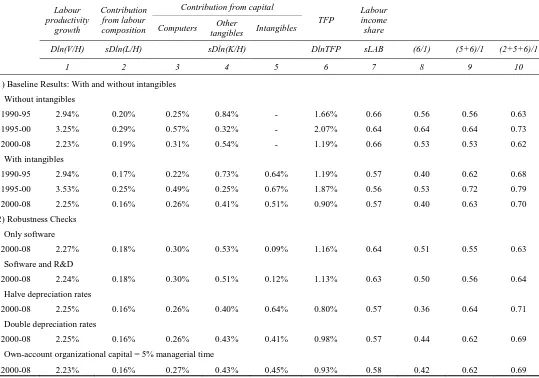
TABLE 5
Value-added growth accounting for market sector with and without intangibles, and robustness checks Labour productivity growth Contribution from labour composition
Contribution from capital
TFP
Labour income share
Computers Other
tangibles Intangibles
Dln(V/H) sDln(L/H) sDln(K/H) DlnTFP sLAB (6/1) (5+6)/1 (2+5+6)/1
1 2 3 4 5 6 7 8 9 10
1) Baseline Results: With and without intangibles Without intangibles
1990-95 2.94% 0.20% 0.25% 0.84% - 1.66% 0.66 0.56 0.56 0.63
1995-00 3.25% 0.29% 0.57% 0.32% - 2.07% 0.64 0.64 0.64 0.73
2000-08 2.23% 0.19% 0.31% 0.54% - 1.19% 0.66 0.53 0.53 0.62
With intangibles
1990-95 2.94% 0.17% 0.22% 0.73% 0.64% 1.19% 0.57 0.40 0.62 0.68
1995-00 3.53% 0.25% 0.49% 0.25% 0.67% 1.87% 0.56 0.53 0.72 0.79
2000-08 2.25% 0.16% 0.26% 0.41% 0.51% 0.90% 0.57 0.40 0.63 0.70
2) Robustness Checks
Only software
2000-08 2.27% 0.18% 0.30% 0.53% 0.09% 1.16% 0.64 0.51 0.55 0.63
Software and R&D
2000-08 2.24% 0.18% 0.30% 0.51% 0.12% 1.13% 0.63 0.50 0.56 0.64
Halve depreciation rates
2000-08 2.25% 0.16% 0.26% 0.40% 0.64% 0.80% 0.57 0.36 0.64 0.71
Double depreciation rates
2000-08 2.25% 0.16% 0.26% 0.43% 0.41% 0.98% 0.57 0.44 0.62 0.69
Own-account organizational capital = 5% managerial time
2000-08 2.23% 0.16% 0.27% 0.43% 0.45% 0.93% 0.58 0.42 0.62 0.69
The final columns set out the shares of LPG of various components. What are
the main findings? First, the inclusion of intangibles lowers TFPG as a share of LPG.
Consider column 8 in the upper panel. TFPG is above 50% of LPG without
intangibles, but around 10 percentage points less with intangibles. Second, the
contribution of the “knowledge economy” to LPG is very significant, whether
measured as column 9 or 10. In column 9, TFPG and intangible capital deepening are
between 62% and 72% of LPG, with the fraction particularly large in 1995-00.
Column 10 adds the contribution of labour quality taking the figure to around 70%.
Note how high this contribution is in the late 1990s when intangible capital deepening
was very fast.
We note that the decision on whether or not labour composition ought to be
incorporated is subjective and so we leave it to the reader to decide on their preferred
measure. It could be argued that if changes in labour composition reflect changes in
the gender or age composition of the workforce, the series does not fully reflect the
acquisition of knowledge. It turns out however that in practice the bulk of the quality
adjustment process is primarily driven by qualifications, with age (experience) and
gender playing much smaller roles.
Growth accounting: further details and robustness checks
As we have seen, we necessarily make a number of assumptions when implementing
the growth accounting exercise. How robust are our findings to key assumptions?
This is shown in the rest of the table, where for easy of reading we just show the
The first row in Panel 2, TABLE 5, shows the results when only software is
included as an intangible. Thus this row corresponds closely to current National
Accounts practice, although copyrights and mineral exploration are also capitalised in
official data. As can be seen, relative to the very top panel, which excludes software,
capitalization of software raises Δln(V/H) and lowers, very slightly, ΔlnTFP. Note
from column 5 that the contribution of software is 0.09%pa, against the total
intangible contribution of 0.51%pa.
The next row capitalises both software and R&D and thus a comparison with
the software line estimates the difference due to R&D capitalization (to be
implemented in the UK by 2014).15 Relative to software, the contribution of
intangibles rises very slightly and ΔlnTFP falls very slightly. So capitalization of
R&D adds about 0.03%pa to input contribution and TFP falls by the same.
The next two rows halve and double the assumed intangible depreciation rates.
This raises and lowers the contribution of intangible capital respectively, as would be
expected. They more or less directly affect ΔlnTFP, so that, if for example,
intangibles depreciated half as fast as we have assumed, ΔlnTFP falls from 0.90%pa
to 0.80%pa.
Finally, since own account organizational capital is particularly uncertain, the
final row reduces such spending by 75% (that is, managers are assumed to spend 5%
of their time on organizational capital). In this case contribution of intangible capital
falls from 0.51%pa to 0.45% pa and ΔlnTFP rises from 0.90%pa to 0.93%pa.
15
One way of looking at the robustness of these results is to calculate the
fraction of overall Δln(V/H) accounted for by intangibles, ΔlnTFP and Δln(L/H) under
the various different scenarios. It is in fact quite robust. As row 3, top panel shows,
without intangibles, the ΔlnTFP fraction is 0.53 or and (ΔlnTFP+Δln(L/H)) 0.62, a
result that is very similar with just software or just software and R&D. With
intangibles, the fractions are 0.40 for ΔlnTFP, 0.63 for ΔlnTFP+Δln(K/H)(intan) and
0.70 for ΔlnTFP+Δln(K/H)(intan)+Δln(L/H). But the interesting thing to note is that
these fractions are almost identical with the experiments on depreciation and
organizational capital. Thus the inclusion of the full range of intangibles lowers the
share of the contribution of ΔlnTFP, but consistently raises the share of the
contribution of ΔlnTFP, intangible capital deepening and labour composition
combined, such that the latter has accounted for 70% of Δln(V/H) over this century.
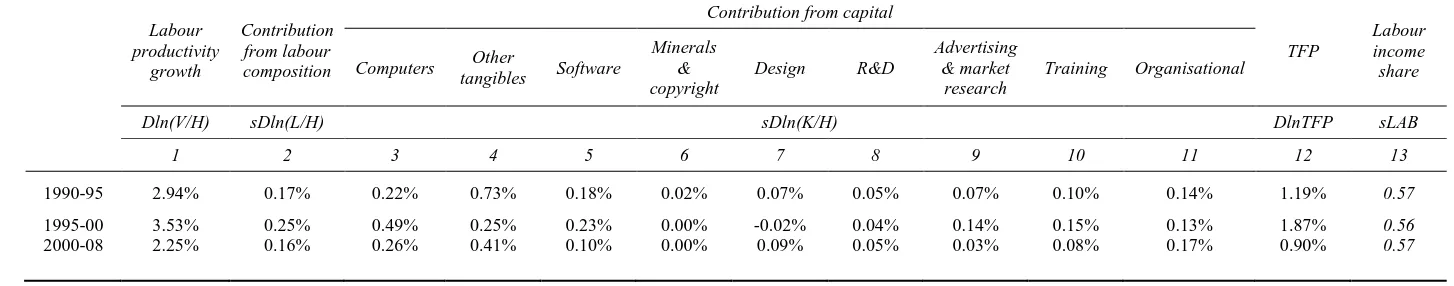
Contributions of individual intangible assets
Appendix B, TABLE B.1., sets out the contributions of individual assets. Between
1990-2008, software is the largest contributor (0.16% p.a.), with organisational capital
0.15%p.a.. R&D contributes 0.05% p.a.. In the late 1990s the contribution of
software (0.23% p.a.) came close to that of non-computer tangibles (0.25% p.a.), a
remarkable result highlighting the importance of knowledge assets in that period.
VI. Growth accounting results: industry-level
Our industry growth accounting is feasible between 2000-7.16 Thus we start with
comparing our aggregated market sector results with those using ONS data to check
16
the two are closely comparable. Then we look more closely industry by industry. See
Appendix A, TABLE A.2., for a comparison with ONS data.
Results by industry
To build up the industry contributions to these overall figures we start with the
industry-by-industry results in TABLE 6. These are on a gross output basis: we show
[image:37.595.27.575.307.500.2]how they relate to the whole economy value-added level below.
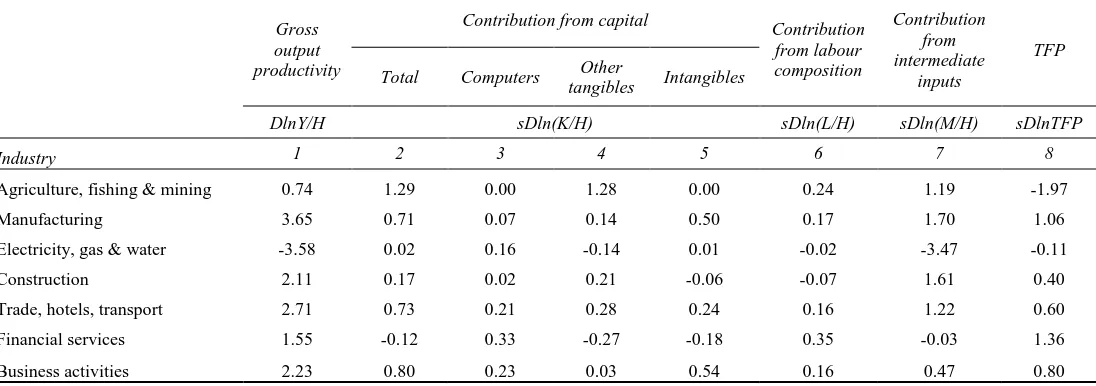
TABLE 6
Industry level gross output growth accounting, 2000-2007, including intangibles
Gross output productivity
Contribution from capital
Contribution from labour composition Contribution from intermediate inputs TFP
Total Computers Other
tangibles Intangibles
DlnY/H sDln(K/H) sDln(L/H) sDln(M/H) sDlnTFP
Industry 1 2 3 4 5 6 7 8
Agriculture, fishing & mining 0.74 1.29 0.00 1.28 0.00 0.24 1.19 -1.97
Manufacturing 3.65 0.71 0.07 0.14 0.50 0.17 1.70 1.06
Electricity, gas & water -3.58 0.02 0.16 -0.14 0.01 -0.02 -3.47 -0.11
Construction 2.11 0.17 0.02 0.21 -0.06 -0.07 1.61 0.40
Trade, hotels, transport 2.71 0.73 0.21 0.28 0.24 0.16 1.22 0.60
Financial services 1.55 -0.12 0.33 -0.27 -0.18 0.35 -0.03 1.36
Business activities 2.23 0.80 0.23 0.03 0.54 0.16 0.47 0.80
Notes: All figures are average annual percentages. The contribution of an output or input is the growth rate weighted by the corresponding average share. Columns are annual average change in natural logs of: gross output per person hour (column 1), contribution of total capital (column 2, which is the sum of the next three columns), contribution of computer capital (column 3), contribution of other non-computer tangible capital (column 4), contribution of intangibles (column 5), contribution of labour quality per person hour (column 6), contribution of intermediate inputs (column 7), TFP (column 8, being column 3 less the sum of column 4, 8 and 9). Note also that Health & Safety training are excluded from the investment figures used for the above calculation.
Source: Authors’ calculations.
We just report the results including all intangibles. Column 1 shows ΔlnY/H,
growth in gross output per employee-hour. It is negative in Electricity, Gas, Water,
otherwise positive particularly in manufacturing and Trade. Column 2 shows total
capital deepening per employee-hour, being strongly positive in manufacturing and