MASTER THESIS
Concentration and Esterification of
Lactic Acid in Complex Coacervates
Mónica Pazos Urrea
Faculty of Science & Technology Nanobiophysics group (NBP)
Sustainable Process Technology group (SPT)
EXAMINATION COMMITTEE Prof. Dr. M.M.A.E. Claessens Prof. Dr. Ir. B. Schuur Dr. Ir. S. Lindhound Dr. Ir. J. A. Wood J.J. Van Lente, MSc
August 27, 2019
Mónica Pazos Urrea
Concentration and Esterification of Lactic Acid in Complex Coacervates Master thesis, August 27, 2019
MSc of Chemical Engineering
Supervisors: Prof. Dr. M.M.A.E. Claessens, Prof. Dr. Ir. B. Schuur, Dr. Ir. S. Lindhound, Dr. Ir. J. A. Wood, J.J. Van Lente, MSc
University of Twente
Nanobiophysics group (NBP)
Sustainable Process Technology group (SPT) Faculty of Science & Technology P.O. Box 217
ii
Abstract
Efficient recovery of lactic acid from the fermentation broth is an area of interest for the industrial production of this organic acid and further applications including the production of biodegradable polymers and green solvents. The viability of complex coacervates to concentrate the acid and further convert it into a valuable compound is evaluated. In the first step, the concentration of lactic acid, butanol, lipases and the ester butyl lactate in complex coacervates is studied. The effect of various parameters such as complex composition, total polyelectrolyte concentration, ionic strength, and temperature on the distribution of the molecules between the dilute phase and complex coacervate phase were discussed. The components presented distribution coefficients greater than one, indicating that the molecules are being incorporated in the complex coacervates. The factor with the greatest influence on the enzymes and lactic acid incorporation was the ionic strength while for butanol distribution the temperature presented the more substantial effect.
iii
Acknowledgments
I am using this opportunity to express my gratitude to everyone who supported me throughout the course of this Master thesis:
My supervisors, Saskia and Boelo, your expertise, guidance, and enthusiastic encouragement kept me on track. I’ve learned a lot under your supervision, looking for alternatives to face the challenges during the research. It was a pleasure to work with you.
Jéré, my daily supervisor, for your valuable guidance and support. You provided me with tools and insight knowledge to develop my experiments. You took the time to give me great feedback on every step of the way.
Prof. Mireille Claessens and Dr. Jeffery Wood for being members of my evaluation committee, giving constructive comments to improve the outcomes of my research.
From the SPT group, special thanks to Thomas Brouwer for your ingenious advice and support through the development of my project. Without your participation and input, the analysis of my samples could not have been successfully conducted. And I would also like to extend my gratitude to Surika, Dion, and Rick, for your help to carry out the analysis.
From the NBP group, I am particularly grateful for the assistance given by Kirsten, Irene, and Yvonne. Your support in the lab make everything more effortless; you saved me more than once during my electrophoresis experiments and with the arrangements on the setups needed for my research.
To all the NBP group members, your company made this journey more enjoyable. Thank you for the warm welcoming, and the long discussions about a particular topic. Such a unique group from people from diverse academic backgrounds, it was a delight to be part of this research group.
iv
Contents
Abstract ... ii
Acknowledgments... ii
Contents ... iv
List of figures ... vi
Abbreviations ... viii
Chapter 1. Introduction ... 1
1.1. Outlook of the Thesis ... 2
Chapter 2. Background ... 4
2.1. Lactic acid ... 4
2.2. Downstream process of Lactic acid ... 5
2.3. Enzymatic polymerization of lactic acid ... 8
2.4. Complex coacervates ...10
2.5. Complex coacervates applications ...11
Chapter 3. Experimental procedure ... 13
3.1. Materials ...13
3.1.1. Defining complex composition ...13
3.2. Methods ...14
3.2.1. Complex coacervates - Partitioning experiments ...14
3.2.2. Esterification reaction in an organic solvent ...16
3.2.3. Esterification reaction in the complex coacervate phase...16
3.2.4. Detection of the components ...17
Chapter 4. Partitioning of molecules inside complex coacervates ... 20
4.1. Partitioning of proteins in complex coacervates ...20
4.1.1. Protein incorporation as function of F- ...21
4.1.2. Water content of PEI/PAA complex coacervates ...23
4.1.3. Protein incorporation as function of salt concentration ...24
4.1.4. Protein incorporation as function of total polyelectrolytes concentration ...25
4.1.5. Overview – Proteins partitioning ...25
4.2. Partitioning of lactic acid in complex coacervates ...27
4.2.1. Overview – Lactic acid partitioning ...31
v
4.3.1. Overview – Butanol partitioning ...33
4.4. Partitioning of Butyl lactate in complex coacervates ...34
Chapter 5. Esterification reaction – Production of butyl lactate ... 35
5.1. Lipase Activity ...35
5.2. Esterification reaction in the presence of complex coacervates ...37
5.2.1. Esterification reaction at small scale ...37
5.2.2. Esterification reaction at longer reaction time ...39
5.2.3. Esterification reaction including an organic phase ...41
5.2.4. Overview – Esterification reaction ...42
Chapter 6. Conclusions ... 44
6.1. Recommendations for upcoming research ...44
References ... 46
Appendix A - Calibration Curves ...52
Appendix A.1. Calibration curve lactic acid concentration – Ion chromatography ...52
Appendix A.2. Calibration curve 1-Butanol Concentration – Gas Chromatography ...53
Appendix A.3. Calibration curve Butyl lactate Concetration – Gas Chromatography ...54
Appendix A.4. Protein analysis on polyacrylamide gel (SDS-page gel) ...55
Appendix B - Additional results ...56
Appendix B.1. Peptide sequence of PPL and CALA ...56
Appendix B.2. Formation of complex coacervate as function of complex composition [F-] ...57
Appendix B.3. Protein partitioning as a function of the order of addition for the complex formation and mixing time ...58
Appendix B.4. Influence of PEI/PAA complexes on absorbance spectra ...59
Appendix B.5. SDS-polyacrylamide gel electrophoresis (12%) at different complex compositions ...60
Appendix B.6. Partitioning of butyl lactate in complex coacervates. ...61
Appendix B.7. Partitioning of proteins – Supplementary results ...62
Appendix B.8. Partitioning of Lactic acid – Supplementary results ...63
vi
List of figures
Figure 1.1. Proposed method to produce PLA from extracted LA ... 2
Figure 2.1. Lactic acid structure ... 4
Figure 2.2. Overview of the chemical synthesis of LA ... 4
Figure 2.3. Layout of the conventional process for lactic acid recovery by precipitation19 ... 5
Figure 2.4. Acid-base equilibrium of lactic acid at a concentration of 0,1 M. Concentration of lactate ion [A-]. The concentration of lactic acid [LA] (adapted from21) ... 6
Figure 2.5. PLA formed by polycondensation of LA33 ... 8
Figure 2.6. Charge of polyelectrolytes as function of the pH 45... 10
Figure 2.7. Right – Schematic representation of complex coacervate formation in aqueous solutions. Left – Complex coacervate formation by mixing two oppositely charged polyelectrolytes (polyacrylic acid and polyethyleneimine) ... 11
Figure 3.1. Schematic representations of poly(ethylenimine) (PEI) and poly(acrylic acid) (PAA)59 ... 14
Figure 3.2. Method 1 - Concentration of lactic acid, butanol and butyl lactate in complex coacervates 14 Figure 3.3. Method 2 – Incorporation of lipases inside complex coacervates. ... 15
Figure 3.4. Experimental setup for the esterification reaction in the presence of an organic solvent at 50°C and 500rpm. ... 16
Figure 3.5. Schematic representation of the esterification reaction inside the complex coacervate ... 17
Figure 3.6. Absorption spectrum of PPL, CALB and CALA. ... 18
Figure 4.1. 12% SDS-page gel for PPL ( 1. Ladder, 2. 0,25 g/L, 3. 0,5 g/L, 4. 1 g/L , 5. 2g/L), CALB (1. Ladder, 2. 1 g/L, 3. 2 g/L) and CALA (1. Ladder, 2. 1 g/L, 3. 2 g/L) ... 20
Figure 4.2. Complex coacervates with the incorporated enzymes at 0,26 F- complex composition. ... 21
Figure 4.3. Lipases distribution coefficient [KD] as function of the polyelectrolyte composition F-. PPL (left) initial concentration 0,083 mM. CALB (middle) Initial concentration 0,052 mM. CALA (right) Initial concentration 0,035 mM. The error bars show the standard deviation over three experiments. ... 22
Figure 4.4 Weight losses of the complex coacervate at a composition of 0,36F- (blue line) and 0,26F- (red line) during the heating process as function of time. The temperature is plotted as function of time (dotted line). ... 23
Figure 4.5. Lipases distribution coefficient [KD] as function of the salt concentration [mM]. ]. All enzymes were studied at an Initial concentration of 0,067 mM. PPL (left). CALB (middle). CALA (right). The error bars show the standard deviation over three experiments. ... 24
Figure 4.6. Lipases distribution coefficient [KD] as function of the total polyelectrolyte concentration[g/L]. All enzymes were studied at an Initial concentration of 0,057 mM. Salt concentration 10mM. PPL (left). CALB (middle). CALA (right). The error bars show the standard deviation over three experiments. ... 25
Figure 4.7. Lactic acid distribution coefficient (KD) as a function of (a) Complex composition (F-) (b) total polyelectrolytes concentration [g/L] (c) salt concentration [mM] (d) Initial lactic acid concentration [mM]. The error bars show the standard deviation over three experiments. ... 28
Figure 4.8. Lactic acid distribution coefficient (KD) as a function of Initial lactic acid concentration [mM] ... 29
Figure 4.9. Lactic acid distribution coefficient (KD) as a function of temperature [°C]. Initial concentration LA 100mM, NaCl 10mM. ... 29
Figure 4.10. Lactic acid distribution coefficient [KD] in enzyme-filled complex coacervates as function of salt concentration[mM]. The error bars show the standard deviation over three experiments. .... 30
vii
Figure 4.12. Butanol distribution coefficient [KD] in enzyme-filled complex coacervates as function of salt concentration[mM]. The error bars show the standard deviation over three experiments. .... 33 Figure 5.1. Synthesis of Butyl lactate from lactic acid and butanol. ... 35 Figure 5.2. Esterification activity of the lipases studied. ... 36 Figure 5.3. Samples of the esterification reaction at a longer reaction time. ... 40 Figure 5.4. Gas chromatography results for the esterification reaction of butanol and LA with PPL as a
catalyst. ... 40
Figure A. 1. Ion chromatography result of a lactic acid sample ... 52 Figure A. 2. Calibration curve lactic acid concentration Ion chromatography ... 52 Figure A. 3. Calibration curve butanol concetration – Gas chromatograph. The error bars represent the
standard deviation between 3 measurements on the same sample. ... 53 Figure A. 4. Gas chromatography results – Butyl lactate. ... 54 Figure A. 5. Calibration curve butyl lactate concetration – Gas chromatography. The error bars
represent the standard deviation between 3 measurements on the same sample. ... 54
Figure B. 1. Amount of complex coacervate as function of complex composition [F-] at 20g/L of total polyelectrolyte concentration. ... 57 Figure B. 2. Lipases distribution coefficient [KD] as function of the mixing time (left) and the order of
addition (right) . PPL initial concentration 0,065 mM. The error bar represent the standard deviation of three experiments. ... 58 Figure B. 3. The absorbance spectrum of the supernatant of PEI/PAA complex coacervates compares to
the absorbance spectrum of 0,065 mM of PPL, CALB and CALA. Lipases concentration is demined at 280nm, and all the samples were measured at a 13-fold dilution. ... 59 Figure B. 4. SDS-PAGE gel of the samples of the enzymes as function of the complex composition [F-] 60 Figure B. 5. Lipases concentration in supernatant [SN] and complex coacervate [CC] as function of the
polyelectrolyte composition F-. PPL initial concentration 0,083 mM. CALB Initial concentration 0,052 mM. CALA Initial concentration 0,035 mM. The error bars show the standard deviation over three experiments. ... 62 Figure B. 6 Lipases concentration in supernatant [SN] and complex coacervate [CC] as function of the salt
concentration [mM]. ]. All enzymes were studied at an Initial concentration of 0,067 mM. The error bars show the standard deviation over three experiments. ... 62 Figure B. 7. Lipases concentration in supernatant [SN] and complex coacervate [CC] as function of the
total polyelectrolyte concentration[g/L]. All enzymes were studied at an Initial concentration of 0,067 mM. Salt concentration 10mM.The error bars show the standard deviation over three experiments ... 62 Figure B. 8. Lactic acid concentration in supernatant [SN] and complex coacervate [CC] as a function of
(a) Complex composition (F-) (b) total polyelectrolytes concentration [g/L] (c) salt concentration [mM] (d) Initial lactic acid concentration [mM]. The error bars show the standard deviation over three experiments. ... 63 Figure B. 9. Lactic acid concentration in supernatant [SN] and complex coacervate [CC] as a function of
Initial lactic acid concentration [mM]. ... 63 Figure B. 10. Lactic acid concentration in supernatant [SN] and complex coacervate [CC] as a function of
temperature [°C]. At 0,3 F- complex composition (left). At 0,4 F- Complex composition (right). Initial concentration LA 100mM. ... 64 Figure B. 11. Butanol concentration in supernatant [SN] and complex coacervate [CC] as a function of
Complex composition (F-). ... 65 Figure B. 12. . Butanol concentration in supernatant [SN] and complex coacervate [CC] as a function of
viii
Abbreviations
LA Lactic Acid
PLA Poly-Lactic Acid
PBT Poly-Butylene Terephthalate
PPL Porcine Pancreas Lipase
CALA A-lipase from Candida antarctica
CALB B-lipase from Candida antarctica
PAA Poly(Acrylic Acid)
PEI Poly(Ethylenimine)
PAH Poly(Allylamine Hydrochloride)
KD Distribution coefficient
pI Isoelectric Point
IC Ion Chromatography
1
Chapter 1.
Introduction
Nowadays, most of the polymer materials used are derived from petrochemical sources. The quest for renewable materials has become a research horizon in the chemistry field to shift a fossil-based society towards a sustainable and carbon-neutral society. In line with this ideal, polylactic acid (PLA), a biodegradable polyester derived from renewable resources, is presented as a promising substitute to replace the standard petroleum-based polymeric materials[1].
The general synthesis of PLA is a combination of fermentative production of lactic acid (LA) from biomass with chemical polymerization, based on two main routes; direct LA condensation or ring opening polymerization from esters of the acid[2]. Both methods require high purity monomers, high temperatures and vacuum for the reaction conditions, besides, while the first one produces a low molecular weight polymer due to equilibrium limitations, the second one usually, contaminates the polymer produced due to the usage of toxic heavy metals based catalyst[3].
Thus, not only the lactic acid recovery from the fermentation broth becomes a variable of concern for the PLA production, but so does searching for an efficient process to obtain high purity LA at low production cost to be competitive in the polymer market. But also, the introduction of alternative processes to decrease the environmental impact in the production of PLA.
The possibility of producing biodegradable polyesters through polycondensation catalyzed by enzymes, including lipases and cutinases, have been studied for the last thirty years[4]. Enzymatic polymerization is presented as an environmentally friendly process that involves high selectivity, low boiling solvents and milder reactions conditions such as low temperatures, neutral pH and atmospheric pressures[5].
An extensive application of enzymes as bio-catalyst for polymer synthesis is hindered by the low stability in chemical reactors, limiting its usage in industrial applications[6]. Nonetheless, immobilization of enzymes with water-insoluble particles, gels, or hollow fibers enhances the enzyme stability, recyclability, and reuse; offers a different path for enzymes utilization[4].
Recently, it has been demonstrated that complex coacervates, liquid phases formed by oppositely charged macromolecules, can incorporate proteins up to high concentrations[7] while retaining their catalytic activity[8] and can easily release them by changing the surrounding conditions, such as increasing the ionic strength[9]. Moreover, small organic acids like acetic acid or butyric acid can be concentrated inside the complex. McCall et al., 2018 reported the spontaneous partitioning and polymerization of the cytoskeletal protein actin inside complex coacervates, demonstrating the possible application of coacervates as bioreactors for studying biomolecular reactions[10].
Chapter 1. Introduction
[image:11.595.170.431.70.188.2]2 Figure 1.1. Proposed method to produce PLA from extracted LA
The formation of PLA is based on an esterification reaction. Therefore, this project will evaluate a simplified version of the previously stated overview: the formation of an ester inside the enzyme-filled complex coacervate. For this purpose, this research will assess the extent at which LA can be concentrated inside the complex coacervates, as one of the primary aims — followed by the evaluation of an esterification reaction between LA and butanol to obtain butyl lactate in a complex coacervate.
This model reaction was selected knowing that esters of lactic acid produced with alcohols of low molecular weight, such as butanol, are considered green solvents: non-toxic and biodegradable. They present excellent solvent properties including high boiling points, low vapor pressures and low surface tensions that could potentially replace the toxic alternatives for a wide range of industrial applications [11]. Hence, this study will provide new insights into the possible extraction of lactic acid with complex coacervates and the formation of a biodegradable ester; that will set an initial background to further development towards PLA production inside complex coacervates.
1.1.
Outlook of the Thesis
The prospective study was designed to investigate the possible usage of complex coacervates as extraction media for lactic acid. Taking advantages of the coacervates capabilities to not only extract the acid but transform it into valuable chemicals. The ultimate purpose for long term research would be to reach suitable conditions to produce PLA inside the complex coacervate. Thus, as an initial approach, it is essential to investigate whether the enzymes can catalyse an esterification reaction inside the complex coacervates. The aim of this project was limited to evaluate the possible formation of an ester of lactic acid with butanol inside the complex coacervate.
Initially, the evaluation of the partitioning of the enzymes that will be used as a catalyst for the esterification reaction is evaluated. Therefore, enzyme incorporation is explored to determine suitable conditions to obtain high concentrations inside the complex coacervate.
Subsequently, the LA incorporation in complex coacervates is studied. The effect of different variables such as temperature, compositions, and concentrations are explored to assess at what extent LA can be concentrated inside the complex coacervate. Moreover, butanol and butyl lactate partitioning are evaluated to verify whether these components allocate inside the complex coacervate.
Chapter 1. Introduction
3 solvents to verify the activity of the enzymes to form esters of the acid. Then, the possible formation of the ester inside the complex coacervate is assessed.
4
Chapter 2.
Background
In this chapter, the theoretical background of the project is introduced. Initially, an overview of the production of lactic acid is presented. Subsequently, the lactic acid enzymatic polymerization is described, including the most common enzymes used and the reaction pathway. Finally, the formation of the complex coacervates is explained, together with essential findings regarding its possible applications.
2.1.
Lactic acid
Lactic acid is an organic acid containing a dual functional group: hydroxyl and a carboxylic acid (Figure 2.1) a characteristic that makes it attractive for the production of many valuable chemicals[12]. It is widely used in food, cosmetic and pharmaceutical industry taking advantages of its chiral structure [13]. Furthermore, it can be used as a feedstock for the production of green solvents and as the building block for the production of a biodegradable polyester: PLA, a promising polymer for the substitution of petroleum-based thermoplastics. PLA presents some comparable properties to conventional polymers, such as gloss, clarity, and processability similar to polystyrene and barrier properties analogous to polyethylene terephthalate. Additionally, its viscosity, purity, and tensile strength make it suitable for applications in the medical field, fibers, and packaging materials[12].
Figure 2.1. Lactic acid structure
LA can be produced via chemical synthesis or microbial fermentation. Acetaldehyde is the starting material for the chemical route (Figure 2.2. Overview of the chemical synthesis of LAFigure 2.2) providing a racemic mixture of LA, where hydrogen cyanide is added in the presence of a base to produce lactonitrile at high atmospheric pressures, followed by distillation to recover the lactonitrile crude, and hydrolysis with concentrated H2SO4, to obtain lactic acid and ammonium salt. Furthermore, to achieve a higher purity, the lactic acid reacts with methanol to produce methyl lactate, passing through a distillation step to be further hydrolyzed by water, obtaining lactic acid and methanol[14].
Chapter 2. Background
5 On the other hand, fermentation of renewable feedstock is the preferred path for the production of LA, representing about 90% of the total LA worldwide produced[15]. Beet sugar, molasses, whey, and barley malt are commonly used for its commercial production; nonetheless, different starting materials can be implemented, from dairy wastes containing lactose and sugars to beverage industry wastes containing sucrose, where price and availability play an essential role in its selection[16].
Depending on the feedstock, the process conditions are adjusted, but generally, the fermentation takes place at 35 to 45°C, and the pH is maintained at a constant value between 5 to 6.5 adding a suitable base such as hydroxides, carbonates or ammonia to ensure the performance of the microbial strains[14]. The rate of the fermentation process depends on the pH, temperature, and initial substrate concentration and the reported yield after the fermentation stage is around 90 – 95% based on initial carbohydrates concentration[17].
The fermentation broth contains salts of lactic acid, other organic acids, unreacted materials, nutrients, microorganism, among others. Thus, separation and recovery steps are necessary to achieve the required purity. The conventional process to obtain LA (Figure 2.3) involves the precipitation of calcium lactate, which is reacidified with a strong acid to obtain crude lactic acid[18]. Subsequently, the calcium sulfate is removed by filtration; the filtrate is purified using carbon columns and evaporated to produce technical grade lactic acid.
Figure 2.3. Layout of the conventional process for lactic acid recovery by precipitation[19]
Nonetheless, by this conventional recovery process, a large amount of calcium sulfate cake is produced with some organic impurities making it harder to dispose of: approximately one ton of calcium sulfate is produced for every ton of lactic acid produced, generating an environmental concern[12]. This route have made large-scale production economically and environmentally unattractive, creating an opportunity to overcome the separation barriers.
2.2.
Downstream process of Lactic acid
Chapter 2. Background
6 organic acids in the fermentation broth that present similar properties to LA [20]. Making conventional separation approaches such as distillation or solvent extraction with standard organic solvents unprofitable[21].
To date, several techniques have been tested for the recovery of LA from the fermentation broth looking to reduce production cost, amount of effluents and thus, decreasing the negative impact towards the enviroment[18]. Precipitation, adsorption, solvent extraction, reactive distillation, and membrane separation process are some of the technologies that have been used as an alternative for the conventional process[15].
The introduction of these separation technologies presented benefits, developing a more efficient production of LA; however, still, some drawbacks are reported. In solvent extraction, high distribution coefficients (Kd) are required to establish an economically attractive extraction, referring to the ratio of the concentration of LA in the solvent phase to the concentration of LA in the aqueous phase [12].
Preliminary work on the distribution coefficient of LA in aqueous solution and organic solvents has observed a strong dependence on pH and initial concentration of LA, obtaining the highest distribution coefficients at a pH between 5,5 and 5,8 related to the complete deprotonation of LA[21].
Regarding the dissociation behavior of LA in an aqueous solution (2.1), it is completely dissociated at a pH >> pKa = 3,85, meaning only lactate ions are present in the solution[21]. Figure 2.4 illustrates the equilibrium of a lactic acid aqueous solution at a concentration of 100mM, where the concentration of lactic acid [HA] and lactate ions [A-] are calculated as a function of the hydrogen ions, as can be seen in the following equations:
𝐻𝐴(𝑎𝑞)+ 𝐻2𝑂 ⇔ 𝐻3𝑂+(𝑎𝑞)+ 𝐴−(𝑎𝑞) 2.1
[𝐴−] =[𝐻𝐴]𝑡𝑜𝑡[𝐻3𝑂
+]
[𝐻3𝑂+] + 𝐾𝑎
2.2
[𝐻𝐴] = [𝐻𝐴]𝑡𝑜𝑡 𝐾𝑎
[𝐻3𝑂+] + 𝐾𝑎
[image:15.595.194.495.464.741.2]2.3
Chapter 2. Background
7 Various studies have assessed the efficacy of solvents for LA extraction, with a significant focus in amines, known as effective extractants for carboxylic acids in aqueous solutions[12]. A summary of these findings is presented in Table 2.1, including silica beads with nitrogen-based functionalities[22].
Table 2.1. Solvents tested for LA extraction. (adapted from [12])
Extractant Diluent LA initial concentration
Distribution
coefficient Reference
Tri-n-octylamine-Tripropylamine (2:8w/w, 1 mol/kg)
1-octanol/n-heptane (3:7 w/w) 2,3 M (20%w) 0,8 [23]
Tri-n-butyl phosphate - 2,3 M (20%w) 0,95 [24]
Tri-n- octylamine (1M) Chlorobutane 2,3 M (20%w) 1,4 [25]
Alamine 336 (0,3 M) MIBK 1,3 M (11%w) 8,13 [26]
Alamine 336 (50%) Oleyl alcohol 0,11 M (1%w) 13 [27]
Alamine 336 (40%) MIBK 1,6 M (14%w) 4,24 [28]
Alamine 336 (30%) Octanol 0,38 M (3,4%) 25,95 [28]
Alamine 336 (40%) Decanol 0,76 M (6,8%) 23,37 [29]
Silica beads functionalized with
N-N-didodecylpyridin-4-amine n-Octanol
0,013 M
(0,12%) 27 [22]
As can be seen in Table 2.1, there is a potential application for non-conventional solvents with favourable distribution ratios for LA. However, the requirement of expensive equipment to be able to provide a high exchange area for efficient separation and the in-situ application limited by the toxicity of the extractants towards the microorganism, reduce the utilization of liquid-liquid extraction in the industrial process[19].
As far as membrane filtration is concerned, electrodialysis and nanofiltration present promising results, including low energy requirement, low chemical consumption and low effluent generation [13]. It can be implemented in situ to remove the lactic acid continuously from the fermentation broth, maintaining the operational pH. A double electrodialysis process has been developed successfully to produce concentrated lactic acid using an initial electrodialysis unit to remove the multivalent ions followed by a water-splitting unit with bipolar membranes achieving a high recovery yield (> 95%)[30]. Nonetheless, polarization and fouling problems limits the application of electrodialysis on large scale, besides additional process steps should be implemented to achieve lactic acid with high purity for polymerization applications[19].
In terms of obtaining high purity lactic acid, reactive distillation becomes an attractive alternative, where the lactic acid reacts with alcohol, followed by a distillation of the ester and hydrolysis to obtain the free lactic acid and alcohol[12]. Esterification is the only downstream process that allows the separation of lactic acid from other organic acids, due to the differences in boiling points of their ester compounds[20]. Generally, these reactions present thermodynamics limitations, therefore, a large excess of alcohol and rapid removal of water are common practices to obtain high yields (between 60% to 100% - depending on the water removal method implemented). However, the presence of impurities in the feed stream such as residual sugars and proteins affect the performance of the catalyst, cation exchange resins, complicating steady state operation[12].
Chapter 2. Background
8 further investigations to develop a more efficient and economically attractive process to potentialize the production of LA.
2.3.
Enzymatic polymerization of lactic acid
In the last two decades, enzymatic polymerization has become a significant synthetic method in polymer chemistry[31]. Not only are enzymes able to catalyse polymerization reactions under mild conditions, such as low temperatures and low boiling solvents, but they promote the formation of good quality polymers due to its high enantio-, chemo- and region-selectivity[4].
These bio-catalysts are derived from renewable resources, being eco-friendly, recyclable and non-toxic materials[3,4,32]. Thus, enzymatic processes are presented as environmentally benign, that can synthesize various polymers with well-defined structures.
Several studies have been reported exploring the applications of the enzymes in polymerization reactions. Lipases are one of the most promising catalysts due to their extensive range of applications[32]. Lipases are a very versatile class of biocatalyst stable in organic solvents and over a wide pH range, and, are specific towards ester bonds, reducing the possibility of the formation of undesired by-products[15].
Enzymatic polyester synthesis can take place via polycondensation of hydroxyacids, illustrated in Figure 2.5 for the production of PLA directly from lactic acid accompanied by the formation of water as a by-product. The polycondensation reactions are determined by equilibrium, where usually the by-product is removed from the reaction zone to drive the equilibrium in the direction of the products[4].
Figure 2.5. PLA formed by polycondensation of LA[33]
Generally, enzymatic production of polyesters takes place in organic solvents such as toluene, heptane, hexane and di-isopropyl ether. The reactions rate for these type of processes are low, taking into account several days to notice a significant conversion of the monomers[34]. A great deal of previous research into polyester synthesis has focused on lipases from mammalian (Porcine Pancreatic lipase) (PPL)) fungal (Candida antarctica Lipase B (CALB) or bacterial origin (Pseudomonas cepacian PCL)[3].
Chapter 2. Background
9 Divakar et al. (2003) studied the polymerization of lactic acid catalysed by PPL, and two types of immobilized enzymes from Rhizomucor miehie, evaluating the influence of the substrate lipase/ratio and the initial concentration of LA on the average molecular weight of the PLA. They observe that PPL was the most suitable catalyst from a molecular weight and conversion point of view, achieving a molecular weight of 1423 Da with an 80,2% conversion at 69°C in hexane: Methyl isobutyl ketone mixture (7:1) [37]. Sonwalkar et al. (2003) studied the polycondensation of LA in the organic solvents in the presence of silica gel with PPL as biocatalyst. They noticed that the conversion is higher in the presence of the silica due to the absorption of the water formation by these particles; but more interestingly, they observed that even higher conversion rates could be achieved with only silica gel particles [38]. Lasalle & Ferreira (2008), detected 96% conversion for PPL in the presence of hexane at 60°C for 96 hours. Nonetheless, low molecular weight oligomers were the principal products of the reaction, suggesting PPL is not as effective for the polymerization of LA[3].
Regarding the lipases from Candida antarctica, two different lipases are produced CALA (45 kDa) and CALB (33 kDa). CALB is broadly studied in the field of esterification reactions. Both enzymes are stable over a broad pH range, being CALB more stable at alkaline pH while CALA more stable at acidic pH[39].
CALB is a globular protein composed by 317 amino acids. It presents a broad substrate specificity, including regio- and enantioselectivity. Besides, it is extensively used due to its exceptional catalytic activity and versatility for esterification and transesterification reactions, preferred in its immobilized commercial presentation on an hydrophobic carrier for industrial applications, known as Novozym 435 (Novozymes A/S, Copenhagen, Denmark) or Chirazyme L-2 (Roche Molecular Biochemicals, Mannheim, Germany)[40].
Lasalle & Ferreira (2008), observed that CALB was the most effective catalyst for the production of PLA from direct condensation of LA, in comparison with PPL and a lipase from Pseudomonas cepacia; achieving 60% of LA conversion and a polymer recovery of 55% in n-hexane at 60 °C for 96h[3]. The majority of the polyesters produced in the presence of CALB present a low molar mass, therefore, are destinated for biomedical applications, mainly for delivery systems[41] Knez et al. (2012) investigated the formation of lactate esters by the direct esterification of n-butanol and LA catalyzed by immobilized CALB in supercritical carbon dioxide. They observe the highest LA conversion with n-hexane as co-solvent at 55 °C and 30MPa using a stirred – tank reactor[42]. Moreover, Pirozzi & Greco (2004) studied the esterification of n-butanol and LA comparing different lipase sources. They observe that the optimal temperature for esterification is around 45°C and no esterification activity is detected above 60°C. Furthermore, low concentration of the substrates are preferred to avoid a negative effect of the acid over the enzyme stability. In these experiments octane was used as a solvent and CALB presented the highest esterification activity among the studied enzymes[11].
CALA is stable above 90°C, considered as one of the most thermostable lipases described to date. Another attractive characteristic of this lipase is the specificity towards highly sterically hindered substrates, being able to accept highly branched acyl groups. When it is compared with other lipases, it is the only one able to catalyse very bulky substrates, being recognized as a potential bio-catalyst not fully exploded yet[39].
Chapter 2. Background
10 Table 2.2. Some properties of lipases from porcine pancreas and candida antarctica[39,43]
Lipase from porcine pancreas [PPL]
Lipase B from candida antarctica [CALB]
Lipase A from candida antarctica [CALA]
Molecular weight [kDa] 50-52 33 42
pH range stability 6,5-9 7-10 6-9
Isoelectric point (pI) 4,9 6 7,5
2.4.
Complex coacervates
Polymers are long molecules formed by a large number of reiterating units (monomers) linked by covalent bonds; they are essential units for synthetic materials such as plastic bags or nylons or can be found in nature including rubber, cellulose, DNA, proteins among others. Polymers that contain charged monomers are known as polyelectrolytes, composed of acidic or basic groups or salts that can dissociate in water[44]. They are classified as weak or strong polyelectrolytes, where the pH determines the degree of dissociation for weak polyelectrolytes, while in most of the pH values strong polyelectrolytes are completely dissociated. Figure 2.6 gives the schematic representation of the effect of the pH in the polyelectrolytes charges, where at low pH weak poly-bases are fully charged and at high pH uncharged, presenting the opposite effect for weak poly-acids[45].
Figure 2.6. Charge of polyelectrolytes as function of the pH [45]
Chapter 2. Background
11 Figure 2.7. Right – Schematic representation of complex coacervate formation in aqueous solutions. Complex
coacervate formation by mixing two oppositely charged polyelectrolytes (polyacrylic acid and polyethyleneimine)
The main driving force for polyelectrolyte complexation is believed to be the electrostatic interactions between the oppositely charged polyelectrolytes in water followed by additional molecular interactions such as hydrogen bonding, chirality and hydration in combination with entropic gains associated to the release of counter-ions and restructure of molecules[47,48]. The release of the counter-ions reveal an entropic dependence of the complex formation, expressing a significant effect of overall salt concentration. High salt concentrations destabilize the phase separation by decreasing the entropic driving force for the complex formation[9,48].
The ratio between the positive and negative charges is directly related to the ability of a mixture to form a complex coacervate, seeking to achieve electroneutrality in a given phase. Generally, the formation of a complex coacervate occurs in a range of stoichiometric compositions, obtaining the larger amount of complex around the net neutrality[49]. Therefore, the pH becomes a significant variable when weak polyelectrolytes are taken into account, where the charge present in the polymer is function of the pH.
Furthermore, the temperature has a relatively weak effect on the complex coacervate formation, where only small changes have been detected in the enthalpy and entropy of the complex formation[49,50]. However, it is mentioned that increasing in temperature enhance the hydrophobic interaction and polyelectrolyte dissociation in synthetic polyelectrolytes, thus, it present a larger effect when the total polyelectrolyte concentration is higher[44,51].
2.5.
Complex coacervates applications
In previous studies[46,52,53], it has been demonstrated that small molecules can migrate into complex coacervates, mainly due to the low surface tension between the dense polyelectrolyte phase and the diluted phase facilitating the uptake of different component crossing the interphase with a low energetic barrier[46,54]. The ability of complex coacervates to accumulate small molecules expand its possible applications including drug delivery purposes, loading the complex with pharmaceutical compounds[53]; extracting contaminants from aqueous solutions[52]and in the food industry can be used as a protective coating for flavours andoils [55].
Chapter 2. Background
12 be considered when proteins are taken into account, leading to the formation of a complex coacervate depending on salt concentration and pH[7].
13
Chapter 3.
Experimental procedure
3.1.
Materials
Crystalline L-lactic acid was kindly donated by Corbion, the Netherlands. The negatively charged polyelectrolyte poly(acrylic acid) (PAA) (Cat# 06567, MW ~6,000), and the positively charged polyelectrolyte poly(ethylenimine) (PEI) (Cat# 06089, MW ~1,800) were purchased from Polysciences. Sodium Chloride, 1-butanol (analytical reagent grade 99,7%), n-heptane (analytical reagent grade 99%) and n-Butyl lactate (>98% w/w) were purchased from Sigma Aldrich, and ultrapure water dispensed from a Mili-Q water system (PURELAB® flex) at a resistivity of 18,2 MΩ was used in all samples preparations.
Stocks solutions of PAA, PEI, and LA were prepared by dissolving the compounds in ultrapure water. The pH of these solutions was adjusted to 7 with NaOH (Merck) or HCl (Merck) after its total dissolution.
Lipase from porcine pancreas (PPL) was purchased from Sigma Aldrich and used without further purification. A-lipase (CALA) and B-lipase (CALB) from the yeast Candida antarctica were donated by Novozymes, Denmark.
Stock solutions of PPL were prepared by dissolving the powder in ultrapure water, the pH of the partly dissolved sample is adjusted to 7 with NaOH or HCl. Subsequently, it is mixed for one hour and then centrifuged for 20 min at 3000rpm (Beckman Coulter BenchTop Centrifuge Allegra), where the precipitate is discarded.
Stock solutions of CALA and CALB were prepared by diluting the sample by a 7-fold dilution for CALA an 14-fold dilution for CALB followed by the addition of NaOH or HCL to adjust the solutions to neutral pH.
3.1.1.
Defining complex composition
The complex composition is defined[7,8] according to Equation 3.1, where [𝑛+] is the concentration of charges on the PEI in solution, and [𝑛−] is the concentration of chargeable groups of PAA, assuming that both polyelectrolytes are fully charged at pH 7. Thus, the charge of any amount of polyelectrolyte is based on the molecular weight of its composite monomer.
𝐹−= 1 − 𝐹+= [𝑛−]
[𝑛−] + [𝑛+]
3.1
Chapter 3. Experimental procedure
14
PEI PAA
Figure 3.1. Schematic representations of poly(ethylenimine) (PEI) and poly(acrylic acid) (PAA)[59]
Electroneutrality of the mixture is found at 0,5 F-. However, a deviation from this value can be observed experimentally due to the actual number of charges on the weakly charged polyelectrolytes, that is unknown. The charges of these polyelectrolytes are highly dependent on the pH of the system and can be influenced by the presence of another polyelectrolyte in the system, making it challenging to make an accurate estimation[7].
3.2.
Methods
3.2.1.
Complex coacervates - Partitioning experiments
Complex coacervation leads to the formation of two liquid phases, a dense polymer rich phase (coacervate) and a dilute polymer phase (supernatant) existing in equilibrium. This phase separation can be used to concentrate biomacromolecules such as proteins[7,9,54,60], small organic molecules[46] or, even inorganic nanoparticles[61].
The distribution of lipase, lactic acid, butanol and butyl lactate is studied in this project. Two methods were followed for the calculation of the distribution coefficient of the different molecules, including the evaluation of the effect of specific factors over the partitioning of the components, such as complex composition [F-], total polyelectrolyte concentration, salt concentration, initial component concentration, and temperature.
Method 1
Method 1 is established for the complex coacervate formation and concentration of the small molecules in the complex coacervate phase: lactic acid, 1-butanol, and butyl lactate. It is schematically described in Figure 3.2, using LA as the exemplifying component.
Chapter 3. Experimental procedure
15 Initially, the polyelectrolytes solutions are mixed at the desired composition [F-], polyelectrolyte concentration and salt concentration in an aqueous solution reaching a total volume of 500µL. Subsequently, after one night of equilibration, the mixtures are centrifuged using an Eppendorf Centrifuge 5425 for 30 min at 12500 rcf.
Once the complex coacervate is formed, the supernatant is removed and replaced with 500µL of a solution of known concentration containing the molecules of interest i.e. LA, butanol or butyl lactate. Subsequently, the samples are equilibrated overnight and centrifugated one more time for 30 min at 12500 rcf. The concentration of the compounds in the remaining supernatant is measured by ion chromatography or gas chromatography.
The amount of complex coacervate formed in every sample is determined by weighting each sample on an analytical balance (Sartorius BP61S Analytical Balance). To estimate the concentration of the compound of interest in the complex coacervate, the amount of the compound that is incorporated in the complex coacervated is calculated by mass balance, subtracting the total amount of the compound in the solution to the remaining amount present in the supernatant. Additionally, it is assumed that the complex coacervate has the same density as water, due to its water content, that it is roughly between 60 to 80%[50]. The experiments were done in triplicates, and the results are presented as an average with the standard deviation.
Method 2
Method 2 is followed for the incorporation of the bio-macromolecules, i.e., Lipases in the complex coacervate, as can be seen in Figure 3.3.
Figure 3.3. Method 2 – Incorporation of lipases inside complex coacervates.
The sample volume for all experiments was fixed at 500µL. The stock solutions were mixed to obtain samples of the desires polyelectrolyte composition, total polyelectrolyte, protein and salt concentrations. Afterwards, the samples were equilibrated at least eight hours, followed by centrifugation for 30 minutes at 12500 rcf (Eppendorf Centrifuge 5425)
Chapter 3. Experimental procedure
16 peptide sequence of the enzymes, presented in Appendix B.1; while the extinction coefficient used for CALB is reported by Rabbani etal. (2015)[62]. PPL 68715 M-1 cm-1 (MW = 51,579 kDa)[63], CALA 54570 M-1 cm-1 (MW=49,262 KDa) and CALB 40690 M-1 cm-1 (MW = 33 KDa)[62]
Furthermore, the amount of complex coacervate is determined by weighting each sample on a digital scale. The water content of a complex coacervate is roughly between 60 to 80%[50], besides the density of PEI is 1,05 g/L and PAA is 1,15g/L. Therefore, it is assumed that the density of the complex coacervate is the same as water to estimate its volume. The enzyme incorporated inside the complex coacervate is calculated by a mass balance, subtracting the total amount of enzyme present in the supernatant from the total added enzyme. All experiments were done in triplicates, and the results are presented as an average with the standard deviation.
3.2.2.
Esterification reaction in an organic solvent
[image:25.595.212.385.361.491.2]A 2ml sample containing 10mg of the enzyme with 1-butanol and lactic acid in excess of the alcohol is prepared, in a 4:1 ratio. The reagents were diluted in n-heptane at low concentrations (LA 100 mM) to avoid the formation of a two-phase system. The mixtures were incubated for 2 hours in 5-ml glass tubes at 50°C using a magnetic stirrer at 500 rpm, as can be seen in Figure 3.4.
Figure 3.4. Experimental setup for the esterification reaction in the presence of an organic solvent at 50°C and 500rpm.
Butanol and butyl lactate concentrations were measured by a Thermo Scientific Trace 1300 gas chromatograph equipped with a flame ionization detector. One unit of esterification activity of the studied lipases is expressed as one µmol of butanol consumed per mg catalyst per minute [µmolBu/min*mg lipase].
3.2.3.
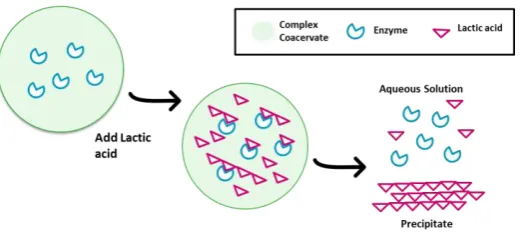
Esterification reaction in the complex coacervate phase
The production of butyl lactate from lactic acid and 1-butanol is studied to determinate if the enzymes are active inside the complex coacervate and are able to catalyse an esterification reaction. To carry out this experiment, the complex coacervate is formed in an aqueous solution containing a known concentration of salt and enzyme by adding the polyelectrolyte solutions at the desired complex composition and polyelectrolyte concentration, as it is described in Method 2 of section 3.2.1
Chapter 3. Experimental procedure
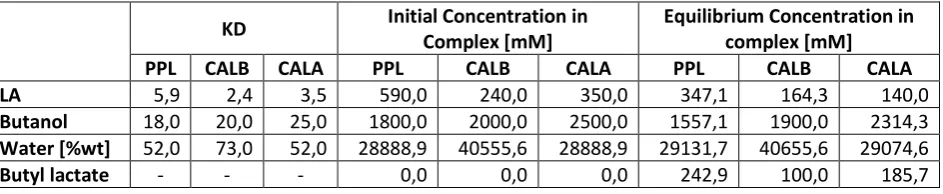
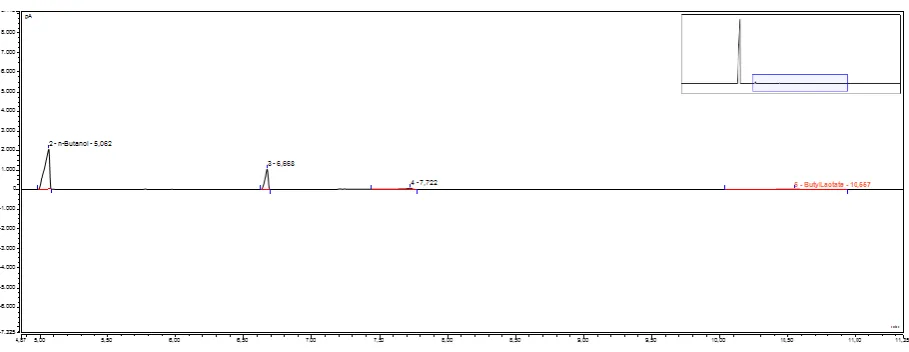
17 98 hours, a representation of the procedure is showed in Figure 3.5. The final concentrations of butanol and butyl lactate are determined by Thermo Scientific Trace 1300 gas chromatograph equipped with a flame ionization detector, detecting its presence in each phase: supernatant and complex coacervate. Nonetheless, before the analysis the complex coacervate is dissolved by the addition of 200µL of 2,5M NaCl solution. Every sample analysed by gas chromatography was diluted in a ratio 1:1 with acetone.
Figure 3.5. Schematic representation of the esterification reaction inside the complex coacervate
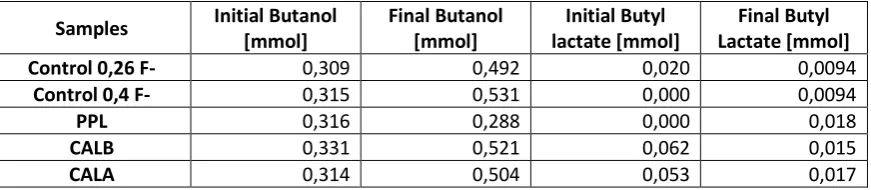
The butanol conversion (X) and yield (Y) towards butyl lactate is calculated based on the amount of butanol and butyl lactate that are presented in the sample after the 98 hours of reaction, as can be seen in the following equations:
𝑋𝐵𝑢𝑡𝑎𝑛𝑜𝑙=
𝐼𝑛𝑖𝑡𝑖𝑎𝑙 𝑚𝑜𝑙𝑒𝑠𝐵𝑢𝑡𝑎𝑛𝑜𝑙 − 𝑓𝑖𝑛𝑎𝑙 𝑚𝑜𝑙𝑒𝑠𝐵𝑢𝑡𝑎𝑛𝑜𝑙
𝐼𝑛𝑖𝑡𝑖𝑎𝑙 𝑚𝑜𝑙𝑒𝑠𝐵𝑢𝑡𝑎𝑛𝑜𝑙
3.2
𝑌𝐵𝑢𝑡𝑦𝑙 𝑙𝑎𝑐𝑡𝑎𝑡𝑒=
𝑃𝑟𝑜𝑑𝑢𝑐𝑒𝑑 𝑚𝑜𝑙𝑒𝑠 𝐵𝑢𝑡𝑦𝑙 𝑙𝑎𝑐𝑡𝑎𝑡𝑒
𝐼𝑛𝑖𝑡𝑖𝑎𝑙 𝑚𝑜𝑙𝑒𝑠𝐵𝑢𝑡𝑎𝑛𝑜𝑙
3.3
3.2.4.
Detection of the components
UV-VIS spectroscopy
The general use of UV-VIS spectroscopy to quantifying the protein concentration in an aqueous solution is seen as a fast and convenient method, where no additional reagents are required. The characteristic ultraviolet absorption of the proteins at 280nm is due to the aromatic amino acids tryptophan, tyrosine, and cysteine contained in their structures. Depending on the relative concentration of these three amino acids, the molar extinction coefficient of the protein is established. Thus, the extinction coefficient is specific of each protein and can be used to quantify its concentration in a solution[64]. Figure 3.6 shows the absorption spectrum of the enzymes studied in this project: PPL, CALB, and CALA at a same concentration illustrating the differences between them.
The absorbance of a component is related to its concentration in the solution and the path length of the solution. This dependence is stablished by the Beer-Lambert law as can be seen in Equation 3.4
Chapter 3. Experimental procedure
[image:27.595.195.397.169.333.2]18 Where, 𝜀 is the molar absorption coefficient, 𝑐 the molar concentration of the component and 𝑙 is the path length of the cell containing the solution (generally 1 cm). Thus, once the absorbance of the sample is measured at 280nm, the protein concentration can be calculated using the Beer-Lambert law and the molar extinction coefficient previously determined for the protein[64].
Figure 3.6. Absorption spectrum of PPL, CALB and CALA.
Gas Chromatography
Gas chromatography is an analytical technique generally used for the separation of volatile compounds. It is a widespread technique due to its high efficiency, which allows the separation of the components of a mixture in a reasonable time with accurate quantitation, even for the detection of minimal quantities.
In principle, the sample is injected into the instrument, vaporized and carried by the mobile phase (carrier gas) through the stationary phase contained in a column. The relative vapor pressure and affinities for the stationary phase are the properties responsible for the successful separation of the different components, presenting different retentions time within the analysis. The stronger the interaction is, the more time it takes to migrate through the column (retention time). Then, the detector measures the components at the exit of the column.
This analytical technique was used to measure the butanol and butyl lactate concentration. The calibration curve for each component is presented in Appendix A.
Ion Chromatography
Chapter 3. Experimental procedure
19 ionic interactions between the compounds, ions present in the eluent and the ionic functional groups of the chromatographic support are the base for the separation[65].
Two mechanisms play a significant role in the separation in ion chromatography: attraction and repulsion. Ion exchange by attraction occurs due to the competitive ionic binding and repulsion by the ion exclusion between similarly charged ions between the sample and the ions fixed in the stationary phase[65].
This analytical technique is commonly used to determine carboxylic acids of low molecular weight. It offers high detection sensitivity and extensive separation capacity, allowing the separation of a wide range of organic acids[66]. At high pH, the acids are present in their ionized form; thus, they can be separated employing anion exchange chromatography[67].
In anion exchange chromatography, the functional groups of the stationary phase carry a positive charge, while the compounds to be separated, carry a negative charge. When a sample is provided to the column, the ions present in the sample can reversibly replace the counterions bound to the charged functional group on the stationary phase. Thus, its movement throughout the column results at a slower velocity than the mobile phase. The adsorption of the ions to the stationary phase and desorption by the mobile phase ions is repeated within the column, and depending on the individual interactions, the residence time among diverse compounds can differ, allowing the separation[67].
20
Chapter 4.
Partitioning of molecules inside complex
coacervates
In this experimental chapter, the partitioning of the molecules of interest is evaluated. The purpose of this section is to explore the individual interactions between proteins, LA, butanol, and butyl lactate with the complex coacervate, to determine a possible accumulation of these molecules inside the dense-polyelectrolyte phase. The experimental results and discussion are presented in each subs-section, discussing the distribution of the enzymes, LA, butanol and butyl lactate.
4.1.
Partitioning of proteins in complex coacervates
Several factors have an effect on the incorporation of proteins within the complex coacervates. In this section, the accumulation of the lipase inside the complex coacervate is studied elucidating significant variables that affect this phenomenon.
Three different lipases, PPL, CALB, and CALA previously studied [3,6,68,69] were selected to evaluate their incorporation into the complex coacervate phase.
First, the purity of the enzymes was evaluated with polyacrylamide gel electrophoresis (SDS-page gel). This technique allows the separation of the proteins according to their molecular weights by applying an electrical field to promote the migration of the proteins through a sieving matrix[70]. The procedure followed for the preparation of the SDS-page gel can be seen in Appendix A.4. A 12% polyacrylamide gel was used according to the molecular weight of the enzymes. Figure 4.1 shows the SDS-page gel for the studied lipases at different concentrations, next to the ladder used to identify the apparent molecular weights (kDa) of the proteins contained in the samples (Thermo Scientific PageRuler Plus Prestained Protein ladder #26619).
PPL CALB CALA
Figure 4.1. 12% SDS-page gel for PPL ( 1. Ladder, 2. 0,25 g/L, 3. 0,5 g/L, 4. 1 g/L , 5. 2g/L), CALB (1. Ladder, 2. 1 g/L, 3. 2 g/L) and CALA (1. Ladder, 2. 1 g/L, 3. 2 g/L)
Chapter 4. Partitioning of molecules inside complex coacervates
21 sections, the proteins would be used without any further purification. Nonetheless, these results will be taking into account in the analysis of the data, seeing PPL as the least pure product.
4.1.1.
Protein incorporation as function of F-
Having defined the purity of the enzymes, it is time to discuss the incorporation of these proteins in the complex coacervate. Electrostatic interactions play a major role in the partitioning of different molecules into complex coacervates. For this reason, the complex composition, defined by the concentration of the positive and negative charges in the complex, is selected as one of the variables of evaluation.
For this experiment, method 2 (-section 3.2.1) is implemented at neutral pH, with a total polyelectrolyte concentration of 5 g/L and a low ionic strength of 10mM. Previous experiments were performed to observe the formation of complex coacervates between PEI and PAA; the details of this experiment can be seen in Appendix B.2. In this assessment, it was observed that the creation of the complex coacervate only occurs at a complex composition in the range of 0,09 and 0,66 F-. Thus, the effect of this factor is evaluated in this range for the following experimental section.
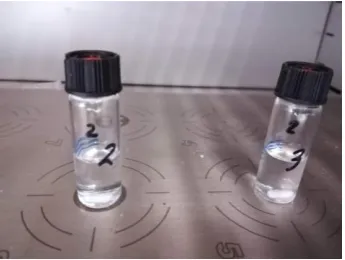
Figure 4.2 illustrates the results once the complex coacervate has incorporated the lipases. From this figure the differences between the lipases studied can be seen. CALB and CALA are liquid products presented as a transparent-dark coloured solution. PPL is a cream colour powder that forms a transparent solution when diluted and filtered in water. Thus, while the complex with PPL present a yellowish colour similar to the complex coacervate without any enzyme, the complex formed for CALA and CALB presents the colour of the stock protein solution as well.
Complex
Coacervate PPL CALB CALA
Figure 4.2. Complex coacervates with the incorporated enzymes at 0,26 F- complex composition.
The results obtained from the partitioning of the lipases are presented in Figure 4.3, where the distribution coefficient [KD] is plotted as a function of F-. The distribution coefficient is defined as the ratio of the lipase concentration in the complex coacervate and the lipase concentration in the supernatant, stated in Equation 4.1.
𝐾𝐷=
[𝑙𝑖𝑝𝑎𝑠𝑒]𝑐𝑜𝑎𝑐𝑒𝑟𝑣𝑎𝑡𝑒
Chapter 4. Partitioning of molecules inside complex coacervates
22 Figure 4.3. Lipases distribution coefficient [KD] as function of the polyelectrolyte composition F-. PPL (left) initial
concentration 0,083 mM. CALB (middle) Initial concentration 0,052 mM. CALA (right) Initial concentration 0,035 mM. The error bars show the standard deviation over three experiments.
From Figure 4.3, it can be seen that there is a significant effect of the complex composition on the accumulation of the enzymes in the complex coacervate. The highest distribution coefficient for PPL occurs at 0,26F- with a value of 18,5 ± 1,8. A similar result is observed for CALA at 0,28F- a distribution coefficient of 19,2 ± 0,7 is noticed. Meanwhile, for CALB, the highest distribution coefficient obtained is 11,0 ± 0,9 at a complex composition of 0,36 F-.
The distribution coefficient for the studied enzymes is in the same order of magnitude. The maximum incorporation for each protein appears at different F- ratios. Intuitively, the maximum incorporation for PPL and CALB was expected to be at a complex composition where a more substantial amount of positively charged polyelectrolyte is present. This prospect is related to the charges of the lipases, presenting a net negative charge at a pH above their isoelectric point (PPL pI = 4,9, CALB pI =6). This expectation fits accordingly to the results obtained.
Regarding CALA at pH 7, the system is too close to its isoelectric point (CALA pI= 7,4) estimating that the enzyme at this conditions has a low net positive charge. However, its maximum incorporation takes place when positively charged polyelectrolytes are present, suggesting that the protein enrichment of the complex coacervate not only depends on the charges of the components present in the system.
Prior studies have noticed the importance of the complex composition for the incorporation of proteins in complex coacervates, demonstrating that there is an optimal complex composition for the concentration of proteins inside complex coacervates[7,58]. Lindhoud & Claessens (2016), for example, found an optimal complex composition of 0,63 F- for the incorporation of lysozyme in a complex coacervate form by PPA and poly(N,N dimethylaminoethyl methacrylate). Furthermore, these studies suggest that the partitioning of this proteins is depenent on the properties of the component present in the system.
Chapter 4. Partitioning of molecules inside complex coacervates
23
4.1.2.
Water content of PEI/PAA complex coacervates
Previous studies have explored the relationship between the type of polyelectrolytes used and the water content of the complex coacervates, reporting roughly from 60% to 80% of water content in different complex coacervates evaluated[50].
In this section the water content of the complex coacervate formed by PEI and PAA was determined experimentally by a thermogravimetric analysis (TGA), in which the mass loss of the samples is measured over time as it is exposed at elevated temperatures. The TGA measurement was conducted on Netzsch STA 449 F3 Jupiter using a sample holder with a k-type thermocouple in an air environment. The temperature was increased from 30 to 120°C at a constant rate of 5°C/min and then held at 120°C for 30 min to evaporate the water present in the samples. The weight of the samples was recorded along the heating procedure to obtain the mass loss that represents the evaporated water.
The measurements were carried out for a complex composition of 0,26 F- and 0,36 F-, at a total polyelectrolyte concentration of 10 g/L and a salt concentration of 10mM. The total sample volume was 1,2 mL and at these conditions, 27 mg of complex coacervate is formed at a composition of 0,36F- and 16 mg at a composition of 0,26 F-.
Figure 4.4 shows the weight fraction of the complex coacervate during the heating process as a function of time. As can be seen, the complex coacervate at a composition of 0,36F- contained the more substantial amount of water, calculating a water content of 73,5 wt.%. Meanwhile, the complex at 0,26 F- presented a water content of 51,9wt%.
Figure 4.4 Weight losses of the complex coacervate at a composition of 0,36F- (blue line) and 0,26F- (red line) during the heating process as function of time. The temperature is plotted as function of time (dotted line).
Chapter 4. Partitioning of molecules inside complex coacervates
24 It is interesting to see the alterations in the complex coacervates created at different compositions. From the results, it can be inferred that a change in the complex composition affects the amount of polyelectrolytes that will interact to create the phase separation, including the water uptake of the complex coacervate. In the next section, the effect of the ionic strength will be evaluated for the accumulation of the lipases inside the complex coacervate.
4.1.3.
Protein incorporation as function of salt concentration
Ionic strength is an important parameter that affects the interactions within the polyelectrolyte complexes. In this section, the effect of the salt concentration on the partitioning of the enzymes is evaluated.
The experiments were done at a neutral pH with a total polyelectrolyte concentration of 5g/L at the optimal complex composition.
Figure 4.5. Lipases distribution coefficient [KD] as function of the salt concentration [mM]. ]. All enzymes were
studied at an Initial concentration of 0,067 mM. PPL (left). CALB (middle). CALA (right). The error bars show the standard deviation over three experiments.
In Figure 4.5, the distribution coefficient of the studied enzymes is plotted as a function of the salt concentration. A higher distribution coefficient is observed at low salt concentrations for the different lipases. However, 10mM is preferred for CALA, while for PPL and CALB 25mM and 50 mM are the most suitable values to achieve higher incorporation of the enzymes inside the complex coacervate.
What is interesting is the decrease of the lipase incorporation in the complex coacervate at a higher salt concentrations, which indicates the importance of electrostatic interaction on the partitioning of the enzyme in the complex coacervate. It can thus be suggested that at higher salt concentration the charges of the components are being screened by the presence of the counterions, minimizing the interaction between the protein and the charged polyelectrolytes.
Chapter 4. Partitioning of molecules inside complex coacervates
25
4.1.4.
Protein incorporation as function of total polyelectrolytes concentration
Another interesting factor to analyse is the total polyelectrolyte concentration that may affect the partitioning of the proteins in complex coacervates. The experiments were carried out at low salt concentration (10mM), and neutral pH at the optimal complex composition. The results are presented in Figure 4.6 in terms of the distribution coefficient of the lipases (KD) as a function of the total polyelectrolyte concentration [g/L].
Figure 4.6. Lipases distribution coefficient [KD] as function of the total polyelectrolyte concentration[g/L]. All
enzymes were studied at an Initial concentration of 0,067 mM. Salt concentration 10mM. PPL (left). CALB (middle). CALA (right). The error bars show the standard deviation over three experiments.
As shown in Figure 4.6, an increase in the total polyelectrolyte concentration reduced the lipase enrichment of the complex coacervate. The results were consistent between the three enzymes studied, which indicates that the total polyelectrolyte concentration has a significant effect on the incorporation of the proteins in the complex coacervate.
Previous studies have noted the importance of this variable in the coacervation phenomena. Burgess (1994) studied a system formed by two biopolymers. They observed that a high concentration of the polymers has a negative effect on the coacervation. This behavior was explained in terms of the proximity of the molecules, suppressing its free movement, and finally reducing the interactions[72]. Furthermore, Li et al. (2018) reported that an increase in the concentration of the total polyelectrolyte reflects an increase in the concentration of salt counterions next to the polymer chains inducing a stronger screening. Thus, a reduction of the polymer content in the complex coacervate is observed[73].
![Figure 2.4. Acid-base equilibrium of lactic acid at a concentration of 0,1 M. Concentration of lactate ion [A-]](https://thumb-us.123doks.com/thumbv2/123dok_us/9640487.466411/15.595.194.495.464.741/figure-acid-base-equilibrium-lactic-concentration-concentration-lactate.webp)

![Figure 4.7. Lactic acid distribution coefficient (KDpolyelectrolytes concentration [g/L] (c) salt concentration [mM] (d) Initial lactic acid concentration [mM]](https://thumb-us.123doks.com/thumbv2/123dok_us/9640487.466411/37.595.104.489.275.576/figure-distribution-coefficient-kdpolyelectrolytes-concentration-concentration-initial-concentration.webp)
![Figure 4.8. Lactic acid distribution coefficient (KD) as a function of Initial lactic acid concentration [mM]](https://thumb-us.123doks.com/thumbv2/123dok_us/9640487.466411/38.595.202.388.450.596/figure-lactic-distribution-coefficient-function-initial-lactic-concentration.webp)
![Figure 4.12. Butanol distribution coefficient [KD] in enzyme-filled complex coacervates as function of salt concentration[mM]](https://thumb-us.123doks.com/thumbv2/123dok_us/9640487.466411/42.595.78.529.343.457/figure-butanol-distribution-coefficient-complex-coacervates-function-concentration.webp)