Original citation:
Ashwin, T.R., Chung, Yongmann M. and Wang, Jihong. (2016) Capacity fade modelling of lithium-ion battery under cyclic loading conditions. Journal of Power Sources, 328. pp. 586-598.
Permanent WRAP URL:
http://wrap.warwick.ac.uk/83249
Copyright and reuse:
The Warwick Research Archive Portal (WRAP) makes this work by researchers of the University of Warwick available open access under the following conditions. Copyright © and all moral rights to the version of the paper presented here belong to the individual author(s) and/or other copyright owners. To the extent reasonable and practicable the material made available in WRAP has been checked for eligibility before being made available.
Copies of full items can be used for personal research or study, educational, or not-for-profit purposes without prior permission or charge. Provided that the authors, title and full bibliographic details are credited, a hyperlink and/or URL is given for the original metadata page and the content is not changed in any way.
Publisher’s statement:
© 2016, Elsevier. Licensed under the Creative Commons Attribution-NonCommercial-NoDerivatives 4.0 International http://creativecommons.org/licenses/by-nc-nd/4.0/
A note on versions:
The version presented here may differ from the published version or, version of record, if you wish to cite this item you are advised to consult the publisher’s version. Please see the ‘permanent WRAP URL’ above for details on accessing the published version and note that access may require a subscription.
Capacity fade modelling of lithium-ion battery under cyclic loading
conditions
T.R Ashwina,∗, Y. M. Chunga,∗∗, J. Wanga
aSchool of Engineering, University of Warwick, Coventry, CV4 7AL, UK
Abstract
A pseudo two-dimensional (P2D) electro-chemical lithium-ion battery model is presented
in this paper to study the capacity fade under cyclic charge-discharge conditions. The
Newman model [1, 2] has been modified to include a continuous solvent reduction reaction
responsible for the capacity fade and power fade. The temperature variation inside the cell
is accurately predicted using a distributed thermal model coupled with the internal chemical
heat generation. The model is further improved by linking the porosity variation with
the electrolyte partial molar concentration, thereby proving a stronger coupling between
the battery performance and the chemical properties of electrolyte. The solid electrolyte
interface (SEI) layer growth is estimated for different cut-off voltages and charging current
rates. The results show that the convective heat transfer coefficient as well as the porosity
variation influences the SEI layer growth and the battery life significantly. The choice of an
electrolyte decides the conductivity and partial molar concentration, which is found to have
a strong influence on the capacity fade of the battery. The present battery model integrates
all essential electro-chemical processes inside a lithium-ion battery under a strong implicit
algorithm, proving a useful tool for computationally fast battery monitoring system.
Keywords: Lithium-ion battery, electrochemical model, capacity fade, ageing
model, thermal model, battery management system
∗Present address: WMG, University of Warwick ∗∗Corresponding Author
1. Introduction
A battery management system (BMS) is an essential part of hybrid electric vehicles
(HEV), plug-in electric vehicles (PEV), and also large-scale grid support systems. Also the
demand for portable devices and electronic communication systems has accelerated the need
for more focussed research in batteries and battery packs. The lithium-ion battery is a
5
popular choice for battery packs due to its high energy density, relatively low self-discharge,
low maintenance, and suitability for high current applications. The use of battery packs in
grid support applications presents several challenges due to the rapid charge and discharge
demanded by grid operation which may cause unexpected failure that can potentially lead
to catastrophic damage to the batteries and bring the impact on to grid. A continuous
10
monitoring of an individual battery is critical to the smooth grid operation and the estimation
of remaining useful life (RUL) of the battery.
The success of a battery monitoring algorithm greatly depends on the accurate
predic-tion of electro-chemical parameters, capacity fade and thermal characterisapredic-tion. Capacity
fade and the prediction of electro-chemical characteristics are linked to the battery
oper-15
ating conditions. The thermal heat generation is also highly complicated to characterise
due to its dependency on multiple electro-chemical reactions. Electro-chemical modelling
using partial differential equations can predict battery characteristics accurately, but with
a high computational cost. This poses a main challenge for accurate battery modelling and
emphasises the need to focus more on electro-chemistry as well as numerical schemes for an
20
accurate and computationally fast monitoring system. This paper analyses the dependency
of main factors such as temperature, depth of discharge (DoD) and the charging current
rate on the SEI layer development. This study also improves the solution methods under an
implicit algorithm to solve the electro-chemical effects in battery, making it as a useful tool
for battery life monitoring.
25
There were early attempts to model the electro-chemical processes inside the battery by
solving the governing equations using a pseudo two-dimensional model, known as the P2D
concentra-tion of solid particles of a P2D model using a second degree polynomial and improved the
speed of calculation with an accuracy comparable to the P2D model. Dao et al. [5] and
Bizeray et al. [6] modelled the basic electrochemistry inside the battery using mathematical simplification and reduction methods to improve the computational speed. These models
enable a computationally fast solution of the problem, leading to an accurate estimation
5
of battery parameters, which is extremely useful in battery monitoring systems. However,
these mathematical methods are not accurate enough to predict the capacity fade coupled
with thermal effects in a battery during multiple charge-discharge cycles.
Capacity fade modelling is very important for an accurate prediction of charge-discharge
profiles in rechargeable battery RUL prediction. It has been observed that side reactions
10
and degradation process in lithium-ion batteries may cause a number of undesirable effects,
leading to capacity loss and the growth of the solid electrolyte interface (SEI) layer, which
are normally salt degradation products of electrolyte and electrodes [7, 8]. The loss of
lithium ions contributes to the thickening of the SEI layer at the negative electrode, initially
protecting the electrode against large voltage but eventually degrading the capacity. The
15
actual process of capacity fade happens over hundreds of cycles while some batteries exhibit
rapid degradation, strongly influenced by adverse operating conditions.
A detailed solvent diffusion model was proposed by Ploehn at al. [8] to evaluate the
growth of the SEI layer in carbon anodes. Later, Ramadass et al. [9] developed a first
principle based model to calculate the capacity fade effect by considering a continuous
sol-20
vent reduction side reaction. Recently, Pinson and Bazant [10] showed that simple time
dependent models were capable of predicting the capacity fade in electro-chemical batteries.
The accuracy of these models depends on the numerical schemes and the calculation of heat
generation inside the battery. Further improvement has been made to the battery modelling
by Randall et al. [11] and by Tanim and Rahn [12].
25
An accurate thermal prediction is required to calculate capacity fade, since high heat
generation is the main reason for accelerated capacity and power fade leading to
which enhances the battery life. Most of early thermal prediction studies were based on
the lumped parameter approach, representing a battery as a large thermal mass without
considering internal thermal conductivity [13]. Later, Wu et al. [14] extended the study of Smith and Wang [13] for a battery pack with interconnected resistance focusing on the load
imbalance generated in automobile applications. In the lumped model, thermal properties
5
are averaged, which reduces the accuracy of thermal prediction.
A distributed thermal model provides high accuracy thermal predictions at a high
com-putational cost. One of the important attempts was made by Cai and White [15], extending
the P2D model to include the thermal effect using COMSOL software. Attempts were made
to improve the accuracy of distributed thermal model by extending it to multi-dimensions
10
and length scales with the help of a reduced order model to limit the computational cost
[16]. Ye et al. [17] experimentally determined accurate thermal modelling parameters and
used it in simulation, and their results showed good agreement with test data.
Another notable study from our group on lithium-ion polymer battery was by Chacko and
Chung [18] on thermal behaviour of cell during the combination of charge and discharge effect,
15
using a three-dimensional fully coupled electro-chemical model. There is an experimental
effort by Barai et al. [19] to characterise Li-ion batteries. Also other major contributions are by Yi et al. [20] and Kim et al. [21].
All the above studies point to the necessity of capturing three different effects such as
electro-chemical reaction [13], capacity fade or power fade leading to ageing [9], and thermal
20
effects that governs temperature distribution [15]. A strong and computationally fast battery
life monitoring system also needs an accurate and fast numerical scheme or algorithm for
solving the governing equations. Variable porosity also needs to be given due importance
above the three factors to accurately calculate the available specific area which directly
affects the system of equations [22].
25
The present study predicts the basic electro chemistry inside the battery using a pseudo
two-dimensional (P2D) model. This study also takes into account the heat generation inside
variable porosity model is introduced by linking the reactions with the partial molar volume.
Hence this electro-chemical model is an attempt to capture the electro-chemistry, capacity
fade, and its coupled effects with temperature. The implementation of a computationally fast
and robust algorithm makes this model suitable for BMS with high numerical accuracy. A
finite volume based discretisation is adopted due to the inherent advantage that the
bound-5
ary conditions can be applied non-invasively. An algorithm is proposed which sequentially
solves the governing equations using an implicit method for time dependent discretisation,
to evaluate the battery characteristics for multiple charge-discharge cycles.
2. Battery Model
A Li-ion battery has typically three major components, namely, current collectors, porous
10
electrodes and ionically conductive separator. This layout was first presented by Fuller et al. [23]. Later this modelling layout was widely adopted [13, 9, 15]. The negative composite
electrode is made of active material of LiC6 and the positive electrodes is made of metal
oxide active material such as LiMO2. The electrolyte is made of organic solvents or lithium
salts such as LiPF6 which promotes the ionic diffusion process. The P2D model assumes
15
that the electrodes can be represented by the lattice of spherical particles of identical size.
The surface concentration of each spherical particle is used to determine stoichiometry for
calculating the open circuit potential (OCV).
During the discharge process, positive lithium ions from the negative electrode diffuse
towards the positive electrode. The reverse electrochemical process occurs during the charge
20
process, and the SEI layer consumes some of these lithium ions at the negative electrode
leading to the thickening of the layer.
2.1. Governing equations
All governing equations and boundary conditions used in this study are given in this
section. The basic electro-chemical battery model is based on Smith and Wang [13]. The
25
capacity fade model is based on Ramadass et al. [9]. The distributed thermal model energy
distributed model thermal properties are taken from the experimental work of Maleki et al.[24]. The porosity change is directly linked to the partial molar concentration following Sikha et al. [22]. A graphical illustration of the present model is presented in Figure 1a, and all parameters used are shown in Table 1.
2.1.1. Li+ ions in the electrolyte phase
5
Conservation of Li in the electrolyte phase relates the time variation of Li-ion with
its diffusion in the electrolyte. The electrolyte phase Li concentration, ce, is given by the
following equation.
∂
∂t(εece) =∇ ·(De,ef f∇ce) +
1−t+
F (J1+Js). (1)
The effective diffusion coefficient is evaluated by De,ef f =DeεPe, where P is the Bruggeman
porosity exponent. Li-ion cannot diffuse through the current collectors. Thus the boundary
condition at the two ends of battery is given by:
∂ce ∂x x=0
= 0, ∂ce ∂x
x=L
= 0.
2.1.2. Li+ ions in the solid phase
Conservation of Li in the solid phase is described by Fick’s law of diffusion. The solid
10
phase Li concentration, cs, is a function of its axial position x and its radial positionr; i.e.
cs(x, r, t).
∂ ∂tcs=
Ds
r2
∂ ∂r
r2 ∂ ∂rcs
. (2)
At the sphere surface,
−Ds
∂cs ∂r
r=Λs
= J1
asF
.
At the centre of spherical particle, the concentration gradient is set to zero.
a)
b)
[image:8.612.116.500.72.619.2]2.1.3. Solid phase potential
The solid phase potential, φs, is directly proportional to the reaction current density
according to Ohm’s law.
∇ ·(σef f∇φs) = (J1+Js). (3)
The charge or discharge current is carried by the solid porous material at both electrodes.
The reaction current density at the first node (near both current collectors) is made equal to
the charge or discharge current density, and the solid potential is evaluated accordingly. At
the electrode separator interface, there is no flux of charge, and the zero gradient boundary
condition is applied.
σef f
∂φs ∂x x=0
=σef f
∂φs ∂x
x=L
=−Iapp
A , ∂φs ∂x
x=δ−
= ∂φs ∂x
x=δ+
= 0.
2.1.4. Electrolyte phase potential
The electrolyte phase potential, φe, is evaluated as a function of the reaction current
5
density (J) and the concentration of lithium (ce) :
∇ ·(κef f∇φe) +∇ ·(κD,ef f∇ln(ce)) +J1+Js = 0. (4)
The effective ionic conductivity,κef f, is calculated from the Bruggeman relationκef f =κεPe.
Using the concentrated solution theory, the effective diffusion conductivity, κD,ef f, is given:
κD,ef f =
2RT κef f
F t
+−
1
1 + dlnf
±
dlnce
.
The zero gradient boundary condition is applied at the current collector electrode interface.
∂φe ∂x x=0
= 0, ∂φe
∂x
x=L
2.1.5. Equation for variable porosity
The governing equation for variable porosity can be derived from overall material balance.
The electrolyte phase porosity is related to the partial molar concentration and the current
density: [22].
∂εe
∂t =as(J1VLi+ +JsVLac). (5)
The inter-facial surface area to volume ratio for a particle with radius Λs is calculated by
5
the following equation [13].
as = 3εs/Λs. (6)
Please note that the change in radius of the spherical particle due to the porosity change is
not considered in this model.
2.1.6. Intercalation and solvent reduction reaction current density
All the above equations; lithium in electrolyte (equation 1), lithium in solid phase
(equa-10
tion 2), solid potential (equation 3), electrolyte potential (equation 4) are coupled together
by the Butler-Volmer equation [2].
J1 =asio
exp
αnF η
RT
−exp
−αpF η
RT
, (7)
where io is the exchange current density which is proportional to the solid state lithium
concentration (cs) and electrolyte lithium concentration (ce). The solid concentration is
taken from the surface of a spherical particle (the outermost control volume).
15
io =kct(cmaxs −c sur s )
αncαp
s c αn
s , (8)
where kct is the kinetic rate constant, adjusted in such a way to match the initial current
density of 3.6×10⁻³Acm−2 at the negative electrode and 2.6×10⁻³Acm−2 at the positive
electrode.
In the present model, the SEI layer forms a uniform coating over the solid particle
during charge and the thickness of the SEI layer remains unchanged during discharge. In
this study, the capacity fading is assumed to occur due to the continuous solvent reduction
side reaction, and other phenomena such as graphite cracking, gas generation electrolyte
decomposition, SEI precipitation, dendrite growth and lithium plating are not included in
this study [25, 26, 27].
The solvent reduction reaction kinetics is similar to the intercalation reaction and can
be represented by a similar expression:
Js =asios
cp
c∗ p
e(αaf ηs)−
cs
c∗ s
cLi+
c∗Li+
e(αcf ηs)
.
The above equation can be reduced to a much simpler form using the cathodic Tafel
approx-5
imation [9] by considering the reaction irreversible.
Js =−aniose(−αcf ηs). (9)
This equation assumes that the SEI layer adds resistance to the negative electrode, while
the SEI layer does not affect the positive electrode overpotential. The resistance due to SEI
layer increases during charge while it remains constant during discharge [9].
The empirical correlation for OCV at the negative and positive electrodes is taken from
Smith and Wang [13]. Over potential positive electrode:
ηp =φs−φe−Up.
Over potential negative electrode:
ηn=φs−φe−Un−J
Gf ilm
an
.
The overpotential for side reaction is defined as:
ηs=φs−φe−Uref −J
Gf ilm
an
The reference voltage, Uref, is taken as zero in all calculations.
The battery is assumed to start with the initial resistance, ΩSEI. The resistance of
the SEI layer is estimated by the conductivity values available in literature [9]. The SEI
layer thickness keeps increasing over charge cycles and the overall resistance at any cycle is
calculated as
Gf ilm = ΩSEI +
δf ilm
κp
.
The rate of SEI layer increase over a particular cycle is proportional to the solvent reduction
reaction current density.
∂
∂tδf ilm =− JsMp
anρpF
.
For each cycle the thickness increases over time according to
δf ilm
N
=δf ilm
N−1
+δf ilm(t). (10)
2.1.7. Thermal modelling
The energy balance for the battery heat generation is given by: [15]
ρCp
∂T ∂t =λ
∂2T
∂x2 +Qreact+Qrev+Qohm. (11)
where Qreact is the heat generation due to reaction inside the battery, Qrev is the reversible
5
heat generation and Qohm is the Ohmic heat generation rate. Each term in equation 11 is
defined as follows:
Qreact = J(φs−φe−U),
Qrev = T J
∂U
∂T, (12)
Qohm = σef f
∂φs
∂x
+κef f
∂φe
∂x 2
+2κef fRT
F (1−t
0 +)
∂lnce ∂x
∂φe
Total heat generated inside the battery is convected to the ambient.
−λ∂T ∂x x=0
=h(Tamb−T),
−λ∂T ∂x
x=L
=h(T −Tamb).
2.1.8. Temperature dependency of properties
All the battery properties are temperature dependent, and change in temperature will
affect the physiochemical property ψ following the Arrhenius correction [13].
ψ =ψrefexp
" Eactψ
R 1 Tref − 1 T #
The reference temperature is Tref = 298.15 K and the activation energy (Eact) for each
parameter is given in Table 2.
2.2. Solution method and flow chart 5
The governing equations are discretised using a finite volume method with a collocated
approach of all electro-chemical variables defined at the control volume centre. The equations
are solved in a sequential way. A fully implicit method is used in this formulation. All
simulation parameters were chosen from preliminary simulations. A grid independency test
was carried out to decide the number of grid points. The present model uses 20 control
10
volumes at the negative electrode, 15 at the separator, and 25 at the positive electrode.
Each solid spherical particle is again divided radially into 25 control volumes. A time step
size of one second is used. The current densities for the main reaction and solvent reduction
reaction are calculated at each time step. The solution algorithm is explained in Figure
1b. Inner iterations are provided to enhance coupling between equations. Proper
under-15
relaxation is employed for the system of equations. The governing equations for electrolyte
concentration (equation 1), solid potential (equation 3) and electrolyte potential (equation
4) are solved at the nodal point corresponding to the centre of the control volume, while the
Negative Separator Positive
Electrode Electrode
Parameters for Base Battery Model, Smith and Wang (2006)
Thickness,δ 50×10−4 25.4×10⁻⁴ 36.4×10⁻⁴
Particle radius, Λs 1×10⁻⁴ 1×10⁻⁴
Active material volume fraction εs 0.580 0.500
Electrolyte phase volume fraction εe 0.332 0.5 0.330
Maximum solid phase concentration cmaxs 16.1×10⁻³ 23.9×10⁻³
Stoichiometry at 0% SOC 0.126 0.936
Stoichiometry at 100% SOC 0.676 0.442
Average electrolyte concentrationce 1.2×10⁻³ 1.2×10⁻³ 1.2×10⁻³
Exchange current density (io) 3.6×10⁻³ 2.6×10⁻³
Charge-transfer coefficients αa,αc 0.5, 0.5 0.5, 0.5
SEI layer film resistance, ΩSEI 1 100 100
Solid phase Li diffusion coefficient, Ds 2.0×10⁻¹² 3.7×10⁻¹²
Solid phase conductivity, σ 1.0 0.1
Electrolyte phaseLi+ diffusion coefficient, D
e 2.6×10⁻⁶ 2.6×10⁻⁶ 2.6×10⁻⁶
Bruggeman porosity exponent, p 1.5 1.5 1.5
Electrolyte activity coefficient, f± 1.0 1.0 1.0
Li+ transference number, t0
+ 0.363 0.363 0.363
Parameters for solvent reduction side reaction, Ramadass et al. (2004)
Reference voltage Uref 1 0 0
Molecular weight Mp 7.3×10⁴
Density of SEI Layerρp 2.1×10⁻³
Side reaction exchange current density ios 1 1.5×10⁻¹²
Conductivity of SEI Layerκp 1 1×10⁻⁴
Parameters for thermal model, Maleki et al. (1999) & Wu et al. (2013)
Density of electrolyteρe 1123.0×106 1123.0×106 1123.0×106
Density of solid phaseρs 1347.3×106 2328.5×106
Electrolyte thermal Conductivityλe 3.39×10⁻² 3.39×10⁻² 3.39×10⁻²
Solid phase thermal conductivityλs 3.39×10⁻² 3.39×10⁻²
Heat capacityCp 1437.4 1978.2 1669.2
Electrolyte heat capacity 2055.1
Parameters for variable porosity, Sikha et al. (2004)
Partial molar volume for main reaction VLi+ 13.0
[image:14.612.89.516.138.372.2]Partial molar volume for side reaction VLac 64.39
Negative Separator Positive
Electrode Electrode
Exchange current densities, Ei0−,Ei0+ 3×10⁴ 3×10⁴
Solid phase diffusion coefficient , EDs−
act ,E Ds+
act 4×10⁴ 2×10⁴
Electrolyte phase diffusion coefficient , EDe
act 1×10⁴ 1×10⁴ 1×10⁴
Electrolyte phase conductivity , Eκ
[image:15.612.88.528.73.175.2]act 2×10⁴ 2×10⁴ 2×10⁴
Table 2: Activation energies for the Arrhenius correction [13]
VLi+ VLac First cycle charging time(s)
Constant porosity 0.0 0.0 64.77
Variable porosity 13.0 64.39 59.61
Variable porosity 40.0 64.39 50.15
Accelerated porosity 13.0 100.0 59.61
Table 3: Assumed partial molar concentration of the electrolyte LiPF6
The battery is started from the 100% depth of discharge (DoD) condition and charged
until the upper cut-off voltage (UCV) is reached. The UCV is taken as 4.0 V in all simulations
except the validation study, where 3.9V is used. It has been observed that the SEI layer
grows at a much faster rate for overcharging conditions. Hence the UCV is kept at a slightly
overcharged condition of 4.0V in this study to accelerate the SEI layer growth. The discharge
5
simulation starts by reversing the applied current until the lower cut-off voltage (LCV) is
reached. The LCV is taken as 3.3V in all simulations except the validation study, where
3.29V is used. The DoD is measured with stoichiometry of the positive electrode. However,
the negative stoichiometry also shows excellent agreement with values presented in Table 1
at 0% and 100% DoD. This process describes one complete cycle of battery operation. The
10
sign convention applied in this paper is that a positive current discharges the battery. The
reaction current density at the negative electrode during discharge is taken as positive.
Battery operating parameters such as voltage and temperature are calculated at the end
of each time step. Both voltage and temperature can be completely decoupled from the
main electro-chemical governing equations and are not incorporated inside the main loop.
15
[image:15.612.156.457.210.298.2]a) b)
[image:16.612.83.534.67.473.2]c)
Figure 2: Model validation. a) Electro-chemical model validation with Smith & Wang (2006), b) capacity fade model comparison with Ramadasset al. (2004), and c) thermal model comparison with Cai & White (2011).
a coupled way until the residual error reduces below a threshold value. The convergence
criteria for current densities on both electrodes are 10−3 A/cm3.
2.3. Validation study
A through evaluation was provided in this study for the electro-chemical model, capacity
fade model and thermal model, separately. A validation study was performed to compare the
5
base electro-chemical model [13]. The cell is charged from 100% DoD up to the UCV, and
the discharge simulation starts from 0% DoD until the LCV. A sharp decrease in discharge
near 80% DoD is due to the low diffusion of ions in the solid phase. Between 20% DoD and
80% DoD, it exhibits a balance between the Li+ ions liberated from the negative electrode
and the ions consumed at the positive electrode. The characteristics shown in Figure 2a are
5
in excellent agreement with Smith & Wang [13].
The capacity fade model results are compared with Ramadasset al. [28]. It is observed
that the cell negative electrode resistance increases with cycling, resulting in a sudden change
in voltage at the beginning of charge and discharge. Figure 2b presents the voltage drop
(∆V) plotted against the non dimensional cycle time. The voltage drop is measured as
10
the difference between the UCV and the available voltage after charge-discharge cycle. The
non-dimesional time is calculated based on the first cycle time assuming that the first cycle
is free from all parasitic side reactions. The results show an excellent agreement with the
trends observed in Ramadass et al. [28].
The thermal model results are compared with Cai and White [15]. Figure 2c shows
15
the variation of heat transfer coefficient with non-dimensional temperature on the battery
surface. The control volumes near the current collector represent the surface temperature of
the battery. The temperature increase (∆T) is calculated based on the ambient temperature.
The non-dimensional temperature is defined asT∗ = Tmax−Tamb
Tamb . The temperature is observed
to rise to a higher value at the beginning of charge and discharge and then it reaches an
20
equilibrium with the ambient condition. The trend presented in Figure 2c shows an excellent
agreement with Cai and White [15].
3. Results and Discussion
3.1. Effect of variable porosity on battery performance
This section analyses the dependency of variable porosity on the battery performance.
25
The variable porosity equation links the battery performance with electrolyte properties.
a) b)
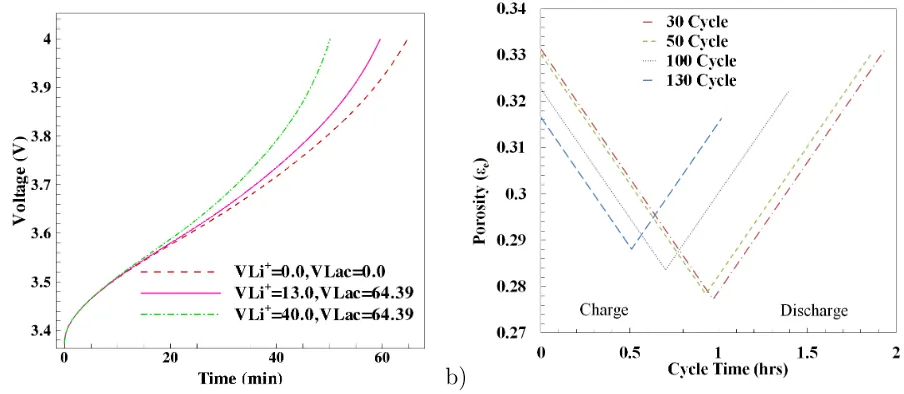
Figure 3: Variable porosity studies for 1C (6A-CC) charge and discharge. a) Battery charging performance comparison with different molar volume, and b) variation of porosity for VLi+ = 13.0 and VLac = 64.39
showing irreversible filling due to solvent reduction side reaction.
reaction (VLi+ and VLac) on charging performance of the battery. Please note that these
simulations are performed with an isothermal condition (298.15K), removing the effect of
any thermal expansion on porosity change. Figure 3a shows a comparison of variable porosity
cases. The case with VLi+ = 0 andVLac= 0 corresponds to the constant porosity condition.
The intercalation molar volumes (VLi+) varied from 13 to 40, while keeping the constant
5
partial molar concentration for the parasitic reaction at VLac = 64.39 (see table 3).
The case with zero partial molar concentrations results in no porosity change and hence
the available area for reaction remains constant, resulting in longer cell operating time. In
this case, the charging time extends up to 65 minutes and the capacity of the battery is
the highest compared to the other two cases. The case with a higher VLi+ shows a faster
10
decrease in porosity, subsequently reducing the specific interfacial surface area available for
reaction. A lower specific interfacial surface area as also decreases the current density of
the intercalation reaction (equation 7) and solvent reduction reaction (equation 9). With
VLi+ = 40, the cell charging is limited to 50 minutes of operation and the cell capacity reduces
for both charging and discharging operations. The decrease in current density also affects
15
overall chemical reaction, reducing the solid phase (φs) and electrolyte phase (φe) potentials.
Figure 3b quantifies the irreversible filling of pores in the negative electrode. This figure
shows the variation in porosity at the negative electrode and current collector interface over
a period of 30 to 130 charge-discharge cycles. The case for VLi+ = 13 and VLac = 100 is
used to keep the large irreversible change in porosity. The initial electrolyte porosity at the
5
negative electrode is taken as εe = 0.332 (Table 1) and after 130 cycles of operation the
porosity reduces to εe = 0.315. This irreversible filling effect can be explained as follows.
The variable porosity contributions are from the intercalation reaction and solvent
re-duction side reaction. The porosity variation in a lithium ion battery is proportional to
the product of current density and partial molar volumes (equation 5). The porosity
con-10
tribution from intercalation reaction is usually ignored in capacity fade study since this is
completely reversible, whereas the solvent reduction side reactions are not. The change in
porosity due to charge cycle is cancelled out in the subsequent discharge cycle in case of
an intercalation reaction. There is irreversible filling in the negative electrode due to the
solvent reduction side reaction which is activated only in the charge cycle and absent in
15
the discharge cycle. The porosity variation in the positive electrode is reversible since the
electrode is free from the side reaction. Hence this variable porosity model is able to capture
the irreversible plugging of pores with the solvent reduction side reaction which is one of the
main causes of accelerated capacity fade during cycling.
The combined effect of the change in porosity and the SEI layer growth is responsible
20
for the capacity fade in a battery. The porosity variation limits the available area and fills
the pores irreversibly as shown in figure 3b. These changes are negligible during early cycles
of operation and the battery behaves almost like a new battery. This observation was made
for SONY 18650 battery, operating under similar conditions and experimentally tested by
Ramadass et al. [28]. In this study, the partial molar concentration is set to be VLi+ = 13
25
for the intercalation reaction and VLac = 64.39 for the side reactions to limit the battery
a) b)
Figure 4: Thermal performance of the battery under 1C (6A CC)cyclic loading. a) Battery thermal perfor-mance inclusive of all sub models, and b) effect of individual sub models on battery thermal perforperfor-mance.
3.2. Effect of temperature on battery performance
Figure 4a shows the temperature variation for the first few cycles, plotted at the battery
surface with different heat transfer coefficients. The node temperature corresponding to
both electrode current collector interfaces, is taken as the surface temperature. This figure
presents the temperature variation of the battery including the effects of capacity fading,
5
variable porosity and the Arrhenius correction. The heat generation inside the battery has
main contributions from Ohmic heat generation Qohm and reaction heat generation Qreact,
and comparatively less from reversible heat Qrev (see equation 13). The ohmic heat Qohm
is due to the limited internal conductivity and this term accounts for the ohmic heat in the
solid phase as well as the electrolyte phase [13]. There is a sharp increase in temperature
10
during the initial phase of the charge cycle and subsequently the battery reaches a balance
between the internal heat generation and the heat convected outside. There is a small
decrease in temperature when the battery changes from a charge cycle to a discharge cycle.
This is visible in all different heat transfer cases presented in Figure 4a, and could be due
to comparatively reduced contribution of the internal heat generation (Qohm and Qreact) at
15
transfer coefficient is nearly 5 W/m2K and temperature of the battery remains at 305K, well
below the runaway temperature. An increase in battery temperature can be observed with
a decrease in convective heat transfer coefficient.
Figure 4b shows the effect of various sub models on the battery thermal performance.
The variable porosity model does not affect the overall surface temperature of the battery
5
significantly. This could be due to the fact that the overpotential (η) remains almost
unaf-fected and mainly contributes to the ohmic heat generation (Qohm) and the reaction heat
generation (Qreact). Also, the capacity fade solvent reduction side reaction does not have
much influence on the temperature profile during the initial cycles of operation. The
con-tribution of the solvent reduction reaction current density is much smaller than that of the
10
intercalation current density, and its influence on the reaction heat generation (Qreact) and
the reversible heat generation (Qrev) is negligible. Also the side reaction has no significant
influence on the solid phase potential (φs) and the electrolyte phase potential (φe) at the
start of a battery. The thermal contribution of the solvent reduction reaction changes after
the SEI layer becomes thick. A high temperature accelerates the capacity fade in a battery
15
and causes the cell to fail at an early stage compared to a properly cooled battery. This
effect is captured in the following figure by analysing the rate of the SEI layer growth with
different heat transfer coefficients.
It is interesting to note that the Arrehenius correction plays a significant role in deciding
the performance of a battery by influencing the physiochemical variablesψ. The solid phase
20
diffusion coefficient and exchange current density affect the charge transfer resistance, thus
enabling the lithium to diffuse through the solid phase at a much faster rate and improving
the performance of a battery with a temperature increase [14].
Figure 5 shows the battery life with different heat transfer coefficients. For h = 0.9
W/m2K, the battery operates at a comparatively high temperature of 357K and the battery
25
life is short and the rate of the SEI layer growth is high. The battery operating time is
measured as the time up to the breakdown point where the current flux balance is no longer
a) b)
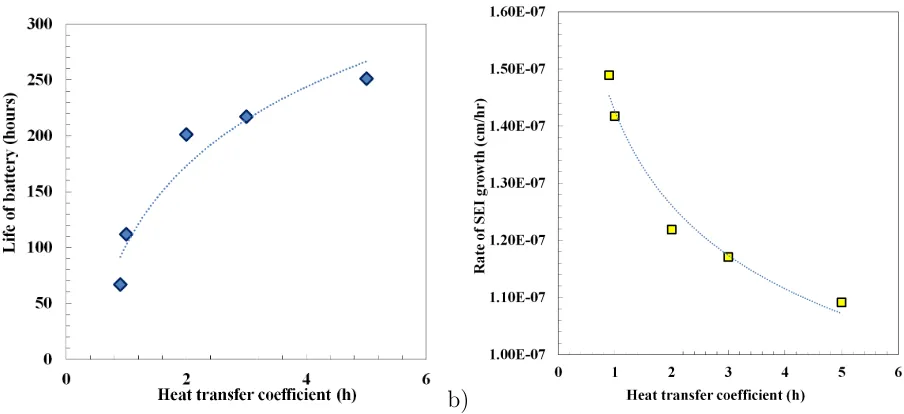
Figure 5: Dependency of heat transfer coefficient on 1C (6A-CC) charging and discharging. a) Operating time of battery with different heat transfer coefficient, and b) rate of SEI growth with different heat transfer coefficient.
W/m2K the rate of the SEI layer growth is low and the battery operates for more than 250
hours. The higher the heat transfer coefficient is, the lower the rate of the SEI layer growth
is and the longer a battery operates.
As shown in Figure 5a, the battery operating temperature is inversely proportional to the
heat transfer coefficient. High temperature influences the battery electrolyte and solid phase
5
diffusivity and changes the exchange current density considerably. The important parameter
is the diffusivity (De) of lithium through electrolyte and the SEI layer which is linked to the
operating temperature by the Arrhenius expression. Also the temperature has an indirect
effect on the SEI layer growth through the solid potential (φs) and electrolyte potential
(φe) and hence the overpotential for the solvent reduction reaction (ηs). Increasing the
10
heat transfer coefficient from h= 0.9W/m2K to 2 W/m2K results in a major improvement,
whereas increasing the heat transfer coefficient from h = 3W/m2K to 5 W/m2K gives a
modest improvement. The h = 5 W/m2K case is very close to the iso-thermal condition
where the heat transfer coefficient is infinite. In this condition, the battery life is determined
by the SEI layer growth due to cycling. Other capacity fade mechanisms which are not
included in this study are explained in Xu [27].
The rate of the SEI layer growth can be approximated by the following correlation for a
given set of modelling parameters
dδf ilm
dt = 1.0×10
−7h−0.177.
The life of battery follows the following correlation
thours= 102 lnh+ 102.4
These correlations provide an estimate of the dependency of capacity fading parameters
and could be useful for designing a cooling system to enhance the battery life. Smith et
al. [29] shows that at a lower battery temperature, ageing occurs at a much slower rate
compared to a higher temperature. The observed temperature dependency shows that high
5
temperature increases the rate of capacity fade and can contribute to accelerated ageing. The
capacity fade of a battery is also dominated by the diffusivity of multiple species through
the SEI layer. Capacity fade can be reduced by limiting products with high diffusivity [10].
This is captured in the present model using conductivity of electrolyte (κ) through the SEI
layer. Most of these effects can be controlled by adjusting κ values.
10
3.3. Effect of capacity fade on battery performance
Figure 6 shows the cyclic operation of a battery at different operating times. The solid
line shows the profile with the capacity fading effect while the dotted line shows without
the capacity fading effect. This analysis is conducted with constant porosity under an
iso-thermal condition. The exchange current density for solvent reduction reaction and other
15
parameters are summarised in Table 1. For the first few hours of operation as shown in
Figure 6a, the profiles show an almost identical trend, and the internal resistance of the cell
is almost the same as the initial SEI layer resistance of ΩSEI = 100 Ωcm2. The SEI layer
starts growing over the subsequent charge cycles and it becomes significant after multiple
cycles of operation. The loss of active material contributes to a decrease in battery capacity
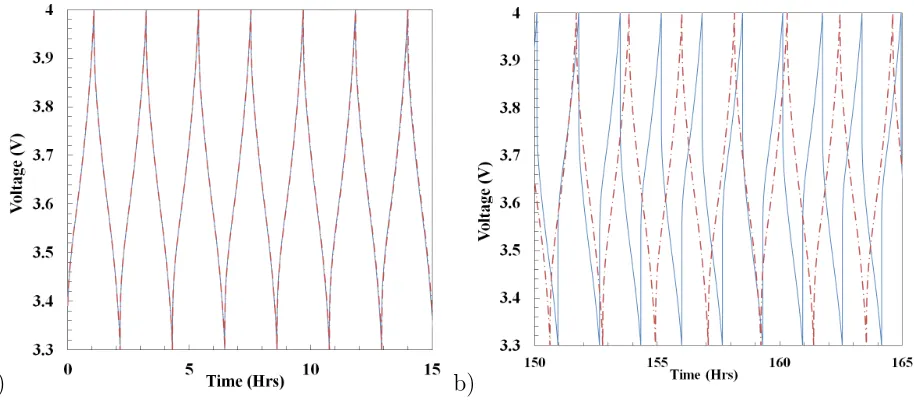
a) b)
Figure 6: Battery operation with and without capacity fading effect. a) Voltage profile for the first 15 hours of operation, and b) voltage profile after 150 hours of operation.
over cycles. In this study, the solvent reduction reaction exchange current density (ios) is
found to be a significant parameter influencing the cell capacity fade and overall performance.
The value ofios is chosen to be high so that the cell capacity reduces to less than a half after
100 cycles of operation. For all other analysis, ios = 1.5×10⁻¹² is used unless otherwise
specified.
5
Figure 6b shows the cycle operation of cell after 150 hours of operation with a significant
SEI layer built up. The charge and discharge cycle becomes much shorter with the capacity
fade model. There is certainly a phase difference for cases with capacity fade while comparing
with cases without capacity fade. This phase shift is absent at the beginning of battery
operation and increases gradually. The internal resistance causes a cycle time reduction and
10
affects the battery operating parameters and current density. Due to the SEI Layer built up,
the externally applied voltage has to reach a certain value to overcome the internal resistance
to continue the charging operation. A similar effect can be observed at the beginning of the
discharge cycle where the available voltage is lost to overcome the internal resistance.
The important variables affecting the battery capacity are the LCV (or end-of-charging
15
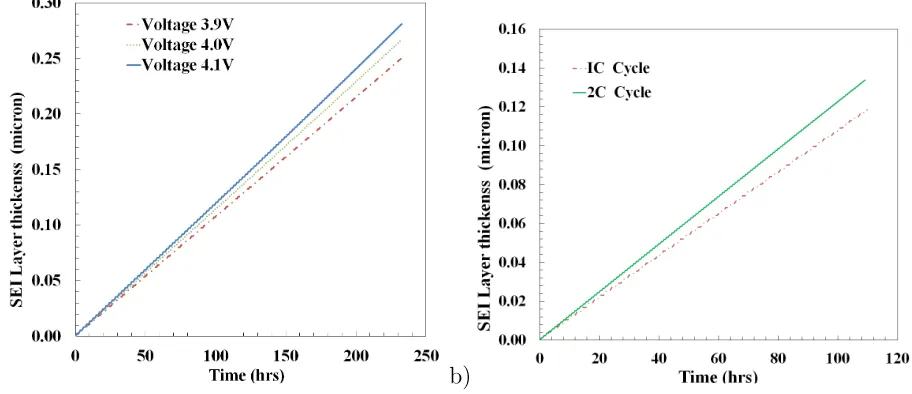
a) b)
Figure 7: Cell operating characteristics with different operating conditions. a) SEI growth with different UCV, and b) SEI growth with different C-rates.
is subjected to different overcharging conditions with three UCV values of 3.9V, 4.0V and
4.1V. The SEI layer growth is observed and the voltage profile is analysed in each case.
Due to the safety concerns, manufacturers do not recommend for charging above the UCV.
Figure 7a shows that even a slight overcharging of 0.1V accelerates the SEI layer growth.
In a similar study, Ramadass et al. observed that increasing the UCV by 0.1V reduced the
5
battery life by 60% [9]. The lower the UCV is, the shorter the time takes to reach the UCV.
The time taken to reach 3.9V is shortest among the three cases. The maximum rate of the
SEI layer growth is observed for 4.1V. This is due to the change in overpotential for the
side reaction (ηn) which affects the SEI layer growth for different cut off voltages. At UCV
limits, the overpotential for the solvent reduction side reaction becomes large compared to
10
the normal operating conditions, causing the dominance ofanios term in equation 9. During
the normal operating conditions, the side reaction current density is much smaller compared
toanios due to the dominance of exp(−αcf ηs). So, the capacity loss increases by increasing the
cut off potentials, and it accelerates the SEI layer growth compared to the normal operating
conditions. A similar capacity fade effect can be observed for lower LCV values.
15
a) b)
[image:26.612.76.537.75.470.2]c)
Figure 8: Cell performance after multiple charge-discharge cycles. a) Solvent reduction current density at negative current collector interface, b) voltage profiles with differentiosvalues after 30 cycles, and c) voltage
profiles with differentκp values after 30 cycles.
changes with C-rate, and high current charging and discharging accelerates the SEI layer
growth. The high charge/discharge rate increases the current density in a battery which is
directly proportional to the side reaction overpotential (ηn) and the SEI layer growth (δ).
Figure 8a shows variations in solvent reduction current density at the negative electrode
current collector interface. During the first charge cycle the current density variation extends
5
to a large range. After 130 cycles of charge/discharge, the range of variation diminishes to less
term for the solvent reduction reaction ηn = φs −φe−Un −(J1 +Js) Gf ilm
an is dominated
by the contribution from the side eaction current and the film resistance. The exponential
term in Js = −aniose(−αcf ηs) becomes very small due to a high value of overpotential, and
the variation in side reaction current density is limited to a smaller range. This shows that
after a sufficient build up of internal resistance, the solvent reduction reaction is mainly
5
dominated by the combined contributions from an and ios. The same effect can be seen
while the battery is kept idle, without being connected to the external load. Thusηsreduces
to zero and the non-operating time SEI growth is governed by the exchange current density
and specific area. Hence this model is capable of predicting the idle time SEI layer growth of
battery. Combining this capacity fade model with the variable porosity model can accurately
10
predict the idle and non-idle time SEI growth because the porosity model can calculate the
specific area accurately.
Figure 8b shows the cell performance after 30 cycles of operation with different values of
side reaction exchange current density (ios) for capacity fade. Different values ofios are used
in this study to analyse the effect of capacity fade. It is important to find the correct ios
15
value for accurate capacity fade modelling. The ios value remains constant throughout the
simulation and cannot be modified at the start of each cycle. Increasing ios accelerates the
side reaction, hence reducing the cell life significantly. The case of ios = 1.5×10⁻¹¹ shows
that the cell life reduces below 45 minutes after 30 cycles of operation.
Figure 8c shows the cell performance with different values of SEI layer conductivity (κp).
20
This conductive layer is formed over the solid spherical particles due to solvent reduction side
reaction which appears as a coating, preventing solid particles from further reaction. For
κp = 1.0×10⁻³ S/cm, the battery operates for 65 minutes whereas the battery capacity is
slightly reduced forκp = 1.0×10⁻⁴ S/cm. Case ofκp = 1.0×10⁻⁵ S/cm shows a significant
reduction in the capacity compared to other cases where the battery operates only for 42
25
minutes under a similar operating condition. Thus less conductive products formed during
the side reaction reduce the battery life significantly. There is a threshold value forκp, below
value of ios and κp for the capacity fade analysis of the Li-ion battery. Appropriate values
of ios and κp depend mainly on the choice of electrolyte.
4. Conclusion
Capacity fade of lithium-ion batteries under cyclic loading conditions has been modelled.
The capacity fade modelling considers the thickness of the SEI layer formed over the solid
5
particle in the negative electrode during charge. An electro-chemical model is demonstrated
to capture most of the significant electro-chemical effects inside the battery under cyclic
charge and discharge conditions. The operating characteristics and the battery life are
gov-erned by electro-chemical reactions including the capacity fading, thermal effects and active
surface area of the electrode. Sensitivity studies are performed to identify the important
10
parameters affecting the battery life. It is found that multiple factors affect the performance
and the battery life, most of which are interlinked. The SEI layer forms the irreversible
coat-ing preventcoat-ing the chemical reaction. This is captured by linkcoat-ing the model to the partial
molar concentration. This is again linked with the operating temperature which is a function
of the convective heat transfer coefficient. The model can be used as an optimisation tool
15
to enhance the performance and the battery life under various operating conditions. This
model enables the operator to choose a safe operating limit for the battery while minimising
the SEI layer growth.
5. Acknowledgement
This work was funded by an EPSRC project titled Battery Characterisation and
Manage-20
ment - the key to Smart Grids and the Integration of Electric Vehicles (Grant EP/L001004/1).
The simulations were performed on the HPC machines at the Centre for Scientific
Comput-ing, University of Warwick. The authors thank Dr S. Santhanagopalan, National Renewable
Nomenclature
a active surface area per electrode unit volume (cm−1 )
A Electrode plate area (cm2)
c Volume-averaged concentration (mol cm−3)
Cp Specific heat (J kg−1K−1)
D Diffusion coefficient (cm2s−1)
E Activation energy (J mol−1)
F Faradays constant, 96,487 C mol−1
G Resistance (Ω cm2)
h Convective heat transfer coefficient (W m2K−1)
io Exchange current density for intercalation reaction (A cm−2)
ios Exchange current density for solvent reduction reaction (A cm−2)
Iapp Applied current (A)
J1 Reaction current for intercalation reaction (A cm−3)
Js Reaction current for solvent reduction reaction (A cm−3)
kct Kinetic rate constant for intercalation reaction
L Cell width (cm)
Mp Molecular weight (kg mol−1)
Q Heat generation (W cm−3)
r Radial coordinate (cm)
R Universal gas constant, 8.3143 (J mol−1K−1)
t Time (s)
t0+ Transference number
T Absolute temperature (K)
U Open-circuit potential(V)
V Cell voltage (V)
V Partial molar volume (cm3mol−1)
w Stoichiometric ratios in positive and negative electrode
x Coordinate along the cell width (cm)
y,z Stoichiometric coefficient in chemical reaction
Greek Symbols
α Charge-transfer coefficient
δ Thickness (cm)
Volume fraction of domain
ρ Density (kg cm−3)
κ Conductivity of electrolyte (S cm−1)
κD Diffusivity (A cm−1)
κp Conductivity of SEI layer (S cm−1)
Λs Radius of particle (cm)
λ Thermal conductivity (W cm−1K−1)
σ Solid phase conductivity (S cm−1)
φ Volume averaged potential (V)
Superscript & subscript
amb Ambient condition
e Electrolyte phase
ef f Effective
f ilm SEI layer thickness
i Electrodes
max Maximum
n Negative electrode
N Cycle number
ohm Ohmic
p Positive electrode
ref Reference values
react Reaction
rev Reversible
s Solid phase of positive or negative electrode
sur Surface quantity
− To the left of an interface
List of Figures
1 a) Graphic illustration of the battery model during charge and discharge, and
b) flow chart for solution algorithm. . . 7
5
2 Model validation. a) Electro-chemical model validation with Smith & Wang
(2006), b) capacity fade model comparison with Ramadasset al. (2004), and
c) thermal model comparison with Cai & White (2011). . . 15
3 Variable porosity studies for 1C (6A-CC) charge and discharge. a) Battery
charging performance comparison with different molar volume, and b)
varia-10
tion of porosity for VLi+ = 13.0 and VLac = 64.39 showing irreversible filling
due to solvent reduction side reaction. . . 17
4 Thermal performance of the battery under 1C (6A CC)cyclic loading. a)
Battery thermal performance inclusive of all sub models, and b) effect of
individual sub models on battery thermal performance. . . 19
15
5 Dependency of heat transfer coefficient on 1C (6A-CC) charging and
discharg-ing. a) Operating time of battery with different heat transfer coefficient, and
b) rate of SEI growth with different heat transfer coefficient. . . 21
6 Battery operation with and without capacity fading effect. a) Voltage profile
for the first 15 hours of operation, and b) voltage profile after 150 hours of
20
operation. . . 23
7 Cell operating characteristics with different operating conditions. a) SEI
growth with different UCV, and b) SEI growth with different C-rates. . . 24
8 Cell performance after multiple charge-discharge cycles. a) Solvent reduction
current density at negative current collector interface, b) voltage profiles with
25
different ios values after 30 cycles, and c) voltage profiles with different κp
[1] M. Doyle, T. F. Fuller, J. Newman, Journal of the Electrochemical Society 140 (1993)
1526–1533.
[2] M. Doyle, J. Newman, Journal of Power Sources 54 (1995) 46–51.
5
[3] C. Wang, W. Gu, B. Liaw, Journal of the Electrochemical Society 145 (1998) 3407–3417.
[4] V. R. Subramanian, J. A. Ritter, R. E. White, Journal of The Electrochemical Society
148 (2001) E444–E449.
[5] T.-S. Dao, C. P. Vyasarayani, J. McPhee, Journal of Power Sources 198 (2012) 329–337.
[6] A. Bizeray, S. Duncan, D. Howey, et al., in: Hybrid and Electric Vehicles Conference
10
2013 (HEVC 2013), IET, IET, pp. 1–6.
[7] R. Spotnitz, Journal of Power Sources 113 (2003) 72–80.
[8] H. J. Ploehn, P. Ramadass, R. E. White, Journal of The Electrochemical Society 151
(2004) A456–A462.
[9] P. Ramadass, B. Haran, P. M. Gomadam, R. White, B. N. Popov, Journal of the
15
Electrochemical Society 151 (2004) A196–A203.
[10] M. B. Pinson, M. Z. Bazant, Journal of the Electrochemical Society 160 (2013) A243–
A250.
[11] A. V. Randall, R. D. Perkins, X. Zhang, G. L. Plett, Journal of Power Sources 209
(2012) 282–288.
20
[12] T. R. Tanim, C. D. Rahn, Journal of Power Sources 294 (2015) 239–247.
[13] K. Smith, C.-Y. Wang, Journal of Power Sources 160 (2006) 662–673.
[14] B. Wu, V. Yufit, M. Marinescu, G. J. Offer, R. F. Martinez-Botas, N. P. Brandon,
[15] L. Cai, R. E. White, Journal of Power Sources 196 (2011) 5985–5989.
[16] M. Guo, R. E. White, Journal of Power Sources 221 (2013) 334–344.
[17] Y. Ye, Y. Shi, N. Cai, J. Lee, X. He, Journal of Power Sources 199 (2012) 227–238.
5
[18] S. Chacko, Y. M. Chung, Journal of Power Sources 213 (2012) 296–303.
[19] A. Barai, K. Uddin, W. Widanalage, A. McGordon, P. Jennings, Journal of Power
Sources 303 (2016) 81–85.
[20] J. Yi, U. S. Kim, C. B. Shin, T. Han, S. Park, Journal of Power Sources 244 (2013)
143–148.
10
[21] U. S. Kim, C. B. Shin, S. M. Chung, S. T. Kim, B. W. Cho, Journal of Power Sources
190 (2009) 184–188.
[22] G. Sikha, B. N. Popov, R. E. White, Journal of The Electrochemical Society 151 (2004)
A1104–A1114.
[23] T. F. Fuller, M. Doyle, J. Newman, Journal of the Electrochemical Society 141 (1994)
15
1–10.
[24] H. Maleki, S. Al Hallaj, J. R. Selman, R. B. Dinwiddie, H. Wang, Journal of The
Electrochemical Society 146 (1999) 947–954.
[25] J. Vetter, P. Nov´ak, M. Wagner, C. Veit, K.-C. M¨oller, J. Besenhard, M. Winter,
M. Wohlfahrt-Mehrens, C. Vogler, A. Hammouche, Journal of power sources 147 (2005)
20
269–281.
[26] P. Verma, P. Maire, P. Nov´ak, Electrochimica Acta 55 (2010) 6332–6341.
[27] K. Xu, Chemical reviews 114 (2014) 11503–11618.
[28] P. Ramadass, B. Haran, R. White, B. N. Popov, Journal of power sources 112 (2002)
[29] A. Smith, J. Burns, D. Xiong, J. Dahn, Journal of The Electrochemical Society 158


![Table 2: Activation energies for the Arrhenius correction [13]](https://thumb-us.123doks.com/thumbv2/123dok_us/9479321.454188/15.612.156.457.210.298/table-activation-energies-arrhenius-correction.webp)