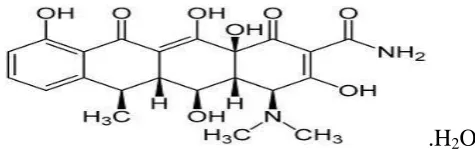
DEVELOPMENT AND VALIDATION OF DUAL WAVELENGTH
METHOD FOR THE SIMULTANEOUS ESTIMATION OF
DOXYCYCLINE MONOHYDRATE AND ORNIDAZOLE IN
SYNTHETIC MIXTURE
*Bhoomi H. Patel and Satish A. Patel
Department of Pharmaceutical Quality Assurance, Shree S. K. Patel College of
Pharmaceutical Education & Research, Ganpat University, Ganpat Vidyanagar– 384012,
Mehsana, Gujarat, India.
ABSTARCT
A simple, novel, rapid, precise, accurate, specific and cost effective
Dual Wavelength spectrophotometric method for the determination of
Doxycycline monohydrate and Ornidazole in combined dosage forms.
Dual Wavelength spectrophotometric method involves measurement of
absorbance at Wavelengths λ1 and λ2 at which absorbance difference
(A270 – A252.2) of DOX was observed and there was same
absorbance of ORN at this two wavelengths (270 & 252.2nm).
Wavelengths λ3 and λ4 at which absorbance difference (A310.6–
A291.4) of ORN was observed and there was same absorbance of
DOX at this two wavelengths (310.6 & 291.4 nm). The developed
method was validated according to the International Conference on
Harmonization (ICH) guidelines and all validation characteristics were
found within the acceptance limits. Thus the proposed method can be
successfully applied for simultaneous determination of Doxycycline monohydrate and
Ornidazole in combined dosage forms.
KEYWORDS: Doxycycline monohydrate, Ornidazole, Dual Wavelength spectrophotometric
method, Validation.
1. INTRODUCTION
Doxycycline is a broad spectrum antibiotic which acts against both gram positive and gram
negative organisms. It inhibits bacterial protein synthesis by attaching to 30 S subunit of
Volume 6, Issue 15, 887-895. Research Article ISSN 2277– 7105
*Corresponding Author
Bhoomi H. Patel
Department of
Pharmaceutical Quality
Assurance, Shree S. K. Patel
College of Pharmaceutical
Education & Research,
Ganpat University, Ganpat
Vidyanagar– 384012,
Mehsana, Gujarat, India. Article Received on 26 Sept. 2017,
Revised on 16 Oct. 2017, Accepted on 07 Nov. 2017
bacterial ribosome (which are absent in mammals).Doxycycline interfering the attachment of
aminoacyl-tRNA to the mRNA-ribosome complex and peptide chain fails to grow.
Ornidazole is a nitro imidazole which has broad spectrum cidal activity against Protozoa and
some anaerobic bacteria. Nitro group of drug is reduced by redox proteins present only in
anaerobic organisms to reactive nitro radical which excerts cytotoxic action by damaging
DNA and other critical biomolecules.
Doxycycline monohydrate and Ornidazole in their combined dosage form mainly used as
broad spectrum antibiotics because doxycycline act as antibacterial activity whereas
ornidazole act as antiprotozoal activity. In India Avidox-OZ & DOX-M-OZ are marketed as
combined dosage form of Doxycycline monohydrate and Ornidazole.
2. MATERIAL AND METHODS
2.1 Instruments
A double beam UV-visible Spectrophotometer (Shimadzu, UV-1700, Japan), attached to
a computer software UV probe 2.0, with a spectral width of 2 nm, wavelength accuracy of
0.5 nm and pair of 1 cm matched quartz cells.
Analytical balance (CP224S, Sartorius, Germany)
Ultrasonic cleaner (Frontline FS 4, Mumbai, India)
Corning volumetric flasks, beakers and pipettes of borosilicate glass were used in the
study.
2.2 Materials and Reagents
Doxycycline monohydrate and Ornidazole standard powder. (Acme Pharmaceutical Ltd.,
Ahmedabad, India)
Methanol AR grade as solvent (S.D. Fine Chemical Ltd., Mumbai, India.)
Whatman filter paper no. 41 (Whatman International Ltd., England)
2.3 Preparation of Solutions
2.3.1 Preparation of Standard Stock Solution
An accurately weighed DOX and ORN powder (10 mg) were weighed and transferred to 100
ml separate volumetric flasks and dissolved in methanol. The flasks were shaken and
volumes were made up to mark with methanol to give a solution having concentration 100
2.3.2 Preparation of working standard solution
The working standard solutions of DOX and ORN were prepared be transferrin aliquots’ of
standard stock solution of DOX (0.5, 1.0, 1.5, 2.0, 2.5, 3.0 & 3.5ml) and ORN (0.5, 1.0, 1.5,
2.0, 2.5, 3.0 & 3.5ml) was transferred in a series of 10 ml volumetric flask. The volume was
adjusted to the mark with methanol and mixed.
2.3.3 Preparation of Synthetic Mixture
600mg of synthetic mixture was prepared by using DOX (100mg) and OZ (500mg) and
excipients (100 mg) like MCC (Microcrystalline cellulose), Starch, Magnesium stearate and
Talc.
2.3.4 Preparation of Sample Solution
Quantity of the powder equivalent to 10 mg DOX & 50 mg ORN was transferred in 100 ml
volumetric flask separately and powder was dissolved in 50 ml of methanol with sonication
having slight warming temperature to dissolve drug as completely as possible. Then the
volume was adjusted up to mark with methanol. Transfer 0.5 ml of above solution to 10 ml
volumetric flask to get final concentration around 5 μg/ml of DOX and 25 μg/ml of ORN.
Then the volume was adjusted up to mark with methanol.
2.4 Method Development
2.4.1 Selection of Wavelength
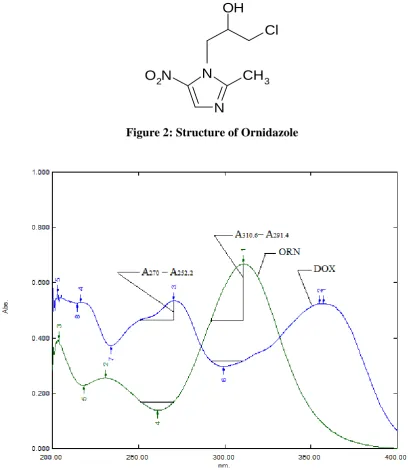
The solution of DOX and ORN were prepared separately in methanol and scanned in the UV
range of 200 - 400 nm. From the overlain spectra (Figure 3) of both drugs, four specific
wavelengths are selected.
(I) Wavelengths λ1 and λ2 at which absorbance difference (A270 – A252.2) of DOX was
observed and there was same absorbance of ORN at this two wavelengths (270 & 252.2nm).
(II) Wavelengths λ3 and λ4 at which absorbance difference (A310.6– A291.4) of ORN was
observed and there was same absorbance of DOX at this two wavelengths (310.6 & 291.4
nm).
Thus these four selected wavelengths were employed to determine the concentration of DOX
and ORN.
2.5 VALIDATION OF THE DEVLOPED METHOD
The method was validated as per the rules of International Conference on Harmonization
2.5.1 Linearity & Range
Calibration curve were plotted over a concentration range of 5-35 μg/ml for DOX 5-35 μg/ml
for ORN. Accurately measured standard working solution of DOX (0.5, 1.0, 1.5, 2.0, 2.5, 3.0
& 3.5ml) and ORN (0.5, 1.0, 1.5, 2.0, 2.5, 3.0 & 3.5ml) was pipette out in to a separate series
of 10 ml volumetric flask. The volume was adjusted to the mark with methanol and the
absorbance of the solutions was measured at 270 nm (λ1), 310.6 nm (λ2), 252.2 nm (λ3) and 291.4 nm (λ4). The difference in absorbance between 270 nm and 252.2 nm is (due to the 0
absorbance difference of ORN) plotted against DOX concentration (μg/ml). The difference in
absorbance between 310.6 nm and 291.4 nm is (due to the 0 absorbance difference of DOX)
plotted against ORN concentration (μg/ml) and two different regression equations were
obtained.
2.5.2 Precision
2.5.2.1 Method Precision (Repeatability)
The precision of the instrument was checked by repeated scanning and measuring the
absorbance of solutions (n = 6) of DOX and ORN (10 μg/ml for both drugs) without
changing the parameters of the proposed Method. The results are reported in terms of relative
standard deviation (% RSD).
2.5.2.2 Intermediate Precision (Reproducibility)
The intra-day and inter-day precision of the proposed method was evaluated by analyzing the
corresponding responses 3 times on the same day and on 3 different days over a period of 1
week for 3 different concentrations of sample solutions of DOX and ORN (10, 15, and 20
μg/ml). The results are reported in terms of relative standard deviation (% RSD).
2.5.3 Limit of detection (LOD) & Limit of Quantification (LOQ)
The limit of detection (LOD) and limit of quantification (LOQ) of the method were
calculated by using the following equations.
LOD = 3.3 X σ/S LOQ = 10 X σ/S
Where, σ = the standard deviation of the response
S = slope of the calibration curve
2.5.4 Accuracy (% Recovery study)
the standard addition method. Known amounts of standard solution of DOX and ORN were
added at 80%, 100% and 120% levels to pre quantified sample solutions of DOX and ORN.
3. ANALYSIS OF DRUGS IN SYNTHETIC MIXTURE
Synthetic mixture contains DOX (100 mg) and ORN (500 mg). Transfer accurately weighed
600 mg of synthetic mixture which equivalent to 100 mg DOX and 500 mg of ORN. It was
dissolved in sufficient amount of distilled water and sonicated for 30 min. The solution was
filtered through Whatman filter paper No. 41 and the volume was adjusted up to 100 ml with
methanol. From the resulting solution 1 ml of aliquot was further diluted up to 100 ml with
distilled water. From that 0.5 ml of solution was further diluted up to 10 ml with distilled
water. For elimination of the effects of an interfering component, four specific wavelengths
are chosen: Wavelengths λ1 and λ2 at which absorbance diff of DOX was observed and there
was same absorbance of ORN at this two wavelengths (270 & 252.2 nm). Wavelengths λ3 and
λ4 at which absorbance diff of ORN was observed and there was same absorbance of DOX at
this two wavelengths (310.6 & 291.4 nm). Thus these four selected wavelengths were
employed to determine the concentration of DOX and ORN.
4. RESULT AND DISCUSSION
The utility of dual wavelength data processing program is its ability to calculate unknown
concentration of components of interest in a mixture containing an interfering component.
The solution of DOX and ORN were prepared separately in methanol and scanned in the UV
range of 200 - 400 nm. From the overlain spectra of both drugs, four specific wavelengths are
selected. Wavelengths λ1 and λ2 at which absorbance difference (A270 – A252.2) of DOX
was observed and there was same absorbance of ORN at this two wavelengths (270 &
252.2nm). Wavelengths λ3 and λ4 at which absorbance difference (A310.6– A291.4) of ORN
was observed and there was same absorbance of DOX at this two wavelengths (310.6 &
291.4 nm). Thus these four selected wavelengths were employed to determine the
concentration of DOX and ORN.
LIST OF FIGURES
[image:5.595.177.415.669.743.2].H2O
N
N
CH
3O
2N
[image:6.595.85.494.72.543.2]Cl
OH
Figure 2: Structure of Ornidazole
Figure 3. Overlay spectra of DOX (15 μg/ml) and ORN (15 μg/ml)
LIST OF TABLES
Table 1. Regression parameters of DOX and ORN
PARAMETERS DOX ORN
Wavelength (nm) 270-252.2 310.6-291.4
Beer’s law limit (µg/ml) 5-35 5-35
Regression Equation Y=mX+C
Slop (m) Intercept (C)
Y=0.0045X-0.0016
0.0045 0.0016
Y=0.0142X-0.0007
Table2. Result of recovery study of DOX and ORN by developed method.
DRUG LEVEL Amt. Present
(µg/ml)
Amt. added
(µg/ml) % Mean Recovery ± SD
DOX
I 5 4 100.43±0.38
II 5 5 99.70±0.68
III 5 6 100.00±0.37
ORN
I 25 20 100.27±0.26
II 25 25 99.84±0.35
III 25 30 100.06±0.29
Table 3. Analysis of DOX and ORN in Pharmaceutical formulation by developed method. Sample No. Label claim (mg/Tablet) Amt. found
(mg/Tablet) % Label claim (%)
DOX ORN DOX ORN DOX ORN
1 100 500 99.55 499.85 99.55 99.97
2 100 500 103.11 504.64 103.11 100.92
3 100 500 100.00 501.26 100.00 100.25
4 100 500 98.22 505.63 98.22 101.12
5 100 500 100.44 491.26 100.44 98.25
6 100 500 99.11 502.23 99.11 100.50
MEAN 100.07 500.87 100.07 100.17
SD 1.67 5.15 1.67 1.03
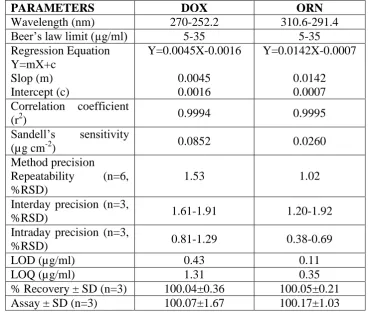
Table 4. Regression analysis data and summery of validation parameters for the developed method.
PARAMETERS DOX ORN
Wavelength (nm) 270-252.2 310.6-291.4
Beer’s law limit (µg/ml) 5-35 5-35
Regression Equation Y=mX+c Slop (m) Intercept (c) Y=0.0045X-0.0016 0.0045 0.0016 Y=0.0142X-0.0007 0.0142 0.0007 Correlation coefficient
(r2) 0.9994 0.9995
Sandell’s sensitivity
(µg cm-2) 0.0852 0.0260
Method precision
Repeatability (n=6, %RSD)
1.53 1.02
Interday precision (n=3,
%RSD) 1.61-1.91 1.20-1.92
Intraday precision (n=3,
%RSD) 0.81-1.29 0.38-0.69
LOD (µg/ml) 0.43 0.11
LOQ (µg/ml) 1.31 0.35
% Recovery ± SD (n=3) 100.04±0.36 100.05±0.21
[image:7.595.75.523.83.208.2] [image:7.595.112.482.447.759.2]5. CONCLUSION
The method described for the simultaneous estimation of DOX and ORN was found to be
sensitive, accurate and precise for routine simultaneous estimation of two drugs. The values
of standard deviation and % RSD were satisfactorily low and recoveries studies indicate the
reproducibility and accuracy of the method. The result of the analysis of the tablet dosage
form by this method is reproducible and reliable and is in good agreement with label claim of
the drugs. The additive present in the tablet dosage form did not interfere in the analysis. So
the method can be used for the routine analysis of drugs in combined dosage form.
6. ACKNOWALEDGEMENT
The authors wish to thank camper Healthcare and Acme Pharmaceutical Private Limited for
providing DOX and ORN pure drug powder as gift sample for research work. And we are
also hearty thankful to department of Quality assurance of S.K.Patel College of
Pharmaceutical Education & Research ,Ganpat University, for providing permission and all
the facilities to carry out the research work.
7. REFERENCES
1. O’Neil MJ. The Merck Index: An Encyclopedia of chemicals, drugs and biologicals, 14th
ed. New Jersey: Published by Merck Research Laboratories, Division of Merck and Co.,
Inc. Whitehouse station: Doxycycline; 2006; 3474: 606.
2. Indian Pharmacopoeia, Government of India, Ministry of Health and Family Welfare.
New Delhi: The controller of publication, 6th edition, volume 2, 2010; 1257-1260.
3. British Pharmacopoeia, The Department of Health, Social Services and Public Safety,
Doxycycline hyclate, 2010; 1: 755-57.
4. USP 32, NF 27; The United States Pharmacopeia; Doxycycline, 2009; 2: 2211.
5. European Pharmacopoeia Vol. 5.0, Starboury, Council of Europe, 2008; 1760-1763.
6. Japanese Pharmacopoeia. Society of Japanese Pharmacopeia.15th ed. Shibuya Tokyo,
Japan 2006; 1190-1191.
7. Snezana SM, Gordana ZM. A rapid and reliable determination of doxycycline hyclate by
HPLC with UV detection in pharmaceutical samples. Journal of Serbian chemical society
2008; 73(6): 665–671.
8. Ramesh, Divya, Nagarju. Titrimetric and Spectrophotometric Determination of
doxycycline monohydrate in pharmaceutical formulation. Chemical Industry & Chemical
9. Salvi M.S. et al. Development and validation of RP-HPLC Method for simultaneous
estimation of doxycycline hyclate and tinidazole in bulk and tablet dosage International
Journal of pharmacy and pharmaceutical sciences, 2013; 5(4): 7666-7671.
10. Venugopal Darak et al, Development and validation of simultaneous Spectrophotometric
estimation of Doxycycline and Tinidazole in tablet dosage forms. An international journal
of pharmaceutical sciences, 2011; 2(2): 85-90.
11. Indian Pharmacopoeia, Government of India, New Delhi: The controller of publication,
6th edition volume - 3, 2010; 1823-1824.
12. Development of new dissolution test and HPLC-RP method for anti-parasitic Ornidazole
coated tablets, Quim. Nova, 2010; 33(2): 478-481.
13. Lila KN, Tapan KG. Spectrophotometric Method Development and Determination of
Ornidazole in Bulk and Tablet Dosage Form. International Journal of Pharmaceutical
Technology and research 2011; 3(1): 153-156.
14. Pinak Patel et al. New Improved RP- HPLC Method for Determination of Norfloxacin
and Ornidazole in Their Combined Dosage Form. International Journal of Research in
Pharmaceutical and Biomedical Science. 2011; 2(2): 710-713.
15. Sevak Manan R. et al. Development & validation of RP-UPLC method for simultaneous
estimation of Ofloxacin and Ornidazole in their combine dosage form including stress
study, Journal of Applied Chemistry; 2014; 7(9): 32-35.
16. Natraj KS et al. UV Spectrophotometric Method Development and Validation of
Simultaneous Estimation Of Ciprofloxacin And Ornidazole In Tablet Dosage Form, Int
Res J Pharm 2013; 4(7): 178-181.
17. Gandhi Santosh V et al. HPTLC Determination of Cefuroxime Axetil and Ornidazole in
Combined Tablet Dosage Form, Journal of Chromatographic Science; 2010; 48: 26-29.
18. The International Conference on Harmonization.Q2 (R1).Validation of Analytical