Developing energy-loss test techniques for large buildings.
CLOSS, Stephen.
Available from Sheffield Hallam University Research Archive (SHURA) at:
http://shura.shu.ac.uk/19483/
This document is the author deposited version. You are advised to consult the
publisher's version if you wish to cite from it.
Published version
CLOSS, Stephen. (2004). Developing energy-loss test techniques for large buildings.
Masters, Sheffield Hallam University (United Kingdom)..
Copyright and re-use policy
See
http://shura.shu.ac.uk/information.html
Sheffield Hallam University Research Archive
Fines are
ch a
>d
at 50p
per
hour
ProQuest Number: 10694364
All rights reserved
INFORMATION TO ALL USERS
The qu ality of this repro d u ctio n is d e p e n d e n t upon the q u ality of the copy subm itted.
In the unlikely e v e n t that the a u th o r did not send a c o m p le te m anuscript and there are missing pages, these will be note d . Also, if m aterial had to be rem oved,
a n o te will in d ica te the deletion.
uest
ProQuest 10694364
Published by ProQuest LLC(2017). C op yrig ht of the Dissertation is held by the Author.
All rights reserved.
This work is protected against unauthorized copying under Title 17, United States C o d e M icroform Edition © ProQuest LLC.
ProQuest LLC.
789 East Eisenhower Parkway P.O. Box 1346
Developing Energy-loss Test Techniques for large buildings
Stephen Closs
A thesis submitted in partial requirement of the requirements of
Sheffield Hallam University
for the degree of Master of Philosophy
HALLA&j
October 2004
CONTENTS PAGE
ABSTRACT
5
CHAPTER 1 INTRODUCTION
6
1.1 Overview 6
1.2 CO2 emissions and climate change 7
1.3 Government measures to reduce carbon dioxide emissions 8
1.4 The impact o f air leakage in buildings on energy consumption 11
1.5 Assessment o f building infiltration rates 12
1.6 Airtightness testing methods 14
1.6.1 Steady state (DC) pressurisation techniques 14
1.6.2 Unsteady (AC) pressurisation techniques 15
1.7 Testing o f large buildings 15
1.8 Computer modelling o f air infiltration and energy use in buildings 17
1.9 Aims and structure o f the study 18
CHAPTER 2 LITERATURE REVIEW
21
2.1 Historical airtightness o f buildings 21
2.2 Building heat loss and envelope degradation associated with air leakage 22
2.3 Airtightness testing in the UK and internationally 22
2.4 Testing very large buildings 28
2.5 Summary 31
CHAPTER 3 THEORY
32
3.1 Steady state pressure measurements 32
3.2 Least square pow er law 32
3.3 Air leakage index vs. air permeability calculation methods 33
3.4 Effective leakage area 35
3.5 Calculation o f infiltration heat loss 36
3.6 Repeatability o f airtightness tests 38
3.7 Summary 39
CHAPTER 4 METHODOLOGY
40
4.1 Design and construction o f large test rig 40
4.2 Calibration o f large air test rig 45
4.3 Calibration procedure 48
4.4 Testing o f very large buildings 54
4.5 Remedial sealing measures 56
4.6 Summary 62
CHAPTER 5 FIELD TESTING
63
5.1 Field testing o f large buildings 63
-5.2 Testing o f a large warehouse (Building A) to determine building envelope
airtightness using the Megafan rig 63
5.3 Testing o f a very large retail store (Building B) to determine building envelope
airtightness using the Megafan rig 65
5.4 Testing o f a very large warehouse building (Building C) to determine
airtightness using multiple rigs 11
5.5 Summary 75
CHAPTER 6 RESULTS
76
6.1 Testing o f a large warehouse (Building A) to determine building envelope
airtightness using the Megafan rig 76
6.1.1 Log-log data plot fo r building pressurisation test 78
6.1.2 Linear data plot fo r building pressurisation test 79
6.1.3 Environmental and measured data 80
6.1.4 Building envelope data 81
6.1.5 Measured fa n and building envelope data 82
6.2 Testing o f a very large retail store (Building B) to determine building envelope
airtightness using the Megafan 83
6.2.1 Log-log data plot fo r building pressurisation test 84
6.2.2 Linear data plot fo r building pressurisation test 85
6.2.3 Environmental and measured data 86
6.2.4 Building envelope data 87
6.2.5 Measured fa n and building envelope data 88
6.3 Testing o f a very large warehouse (Building C) to determine airtightness using
multiple rigs 89
6.3.1 Log-log data plot fo r building pressurisation test 90
6.3.2 Linear data plot fo r building pressurisation test 91
6.3.3 Environmental and measured data 92
6.3.4 Building envelope data 93
6.3.5 Measured data 94
6.4 Discussion 95
6.5 Summary 96
CHAPTER 7 COMPUTER SIMULATION
97
7.1 Modelling o f a very large warehouse in Bedford 97
7.2 Computational flu id dynamics modelling o f Building C 99
7.2.2 Boundary Conditions 101
7.2.3 Grid and Grid independence 102
7.2.4 Solution control and Convergence 102
7.2.5 Jet Plume Calibration 103
7.2.6 Air-leakage test infdtration rate (0.07 ach'1) 103
7.3 Results o f dynamic thermal modelling o f Building C using original design specification and airtightness level determined from airtightness test to produce
energy consumption model 104
7.4 Results o f computational flu id dynamics modelling o f Building C 105
CHAPTER 8 CONCLUSIONS AND FURTHER WORK
107
8.1 Feasibility o f testing large buildings in the UK 107
8.2 Airtightness o f large warehouse buildings in the UK 108
8.3 Energy savings in Building C associated with improved envelope airtightness 108
8.3.2 Computational flu id dynamics (CFD) simulation 109
8.4 Further work on the impact o f energy savings with improved envelope
airtightness 110
8.4.1 Further work with dynamic thermal modelling 110
8.4.2 Further work with Computational Fluid Dynamics Simulation (CFD) 111
9.0
ACKNOWLEDGEMENTS
112
10.0 REFERENCES
113
11.0 RELEVANT LITERATURE
121
APPENDIX A.l FORMULAE USED IN THIS STUDY
138
A .l Altas main equations 139
APPENDIX A.2
142
A. 2 Pressure testing a very large building: theory and practice 142
APPENDIX A.3
149
A. 3 Sample o f Building C Dynamic Thermal Modelling output data 149
APPENDIX A.4
155
A.4 2000 mm fa n calibration data 155
APPENDIX A.5
167
A.5 1250 mm fa n calibration data 167
-Abstract
Studies have noted that the concentration of carbon dioxide in the atmosphere has risen by more than a third since the Industrial Revolution and is now rising faster than ever before. During the 20th Century there was an observed global mean temperature rise of around 0.6 °C. Analysis of these two coinciding events has resulted in the now widely accepted theory of “the greenhouse effect”. In 1997 the UK Government signed up to the Kyoto Treaty. This stipulated that all ratified states would enter an agreement to either curb, or reduce their total CO2 emissions, depending on the country’s current
output. Building energy use currently accounts for 46% of total UK energy consumption, resulting in the annual release of 66 million tonnes of carbon into the atmosphere.
As one step in addressing this issue the Government introduced the Approved Document Part L2 of the Building Regulations - Conservation o f Fuel and Power on the 1st April 2002. A requirement of the document was that a fan pressurisation airtightness performance assessment be made of the completed building envelope. For all non-domestic buildings with a gross floor area of greater than 1000m2 an air leakage test would be required in accordance with CIBSE TM 23:2000 to prove that the construction was reasonably airtight. The improvements made in the thermal performance o f building materials have raised the importance o f designing and constructing less air leaky building envelopes. It has been reported that heat loss associated with air leakage could account for 30% of heat loss through the building envelope.
It has been noted that previously available fan pressurisation rigs in the UK could not produce the flow rates to attain a satisfactory pressure difference across the envelope for large buildings. 'Large' building tests were previously classed as those carried out on structures with a floor area of up to only 5000m2. However, a modern UK warehouses can have a floor area of 60,000m2 or greater.
The thesis provides an account of the origins of airtesting and the evolving airtightness rules and regulations in the UK and other European Union member states. The methodologies for the practical application of airtightness testing and the calculation and interpretation of results are provided. The design, construction and calibration of the largest air testing rig in the UK (and possibly the world) are discussed. Three examples of very large buildings tested using this rig are presented; the largest o f which has a floor area of nearly 60,000 m2. Analysis of the airtightness test results and practical considerations for testing such large structures are presented. Examples of remedial sealing measures to improve building envelope airtightness performance are presented.
The largest building tested was then used as a case study for an investigation into the space heating energy saving benefits of improved building envelope airtightness. Dynamic Thermal Modelling (DTM) and Computational Fluid Dynamics (CFD) simulations were utilised to provide a space heating assessment of the building through a one month period. The study concludes that testing of very large warehouse buildings is practically feasible and that there are considerable energy saving benefits to be had from sealing building envelopes to best practice levels.
-Chapter 1 Introduction
1.1 Overview
The continual increase of the world’s population and improving standards of living have
resulted in an ever growing requirement for energy to facilitate demand. W hilst the
search for new sources of energy and types of fuel has previously been the priority,
there has now been a shift towards finding methods of reducing demand. This has been
partially realised through improved efficiency of production machinery and transport
vehicles. Analysis of the breakdown of energy use by sector reveals that the processes
providing space heating within buildings are a significant contributor to the overall
figure. Heat loss from buildings can occur by conductive, convective and radiant losses
through or from the structure or by infiltration losses from external air entering and
leaving the building. The gradual improvement in the effectiveness of insulation in the
walls, floors and roofs of buildings has focused attention on the airtightness of the
building structure. A building envelope with greater airtightness properties will reduce
the amount of unwanted external air entering the building, known as infiltration, and
warm internal air leaving the building, known as exfiltration. There are a number of
methods available to estimate building envelope airtightness and the associated air
change rate within a building. One method which has become increasingly prevalent,
due to its inclusion as a requirement in the latest revision of the Building Regulations, is
a fan pressurisation test. This entails subjecting the building envelope to a differential
pressure using a fan, usually mounted in an external doorway. The results of an
airtightness test can be used as a basis for calculating an indicative air change rate for
the building in question.
-1.2 C 0 2 emissions and climate change
Since the appearance of the human race on this planet, mankind has strived for progress
to improve standards of living and remove subservience to the harsh environment.
Throughout recorded history there has been a gradual progression towards what is now
described as modern civilisation. The latter half of the eighteenth century in Britain saw
a very rapid change from work carried out in the home with simple machines to
industries in factories with power driven machinery. This was the beginning of the
industrial revolution, a phenomenon that would eventually propagate over most of the
modem world.
The search for energy to power machinery led to the requirement for mining and
burning of fossil fuels. One of the main products of combustion of fossil fuels is carbon
dioxide. Studies of trace gases in the atmosphere have noted that the concentration of
carbon dioxide has risen by more than a third since the industrial revolution and is now
rising faster than ever before. During the twentieth century there has been an observed
global mean temperature rise of around 0.6 °C (White Paper 2003). Analysis of these
two coinciding events has resulted in the now widely accepted theory of “the
greenhouse effect”. The principles of the greenhouse effect are that trace gases in the
atmosphere absorb infrared radiation emitted by the Earth’s surface, causing a warming
of the atmosphere. This has traditionally been vital for maintaining temperatures for life
to flourish. However, the burning of fossil fuels has upset the balance and a gradual
increase in global temperatures has ensued. Carbon dioxide is thought to account for
half of the warming effect associated with greenhouse-gas emissions (Shorrock and
The IPCC report (2001) highlights projections that globally averaged surface
temperatures are set to increase by 1.4 to 5.8 ° C by 2100. Computer modelling (Graves
and Phillipson 2000) has been used to predict that mean annual temperatures will
increase by up to 2.4 °C by 2050 and up to 3.3 °C by 2080 in London. Climate change
is already having a noticeable impact in the UK. Vidal and Brown (2003) summarised
that “drought stress in crops has increased sharply in the past 20 years, with farm ers
now saving irrigation water fo r higher value vegetables and salad crops. Climate
change is already affecting foundations o f buildings as the soil dries out, according to
the Building Research Establishment. The government is also considering new
regulations, particularly fo r tall buildings, so they can withstand higher wind speeds. A
decade o f sudden downpours, ferocious storms, flash floods and prolonged cloudbursts
all consistent with global warming have provoked the government to increase spending
on defending towns from river flooding by hundreds o f millions o f pounds. It has also
raised the standard height o f sea defences”.
1.3 Government measures to reduce carbon dioxide emissions
UK carbon dioxide emissions currently account for about 2% of the global total (White
Paper 2003). In 1997 the UK Government signed up to the Kyoto treaty. This
stipulated that all ratified states would enter an agreement to either curb, or reduce their
total CO2 emissions, depending on the country’s current output. The UK target was set
at a 12.5% reduction of 1990 greenhouse gas emissions by the year 2008 - 2012. This
covers a basket of six greenhouse gases (carbon dioxide, methane, nitrous oxide, hydro
fluorocarbons, per fluorocarbons and sulphur hexafluoride), weighted for their global
more stringent domestic target of reducing carbon dioxide emissions to 20% below
1990 levels by 2010.
A long term strategy was revealed in February 2003, when the Government released the
White Paper entitled “Our energy future - creating a low carbon economy”. The target
set by the Government is to reduce emissions of carbon dioxide by 60% by 2050. The
target is based on a report by the Royal Commission for Environmental Pollution
(2000), which estimates that reductions in the region of 60% relative to current day
emissions would be required by 2050 to prevent CO2 concentrations exceeding safe
limits. It is hoped that this will be achieved by an increased reliance on renewable
energy for production of electricity and a speeding up of changes to building regulations
and setting tougher standards for energy efficiency in new homes, refurbishments and
electrical products. Building energy use currently accounts for 46% of total UK energy
consumption, resulting in the release of 66 million tonnes of carbon into the atmosphere
(Pout et al. 2002).
To address the issues of energy use in buildings, the Approved Document Part L2 o f the
Building Regulations - Conservation of Fuel and Power was introduced on the 1st April
2002. For the first time a framework was proposed that would produce an assessment
of the total energy performance of new buildings. Three different approaches;
Elemental, Whole Building or Carbon Emissions Calculation M ethod could prove
compliance in ascending order of complexity. The route chosen would satisfy Building
Regulations at design stage. Upon completion of construction two performance
1.2 C 0 2 emissions and climate change
Since the appearance o f the human race on this planet, mankind has strived for progress
to improve standards o f living and remove subservience to the harsh environment.
Throughout recorded history there has been a gradual progression towards what is now
described as modem civilisation. The latter half o f the eighteenth century in Britain saw
a very rapid change from work carried out in the home with simple machines to
industries in factories with power driven machinery. This was the beginning o f the
industrial revolution, a phenomenon that would eventually propagate over most o f the
modem world.
The search for energy to power machinery led to the requirement for mining and
burning o f fossil fuels. One o f the main products o f combustion o f fossil fuels is carbon
dioxide. Studies of trace gases in the atmosphere have noted that the concentration of
carbon dioxide has risen by more than a third since the industrial revolution and is now
rising faster than ever before. During the twentieth century there has been an observed
global mean temperature rise o f around 0.6 °C (White Paper 2003). Analysis o f these
two coinciding events has resulted in the now widely accepted theory o f “the
greenhouse effect”. The principles o f the greenhouse effect are that trace gases in the
atmosphere absorb infrared radiation emitted by the Earth’s surface, causing a wanning
o f the atmosphere. This has traditionally been vital for maintaining temperatures for life
to flourish. However, the burning o f fossil fuels has upset the balance and a gradual
increase in global temperatures has ensued. Carbon dioxide is thought to account for
half o f the warming effect associated with greenhouse-gas emissions (Shorrock and
The first requirement was that insulation should be reasonably continuous and that
excessive thermal bridging should be avoided. Submitting a certificate from a suitably
qualified person that appropriate design details and building techniques have been used
could satisfy this. Alternatively, an infrared thermographic inspection could be used to
show that the insulation is reasonably continuous over the envelope.
The second requirement was that an airtightness performance assessment be made of the
completed building envelope. For all non-domestic buildings with a gross floor area of
greater than 1000m2 an air leakage test would be required in accordance with CIBSE
TM 23:2000 to prove that the construction was reasonably airtight. Prior to the Part L2
Regulations 2002, no requirement had been stipulated for the airtightness performance
of the building envelope. Increased enthusiasm from the UK government to meet
carbon dioxide emission reduction targets has deemed it necessary to bring forward the
next revision of Part L of the Building Regulations to 2005. This will see tighter targets
for building energy performance and airtightness of the building envelope (Office o f the
Deputy Prime Minister 2003) across a broader spectrum of the UK building stock.
Figure 11 Sample size: n - 384.
Mean value: 11.49 m3 h~* n r 2. Median value: 11.27 m3 h_1 n r 2.
Figure 1. Airtightness o f UK buildings Source: CIBSE TM23:2000
- 1 0
-100
Leaky
90
-80
--2L 70 - - o' g 60
-3
5 0 - - § § 4 0
-Average
20 Tight
10
-2 4 6 8 10 12 14 16 18 20 22 24 26 28 30 32 34 36 38
Growing concerns amongst the European Union of the energy use in buildings has
resulted in the design and implementation of the EU Energy Performance o f Buildings
Directive (Council of the European Union 2002). The EU Directive notes that “the
residential and tertiary sector, the majority of which are buildings, accounts for more
than 40% of final energy consumption in the community and is expanding, a trend
which is bound to increase its energy consumption and hence also its carbon dioxide
emissions”. In response to this the Directive lays down the general framework for a
methodology of calculation of the integrated energy performance of buildings, which
may include airtightness standards for the building envelope. This culminates in a
requirement for the application of minimum performance standards for the energy
consumption of new buildings. The stipulation is also placed upon large existing
buildings that are subject to renovation. All buildings subject to the EU Directive will
be labelled with a transparent energy performance indicator, such as is currently seen on
white electrical household goods.
1.4 The impact o f air leakage in buildings on energy consumption
The improvements made in the thermal performance of building materials have raised
the importance of designing and constructing less air leaky building envelopes. Air
leakage in buildings is described as the unwanted infiltration and exfiltration o f air.
This can enter a building through a number of infiltration paths, usually located at
junctions between elements in the building envelope. Perera et al. (1994) noted that heat
loss associated with air leakage could account for 30% of heat loss through the building
envelope. A recent study by the UK’s Air Infiltration and Ventilation Centre (Orme
2001) puts forward estimates of annual air change rates of commercial and residential
buildings in 13 industrial countries, with the potential for reducing air change related
-losses. Unnecessary ventilation was noted to account for two-thirds o f the energy
wastage through the loss o f conditioned air.
The original design specification and the attention to detail during construction will
determine the airtightness of a building envelope. The airtightness o f a building will
dictate the level of unintentional infiltration and exfiltration o f air. The movement o f
colder external air into the interior o f the building will create a thermal load. This
thermal load is a function o f the rate at which the air enters the building and the
difference between the indoor and outdoor temperature (Jackman 1973). The figures
for best practice airtightness levels in new UK buildings by Potter (2001) show that
there is great scope for improvement of the construction of building envelopes. With
the rapid rise in demand for air conditioning in offices and retail premises over the past
20 years (Scrace 2001), the need for airtight buildings is paramount.
1.5 Assessment o f building infiltration rates
Air that enters a space comes from a combination o f infiltrating and intentional sources.
While the measurement o f air flow rate through identifiable openings is possible by
direct measurement, it is not practical to measure air flow through the many unknown
gaps and cracks that may appear in the construction o f the building, or to measure air
flow rate through more than one or two purpose provided openings at a time
(Liddament 1996). Amongst the field o f air infiltration measurement techniques within
buildings a number of methods are available. However the two that are most commonly
used are the tracer gas and fan pressurisation assessment methods.
-Tracer gas assessment involves the inserting of a seeded inert gas into a building and
measuring the decay of concentration as mixing occurs with unseeded infiltrating air
over time. Examples of the adaptation of tracer gas techniques to larger and more
complex multi-cellular buildings can be found in Walker and Perera (1990) and W alker
and White (1995). However, the use of tracer gas techniques can be a long and
laborious task, with the estimation of building infiltration rates taking days or even
weeks.
Figure 2. Tracer gas equipment - gas bottle, sampler unit and bags. Source: Walker and Perera 1990
The fan pressurisation method entails the use of a fan to create a pressure differential
across the envelope. The input of a constant flow rate to produce a steady state (DC)
pressure differential is the currently accepted method (CIBSE TM23:2000). After fan
set-up and building preparation, an airtightness test may take only ten minutes. Results
for the airtightness of the building envelope are reported as an air leakage rate per
-square metre of building envelope per hour at a reference differential pressure of 50
Pascal. From this airtightness result estimation can be made of the indicative
infiltration rate, based on comparisons with data obtained from tracer gas techniques.
Sherman and Grimsrud (1980) demonstrated the use of the fan pressurisation test to
estimate building airtightness. This technique was used to determine the total leakage
area of the structure. From this the infiltration rates were calculated for a variety of
conditions. The steady state technique is the most commonly used method; however,
other pressurisation assessment processes are available.
1.6 Airtightness testing methods
1.6.1 Steady state (DC) pressurisation techniques
Steady state (DC) assessment of building airtightness performance involves establishing
a pressure difference Ap across the envelope. This can be achieved utilising portable
fans temporarily installed in a doorway, or other suitable opening. HVAC plant is
switched off and all external doors closed. Measurements taken of the flow rate Q
across the fans and Ap across the envelope allow a relationship to be established
between the two. In accordance with the current building regulations adherence to
CIBSE TM23, this is defined in terms of the power law equation of the form:
Q = C (A p )n (1.1)
where C and n are constants that are assumed to relate to the geometry o f a single
opening in the building envelope. The building envelope is subjected to differential
pressures ranging from 20 up to 100 Pascal. If a pressure differential of at least 25
Pascal cannot be obtained, then the test is deemed to be invalid. Values for C and n are
-calculated using least square regression analysis. The flow rate required to obtain a
differential pressure is a function of the building envelope area. Very large buildings
will therefore require a fan with a large volume flow rate.
1.6.2 Unsteady (AC) pressurisation techniques
Unsteady techniques (AC and pulse techniques) have been suggested as alternatives to
the conventional steady state technique (Modera 1985, Nishioka 2000, Carey and
Etheridge 2001). The theoretical advantage is that large expensive rigs would not be
required and disruption to operations during building testing would be minimised.
However, uncertainties introduced by the inertia of the flow through imperfections in
the building envelope add increased complexity to the calculations and the technique is
currently impractical for widespread commercial use. The DC technique is therefore
preferable if an acceptable differential pressure is achievable across the building
envelope.
1.7 Testing o f large buildings
Available data for the airtightness of UK buildings is limited. Stephen (1998) noted that
only two large scale databases of air leakage rates in UK dwellings are known: one held
by British Gas pic and covering some 200 dwellings (Etheridge 1987); and the other
held by BRE covering some 471 dwelling and 87 large panel system flats. No
databases are currently available for larger non-domestic buildings.
Carey and Etheridge (2001) noted that previously available fan pressurisation rigs in the
UK provided by BRE and BSRIA could not produce the flow rate to attain a satisfactory
pressure difference across the envelope for larger buildings. The accuracy of the results
would be affected as a result of pressure forces generated by buoyancy and wind.
-“Large building” tests were previously classed as those carried out on structures with a
floor area of up to only 5000m . Modem UK warehouses can have a floor area of
60,000m2 or greater. Calls from CIBSE, BRE and BSRIA (Brundrett and Jackman
(1997)) to produce a joint initiative aimed at improving building airtightness resulted in
the introduction of mandatory testing in the UK. However, no progress was made with
the testing of large buildings, such as the Bedford warehouse shown in figure 3, which
has a floor area of nearly 60,000 m2 and a volume of nearly 800,000 m 3. This building
will be one of the case studies analysed in Chapter 5.
Figure 3. Very large warehouse building, Bedford UK.
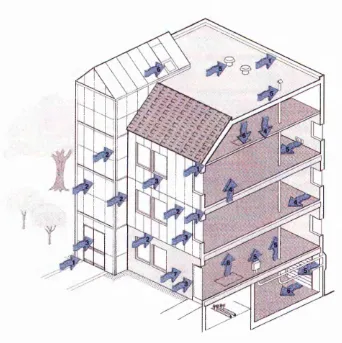
[image:20.612.111.487.286.542.2]-1.8 Computer modelling o f air infiltration and energy use in buildings
Computer simulations may be used to assess the effects of external conditions on the
internal building environment. Boundary conditions can be established using the
known variables of building thermal properties and external environmental conditions.
Modern computer thermal analysis software allows for all conceivable component
properties to be accounted for in the determination of thermal load upon a building.
The level of thermal load determining the size of heating plant that must be installed.
Software packages such as TAS (Kitson 2003) have been used to calculate the heating
demands and specify plant for prestigious projects such as the Swiss Re building in
London (Building Services Journal, June 2003).
For a given set of wind conditions (illustrated by pathlines) FLUENT predicts surface pressures (illustrated by contours) on
the building exterior and external aerodynamic air flow characteristics ventilation
Figure 4. Dynamic Thermal Computer Modelling used to assist in the specification o f M and E plant at the Swiss Re building, London.
Source: Kitson 2003
[image:21.612.175.405.325.592.2]-Infiltration is a variable that will be instrumental in the calculation of building heating
demands. However, due to limited data on building airtightness, values are assumed as
a rule of thumb (Boushear 2001). This may lead to inaccuracies and under or over
sizing of heating plant. Over sizing may be a problem, particularly in new buildings
that have been constructed to a demanding airtightness specification. Stuart Borland,
director of Building Sciences Ltd, claimed that in one case the M and E plant was
halved in size because the designers knew the building would be pressure tested
(Stephen 2002). Using currently available technology it is possible to compile building
envelope performance data obtained from building airtightness tests and comprehensive
building component data available in O and M manuals. The parameters may be used
to assess the effect of the external environment on internal building conditions. The
data sets obtained may be inputted in computer thermal modelling software and a
simulation run with a weather data file to calculate the heating load placed on the
building during a heating season. From this simulation it may be possible to more
accurately assess heating requirements for plant sizing.
1.9 Aims and structure o f the study
In Chapter 2 of the study a review will be made of the historical airtightness of
buildings in the UK and abroad. This will be followed by a summary of the heat loss
from a building and envelope degradation associated with air leakage. The literature
review will also include a chronological account of airtightness testing regulations and
recommendations in the UK and internationally.
Chapter 3 will highlight the theory used to support airtightness testing o f buildings;
techniques. Methods for calculation and interpretation of results will be presented along
with an assessment of infiltration heat loss and the equivalent leakage area calculation.
Finally, previous research into the repeatability of airtightness tests will be highlighted.
Chapter 4 will give an insight into the methodology required for the creation and
calibration of a large test rig. A review of the design and construction process for the
large test rig, along with lessons learned from mistakes will be provided. Required
equipment and methodology for the calibration of the rig will also be presented. The
practical requirements for airtightness testing will also be noted, with particular
reference to the testing of large and very large buildings. Finally, a summary will be
made of some remedial sealing measures that are currently in use on new and
refurbished buildings.
Chapter 5 will report on the field testing of one large and two very large UK buildings.
In chapter 6 the output graphs and tables from the field data will be presented. A brief
interpretation of the results will be given.
Chapter 7 will summarise the computer modelling work carried out in conjunction with
Hilson Moran consulting engineers. Airtightness data obtained from the testing o f a
very large warehouse will be input into a currently available computer thermal-
modelling program along with available building envelope thermal data. Simulations
will be run to assess the thermal loads imposed on the building during the heating
season. One simulation will be run with the building airtightness specification utilised
at the design stage (Current Building Regulations standard). The second simulation will
be run with a building airtightness specification actually achieved during the building
test.
-Chapter 8 will firstly discuss the viability of testing very large buildings in the UK. The
current information available on the airtightness of large warehouses in the UK will be
summarised. Following this, analysis of the energy saving associated with the
improved envelope airtightness observed at the very large warehouse will be given.
Finally, an investigation into the further work that can be carried out into the impact of
energy savings with improved envelope airtightness will be presented.
-Chapter 2 Literature review
2.1 Historical airtightness o f buildings
Early measurements of airtightness in dwellings entailed small fans mounted in
doorways, known as “blower door fans”. Blower door technology was first used in
Sweden as a window mounted fan to test the tightness of building envelopes
(Blomsterberg 1977). Sherman and Grimsrud (1980) noted the disadvantages o f tracer
gas methods and devised a technique using fan pressurisation results and weather data
to calculate infiltration.
Potter et al. (1995) carried out airtightness on twelve large UK office buildings with
3 3
volumes ranging from 1,951 m to 44,335 m . The average normalised leakage of the
3 1 2 j
structures was found to be 21.8 m h‘ m . Naturally ventilated buildings were found to
be tighter (17.40 n r V m '2) than air-conditioned buildings (23.98 m ^ ^ m 2). Pre 1990
buildings (17.81 m3h 'm '2) were found to be tighter than post 1990 buildings (24.62
m h" m' ). They summarised that a UK office could have an air leakage performance
T 1 9
anywhere between 10 and 40 m h 'm " . Potter (1992) also found the average air leakage
of a UK factory/warehouse building to be 35.68 m3^ ^ ' 2.
Stephen (1998) noted that UK dwellings built since about 1980 do appear to be more
airtight (on average) than those built since the 1930’s. He attributed this to fewer
chimneys and adoption of energy efficiency measures. The same trend comparing post
1980 houses with pre 1980 was also noted in the USA (Sherman 1990), no reasons for
this were specified. Further work was carried out in the USA (Sherman and Dickerhoff
1998) on much larger datasets that represented much more comprehensive
-sections of homes in particular locations than had not previously been studied. They
discovered that USA dwellings were leakier than previously estimated. Furthermore the
datasets studied showed that less than 10% of dwellings in the U.S. would meet
ASHRAE’s airtightness standard (1988).
2.2 Building heat loss and envelope degradation associated with air leakage
Warm conditioned air exfiltrating through the building envelope causes more problems
than just greater heating requirements. Studies on rural hospitals in the province of
Alberta, Canada (Ogle and Connor 1995) have shown that a lack of airtightness may
result in serious building envelope problems. This is particularly true for non-domestic
types of buildings, which can be humidified and pressurised by a mechanical HVAC
system. Potter and Jones (1992) analysed the effects of environmental conditions on
energy usage on a sample of factories and warehouses using the “CRKFLO” computer
program. This software calculates the flow rates between components, taking into
account inside/outside temperature differences and wind effects on the building.
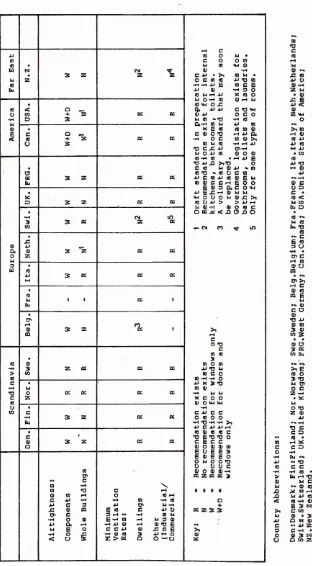
2.3 Airtightness testing in the UK and internationally
In an AIVC review (Colthorpe 1990) assessed the building airtightness and ventilation
standards in various European countries. All countries analysed stipulated minimum air
change for ventilation requirements, with most countries producing a methodology for
calculation of energy use. Legislation for airtightness of building fabric varied from
non-existent to extremely stringent. A summary for the airtightness requirements for
each country was:
-Sweden
The average air leakage coefficient, for that part of the enclosed surface that forms part
of the enclosing surface which forms the boundary with outdoor air or an unheated area
may not exceed 3
m'Vm
2 for dwellings and 6 m3h-1m"2 for other premises at a pressuredifference o f 50 Pa. The air test results were taken as averages of the pressurisation
tests at 50 Pa (Q5 0). Alongside airtightness requirements, stipulation was also enforced
for minimum air exchanges to maintain air quality.
Denmark
The Danish Building Regulations 1982 give construction standards for all new
buildings, to a high level of energy efficiency. These standards were also being applied
to existing building stock under the 1981 Act on reduction of energy consumption in
buildings, issued by the Danish government. No requirement was in place to test whole
buildings, though component testing was specified.
Finland
Whilst air sealing of fabric and windows was considered, there were no numerical
values for acceptable building airtightness in the building codes. However, thermal
insulation regulations require that the airtightness had to be good enough to comply
with the thermal indoor climate guidelines. Classification of window airtightness was
voluntary, but widely used amongst manufacturers and builders.
Belgium
National standards were in place for the public building sector, which comprised 30%
of the building stock. There were no overall airtightness requirements for whole
buildings. Windows were classed in groups according to their air leakage performance
-and degree of exposure i.e. height of building in which the window is situated.
Maximum air permeability rates for joints were set at each exposure level.
Canada
Standards were in place to determine the airtightness of buildings by the fan
depressurisation method. There was no legal requirement to test whole buildings.
However, testing of windows and doors was mandatory with maximum air leakage rates
set for different component ratings.
Germany
No regulations in place for airtightness testing of buildings. However standards in place
classified windows by exposure level and gave acceptable air permeability values for
each group under pressure. Standards were also available making recommendations for
sealing joints and installing vapour barriers, with further standards for wind resistance
tests etc.
Italy
Testing was in place for building components. Recommendations were also made for
the airtightness testing of whole buildings.
-Table 1. Requirements and recommendations fo r airtightness and ventilation rates in some countries.
Source: A IV C 1990
•P C
4J (0 O P •
CO C O O CD
(0 • P CO W 111
w S) CM Q) *P
• M N z z C U • >1 10 P •
M z o c oi io 4J 'o m
10 ■h m u E co C E
be -p a> * < - i3 o
O P H 4 J X 19 O P O *p 10 9) H p
• O f
10 < Q _ Q, 4J 4J C *0 >P
u CO + Z 02 02 ai 44 o c o
■p D 3 p in **o -p io
Qi-p CO P 44 CO
Cl> , x E m m co at
E e a _ c a) o tj h si a < 10 + z 02 02 •p o c to <U >i
cj 3 10 P (0 P P 4J
U C £ 4 J CT>*P P O 4J CO 4) O CD (0 -P (0 • ip 44 E n 44 4D >,T3 O
• C 10 P <U 44 * CD
I o 10 Tl *■ 10 CJ C CO
02 M N 02 02 44C C0 44 ( 0 ( 0 E P
Cm c o a i c c P E o o
E 01 3 Si C O M-t
• 44 g JC p CD p P
SO t P O O O P O J - C J p
D 3 Z 02 02 (0 O 44 > > 44 rH 11 /it -p (li a cn r
• □ C 2JC < J 3 U Q O
•P CM in
3 W R Z 02
CO •—cm co m
j : 0) 44
a a> » z 02 02
o z u 3 • co (0
44 W R 02 02
w
10
P 1 1 a; i
Cm
O' •H
0) W N % >i
CQ *p
c O •D
C CO (0
• 3
(0 0) CO o to
-w 3 N R 02 02 44 <D P
> co CO C O
10 CO *P -P o
c • 4 X 3 0
•H u CO 0)
•o o R R 02 02 -p p p
c z X C 0 o
10 0) O ip <p
o • •p
CO c C 44 c C
-<-l W N 02 02 O to o o be •p *0 -p -p >i
44 C 44 44 p
• to 0) to to c
c f D E 'O 'O O
a> M N 02 02 C E C C a 01 O 11 01 10C fo c c *>
c U c c > E a) E E o O M O O O O 0 o c
CO 01 O 0) 0 ) p
cn 02 Z 02 02 3
c
CO *P X
co *a C -1 II II II u Q) CO •—« 0 10 <P
C 44 -P •p co -p co a 44 C 3 44 O' P -p + .C CD CQ E 10 C 4J 0 02 Z 3 3
a> c 3 r l ■■ *P in p
•p O <D g -H 01 ip U 3 a> I
4J Oe -H m s i ii i-i a i t E • • P e O E C O 0) £ C E >1 • P O X ; -p QJ 10 3 - M H O a>
< cj 5 £ > 02 Q O '- C J sc
Q)
Z «P O >l (0 ip Q)
10 4J 44 (0 M 44 • OT
(0 44 >a hh a)
<u c
o o
c •
(0<
u w Cm D
10 p re Cm * 0 (0 C e re
3 CJ
•H • a> c
i—I (0
a) a CQ
O' >i
.P c
0) (0 (Q £p 0)
c o
ai •a -u
0) CO
3 0)
co S at u
3 «
CO Cm
£ E to o 3 T3 p tr> o c Z - p • b£l p O 'D z CD 44 • —- p 'D c C 23 •• 10 • CO fpsc c C D o - p - p be • -44 •• TJ 10 c c • p • p to •
> f a p t QJ P c p •—a) to X) JC N .P
JO p 44 <0
< to *P Cl) E 3 N >1 c co p a> • 3 44 o N CD
c ••44 Z 3 C -p •
o QJ 3 esi CJ a w z
[image:29.612.124.436.78.644.2]-Table 2. Overview o f Airtightness Levels in Standards and Regulations in 1994. Source: AIVC 1994
Country Whole Building Components
Windows Doors
Belgium < 3ach for dwellings fitted with
bal.mech.at SO Pa.
<1 ach when heat rec.is fitted at SO Pa.
2 - 6 m3/h per metre length of crack at lOOPa
20-40 m3/h per door at 10 or 50 Pa.
Canada Maximum 1.5 ach at SO Pa
(For HUDAC constructed dwelling)
Extreme 0.25 • 8.35 n?/h.m at 75 Pa
Normal 0.55 - 2.79 fflVh.m at 75 Pa
2 .5 4 1/s .m2 o f door area at 75 Pa
Denmark 0.5 dm3/s.m length of joint at 30
Pa
0.4 • 0.7 ach for dwellings
0.50 dm3/s.m length o f crack at 50 Pa
Finland <0.5 - >2.5 tn3/h. m2 at 50 Pa
France Max. 0.2 ach for non residential
buildings
<7.0 - 60 mVh. m2 at 100 Pa < 7 -6 0 n^/h. m2 at 100 Pa
Germany 1 • 20 m3/h. m length o f joint
depending upon exposure level over the pressure range 10 -1000 Pa
Italy 1 m2 o f envelope should not
exceed 10 m3/h at 98 Pa 1.5 - 5.0 ach for schools
1.4 - 8.0 m3/h. m (Crack) at 50 Pa 4.8 - 31 m3/h. m2 (Area) at 50 Pa
Netherlands Class 1 Max. 100 - 200 dirf/s at
10 Pa (1.4-2.24 ACH at 10 Pa) Class 1 Min. 30 - 50 drrf/s (0.4 - 0.72 ACH at 10 Pa) Class 2 Max. upto 80 dm3/s (0.72 - 1.15 ACH at 10 Pa)
2.5 dm3/s per m length o f crack at 75 Pa
0.5 dm3/s per 100 mm of frame section
New Zealand 0.6 - 4.0 dm3/s. m o f joint at 150
Pa
2.0 • 17.0 dm3/s .m2 window area at 150 Pa
Norway 1.5-4.0 ach at SO Pa
Sweden 3 - 6 m3/h m2 at 50 Pa
Switzerland Lower limit 2 - 2.5 ach at 50 Pa
Upper limit 3 - 4.5 ach at 50 Pa. NOTE Upper limit for Buildings with balanced mech. is 1 ACH at 50 Pa
0.2 m3/h.m at 1 Pa (When n*0.66)
(a)5.65 m3/h.m at 150 Pa (b)8.95 n^/h.m at 300 Pa (c)14.25 mJ/h.m at600 Pa
United Kingdom 1.22 - 6.2 at 50 Pa m3/h m o f
open joint
United States o f America Normalised leakage range taken
from measurements at 4 Pa ELA for whole o f USA. From <0.1 - 1.60 (from ASHRAE 119-1988, APP.B ACIMLn. Therefore <0.1 to 1.6 ach)
NOTE: Standard requires no part of US to be tighter than 0.28 (only small part o f upper midwest) Mostly the tightness requirement is 0.4.
0.77 dffiVs per m of sash at 75 Pa 2.5 - 6.35 dntVper m2 area at 75 Pa 17.0 dm3/s per m length of crack at 75 Pa
-1 I ^
In the UK (England and Wales), an air permeability target of 1 0 m 'h 'm ' was introduced
on April 1st 2002 for all new non-domestic buildings with a floor area greater than
1000m in the Approved Document Part L2. A period of leniency was granted up to the
30th September 2003 in which a building with an originally unsatisfactory test would
have to undergo appropriate remedial work and a retest to show that:
-(i) an improvement of 75% of the difference between the initial test result and the
target standard of 10 m
Vm'2
at 50 Pa; or, if less demanding3 1 2
(ii) a performance no worse than 11.5 m hf m' at 50 Pa.
The Building Regulations Part J were introduced in Scotland during the same period.
Methods were identified for the conservation of fuel and power, although there was no
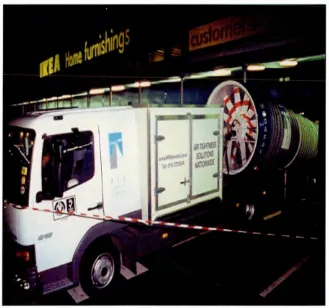
mandatory requirement to airtest buildings. Some enlightened clients, such as IKEA
have chosen to airtest their Scottish based stores, despite there being no legal
requirement.
Stephens (2002) noted that before its introduction into the building regulations it was
estimated that fewer than 5% of buildings were pressure tested. Implementation and
enforcement of the new airtightness testing regulations in England and Wales has been
slow and largely uncoordinated. In a survey of new buildings identified by the
Glennigans database, HRS Services Ltd estimated that only 30% o f projects were
subject to an airtest upon completion of the envelope. This has not been helped by
factors such as Billington (2001) in his manual to the building regulations, in which he
states “Construction, offers insulation continuity thermography and air pressure testing
as options to show compliance but it is expected that designers and contractors will
-prefer to use the new robust details”. In response to the increasing confusion
surrounding the requirements for airtightness testing of buildings, King (2003) of the
Building Regulations Division at the Office of the Deputy Prime Minister wrote a letter
of clarification, for circulation amongst the industry. In this he states that, “The current
introduction to AD L2 says there is no obligation to adopt any particular solution
contained in an Approved Document i f you prefer to meet the relevant requirements in
some other way. However, the underlying objective remains the achievement o f a fabric
performance that - if put to a pressure test - would achieve the performance standard.
In relation to larger buildings, the AD offers no alternative to pressure testing as a way
o f showing compliance with the airtightness aspect o f Part L 2 ”.
2.4 Testing very large buildings
The ease of testing dwellings with blower door fans has meant that some data are
available for the airtightness of residences. The commercial realities of testing large
buildings have meant that there is very little data available for industrial buildings.
British Gas carried out pressurisation tests on seven “large” buildings, with volumes
ranging from 660 to 12,600m (Lilly 1987). Measurements were made with four
Watson House leakage testers used in parallel. Each unit was capable of producing a
i
maximum flow rate of 1.25m s" at 50 Pa. The study noted that measurements of the
buildings under test required pressurisation equipment sufficient to generate flow rates
'X 1 • • •
in excess of 65,000m hf . The conclusion was that it was impractical to pressurise most
industrial buildings larger than 5000 to 10,000m3 in volume to a pressure of 50 Pa.
However, the author illustrated the fact that a purpose built leakage tester for large
buildings was now in operation to generate 50 Pa pressure differences at flow rates of
up to 150,000m3h '1.
-Potter and Jones (1992) documented the improvements that could be made to buildings
using basic sealing techniques. Perera et al. (1994) highlighted the following areas as
the main sources of air leakage.
1. At junctions between main structural elements; wall to roof junctions, wall to
floor junctions, wall to foundation junctions, junctions between parapets and roofs.
2. At joints between walling components; sealant or gasketed joints between
heavyweight or curtain walling panels, overlapping joints between lightweight sheet
metal wall panels and at boundaries of different cladding/walling systems.
3. Around windows, doors and rooflights; between window or doorframes and walls
or floors, between doors and windows and their frames, between frames and sills.
4. Through gaps in membranes, linings and finishes; in wall membranes and dry
linings, in ceiling linings and boundaries with wall linings, gaps in floor finishes and
around skirtings
5. At service penetrations; electrical sockets and conduits, gas and electricity entry
points, ventilation pipes for sanitary waste, overflow pipes and flues.
6. Around access and emergency openings; to roof space, to roof, to floors, to
services and delivery points.
Through permeable materials; some materials, such as brickwork cladding, are not
impermeable to air, and may be very permeable if construction quality is low.
-Figure 5. Potential air leakage pathways in generic office building
Source: Perera et al. 1994
[image:34.612.91.433.60.403.2]-2.5 Summary
This chapter has outlined the origins of building airtightness testing and has given an
overview of the historical airtightness of buildings in the UK and abroad. An account
has been made of the regulations and recommendations in force for the testing of
buildings in the aforementioned countries. An introduction has also been provided into
the major sources of building air leakage. The following chapter will summarise the
theory used to support the airtightness testing of buildings. Methods for calculation and
interpretation of results will be presented, along with an assessment of infiltration heat
loss and the equivalent leakage area.
-Chapter 3 Theory
3.1 Steady state pressure measurements
Steady state (DC) assessment of building airtightness performance involves establishing
a pressure difference Ap across the envelope. This can be achieved utilising portable
fans temporarily installed in a doorway, or other suitable opening. HVAC plant is
switched off and all external doors closed. Measurements taken o f the flow rate Q
across the fans and Ap across the envelope allow a relationship to be established
between the two. This can be defined in terms of the power law equation given in
Chapter 1:
Q =C (Ap)n (1.1)
where C and n are constants that are assumed to relate to the geometry of a single
opening in the building envelope. The building envelope is subjected to differential
pressures ranging from 20 up to 100 Pascal. If a pressure differential of at least 25
Pascal cannot be obtained then the test is deemed to be invalid. Values for C and n are
calculated using least square regression analysis. The flow rate required to obtain a
differential pressure is a function of the building envelope area. Very large buildings
will therefore require a fan with a large volume flow rate.
3.2 Least square pow er law
The results from a steady state building test will give a dataset comprising of building
differential pressures (APenv) and corresponding fan flow rates (Q). There are a number
of curve fitting approximations available to produce a best fit line between these points.
-The most straightforward of these is the least squares approximation. For this, the
straight line
y = mx + b (3.1)
should be fitted through the given points (xj, yO ,....,(xn , yn) so that the sum of the
squares of the distances of those points from the straight line is minimum, where the
distance is measured in the vertical direction (the y-direction).
The calculation of the factors m and b for a given pressurisation test are as
follows:-dSumXY = Z ( In APenv * In Qc) (3.2)
dSumXX = I ( In APenv * In APenv) (3.3)
dSumX = X(In APenv) (3.4)
dSumY = I ( l n Q c) (3.5)
m = (dSumX * dSumY - Numpnts * dSumXY) / (dSumX * dSumX - dSumXX
* Numpnts) (3.6)
b = (dSumX * dSumXY - dSumXX * dSumY) / (dSumX * dSumX - dSumXX *
Numpnts) (3.7)
3.3 Air leakage index vs. air permeability calculation methods
Building pressure tests using the steady state (DC) method are usually reported at a
reference internal to external building pressure of 50 Pascal. The flow rate through the
fan(s) required to maintain this pressure is known as Q5 0. When the fan(s) used are only
capable of producing a low flow rate (Orme 1995) then the reference pressure for
calculations may be set at 25 Pascal, with a fan flow rate recorded at Q 2 5 . Tests to large
buildings have traditionally required a minimum building pressure of 25 Pascal with the
recorded data extrapolated to 50 Pascal to give a result at fan flow rate Q50 (CIBSE
TM23:2000).
-There are two criteria that may be used to report an airtightness test using steady state
techniques. These are the air leakage index and air permeability index of a building.
Both methods of calculation entail the determination of fan flow rate Q n r s' into the
building at a reference pressure of 50 Pascal. Q is then multiplied by 3600 to give the
flow rate Q m3h 1. This figure is then divided by the externally exposed envelope area
3 1 9
of the building under test to give a result of X m h 'm ' . It is the definition of envelope
area that determines the criteria. The air leakage index entails the summation of the
surface area of the walls and roof exposed to the external environment to calculate the
envelope area. The air permeability of the building is devised by summation of the
surface area of the solid ground floor, walls and roof. The calculations are as follows:
-Calculation of Air Leakage Index, ALI
Q5o = C * (5 0 )n
Air Leakage Index = 3600 * Q50 / S
Calculation of Air Leakage Permeability Index, API
Q50 = C * (A P )n (3.10)
Air Permeability Index = 3600 * Qa p i / S + F (3.11)
Where S = exposed surface area of walls + roof
F = area of solid ground floor
(3.8)
(3.9)
-In the UK, measurements have traditionally been reported using the air leakage index
criteria (Potter and Jones 1992, Potter 1998). The vast majority of new buildings
include a virtually impermeable concrete floor, therefore making the air leakage index a
more stringent standard. As a rough approximation an air permeability result of 10 m 3h'
W2
would equate to an air leakage index of 14nrVW2.
This relationship is whollydependent on the design of the building.
The current Part L Building Regulations specify the air permeability calculation method
as the criterion for testing of new buildings. This is in line with CIBSE TM23: 2000
and the CEN 13829 standard upon which it is based. Potter (2000) argues that the air
permeability criterion is not a fair method upon which to judge the envelope airtightness
performance of new buildings. He states that “If one compares office buildings of
single storey, five storey and ten storey with the same net floor area with an air
permeability of 10
mVm'2,
then the single storey building would have to beconsiderably less airtight than multi-storey buildings. Equally large footprint buildings
need to be less airtight than smaller ones”. Testing by HRS Service Ltd has shown that
large warehouses and retail buildings can easily pass current building regulations with
little attention to airtightness during construction (see Section 5.2).
3.4 Effective leakage area
The total leakage area for a building can be represented as an effective leakage area,
ELA, which represents a single opening having the same airflow leakage. This can be
helpful on site to conceptualise the amount of further sealing required to attain a
building airtightness specification. The effective leakage area is calculated
-ELA = Q * ((p/2Ap)°'5/CD) (3.12)
Q = airflow rate (m3 s '1)
p = air density (kg m~3)
AP = pressure difference across the opening (Pa)
0.5 = exponent for large openings
Cd = discharge coefficient (set to 1 . 0 or * 0 . 6 depending on the
shape of the orifice)
The reference pressure differential across the building envelope during an airtightness
test is 50 Pa. Naturally occurring pressures from wind are generally much lower than
this. For this reason it is normal to quote the effective leakage area at between 4 Pa and
10 Pa (ASHRAE Fundamentals Handbook 2001). The value of Q at these low pressure
differences may be extrapolated down from those during the test using the flow
equation (1). Transforming the power law equation using natural logarithms
gives:-ln(Q) = ln(C) + n.ln(AP) (3.13)
3.5 Calculation o f infiltration heat loss
The natural air change rate of a building may be roughly calculated from an air leakage
test. For domestic buildings it has been found that the natural air change rate
(infiltration) is approximately equal to 1/20 of the 50 Pa air leakage rate. W ith the air
leakage rate equal to Q50/V (Q50 being the leakage airflow rate per hour at a pressure
differential of 50 Pa across the building envelope and V being the internal volume o f the
building). The association will become stronger with an increasingly airtight building.
On a very leaky building it is very difficult to estimate the air change rate.
-This l/2 0 th calculation for domestic buildings has not been effective in modelling the air
change rates of non-domestic buildings. The BRE have carried out research, using
tracer gas techniques, into this area and have found that the relationship is improved by
incorporating the surface to volume ratio of the building into the calculation. This gives
the relationship of
I s 1/ * * 7 v * Q5° / s (3.14)
I = infiltration rate in air changes per hour ( h 1)
S = exposed surface area of walls and roof (m2)
V = internal volume of the building envelope ( n r )
Equation 3.13 was found by HRS to give some low values for air change rate on
buildings tested in comparison to BSRIA rules of thumb (Boushear 2001). The
simplified form for this equation was found to give a more reasonable estimation.
I = V6o* Q50/s (3.15)
Using the air infiltration rates calculated from the previous equation, an approximation
of the thermal load can thus be calculated using the following equation
total no of hours
E = 2 3600pCpQi(Tint(i)_Text(i)) (J) (3.16)
1=1
-E = thermal load ( J )
p = air density (kg/m3)
Cp = specific heat capacity of air (J/kg. K)
Qi = combined air infiltration and ventilation rate at hour (m3/s)
T i n t ( i ) = indoor air temperature at hour, I, (K)
T e x t ( i ) = outdoor air temperature at hour, I, (K)
This may be approximated, assuming a constant air change rate and representing
temperature variation by degree-days.
E = Q*DD*24*3600pCp (J) (3.17)
where DD = number of degree days
The degree-day measurement is a method of tracking and evaluating the difference
between the internal and external temperatures. It is calculated by averaging the
number of degrees temperature difference over a day, that the external temperature is
below a set base internal tempe