DEVELOPMENT AND VALIDATION OF STABILITY-INDICATING
HPTLC METHOD FOR DETERMINATION OF BOCEPREVIR
Mrinalini C. Damle* and Sunny R. Salunke
AISSMS College of Pharmacy, Kennedy Road, Near RTO, Pune-411001.
ABSTRACT
A simple, accurate, precise and rapid validated stability indicating HPTLC method of Boceprevir was successfully developed. This method is based on HPTLC separation followed by UV detection at 215 nm. The separation was carried out on merck TLC aluminium sheets precoated with silica gel 60F254 using Ethyl Acetate:Toluene
(6:4, v/v) as a mobile phase. Boceprevir gave well defined and sharp peak at Rf 0.42 ± 0.02. Calibration curve was linear in range
2000-10000 ng/band. Stress degradation study shows that sample degraded with acid and base hydrolysis, under oxidation, thermal and photolytic stress conditions. The peak purity parameter ensured noninterference by product of degradation. This method can be applied to determination of stability of Boceprevir. The suitability of this HPTLC method for quantitative determination of Boceprevir was proved by validation in accordance with requirements of ICH guidelines.
KEYWORDS: Boceprevir, HPTLC, Forced degradation, Validation.
INTRODUCTION
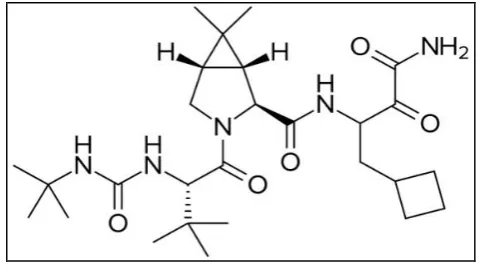
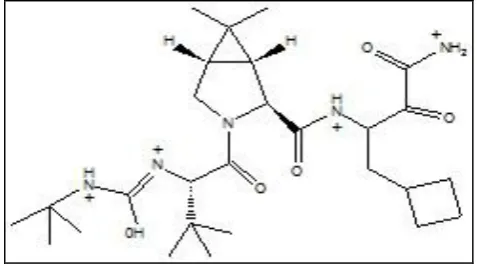
Boceprevir is 3-{[(1R,2S,5S)-3-[(2S)-2-[(tert-butylcarbamoyl)amino]-3,3-dimethylbutanoyl]-6,6-dimethyl-3azabicyclo[3.1.0]hexan-2-yl]formamido}-4-cyclobutyl-2-oxobutanamide. Boceprevir is a direct acting protease inhibitor for the treatment of hepatitis C[1]. Boceprevir contains 5 chiral centres, four of them have a fixed stereochemical configuration controlled during the synthesis and the last one is obtained as a mixture of 2 configurations R and S. Thus, Boceprevir is manufactured as an equal mixture of two diastereoisomers in an approximate amount of 1:1.[2]
Volume 5, Issue 8, 961-973. Research Article ISSN 2277– 7105
*Corresponding Author
Dr. Mrinalini C. Damle
AISSMS College of
Pharmacy, Kennedy Road,
Near RTO, Pune-411001. Article Received on 30 May 2016,
Revised on 20 June 2016, Accepted on 11 July 2016
Fig 1: Chemical structure of Boceprevir
A thorough literature search indicate that there are some methods reports for estimation of boceprevir by HPLC[3] and UPLC-MS/MS[4,5] methods. There is no Stability-Indicating HPTLC Method (SIM) have been reported for Boceprevir. Hence, considering inherent advantage of HPTLC over HPLC, the objective of current work was to develop Stability-Indicating HPTLC Method (SIM) as per ICH Q1A (R2) guidelines. It was aimed to establish inherent stability of the Boceprevir through stress studies under a variety of stress conditions and to develop a validated Stability-Indicating Assay method.
MATERIALS AND METHODS Chemicals and reagents
Working standard of Boceprevir was kindly supplied by Mylan Laborotories Ltd. (Hyderabad) India. Ethyl Acetate, Toluene and methanol (HPLC grade) were purchased from Merck specialties Pvt. Ltd. (Mumbai, India).
Instrumentation and chromatographic conditions
Precise analytical weighing balance (Shimadzu AY120) was used for weighing. Chromatographic separation of drug was performed using aluminium plate precoated with silica gel 60 F254 (10 ×10) with 250 µm thickness (E. MERCK, Darmstadt, Germany) using a
CAMAG Linomat 5 sample applicator (Switzerland). Samples were applied on the plate as a band with 6 mm width using Camag 100 μL sample syringe (Hamilton, Switzerland). Thermal degradation study was carried out in hot air oven (Make - Kumar lab).
were dried in a current of air. Densitometric scanning was performed on CAMAG thin layer chromatography scanner at 215 nm operated by WINCATS software version 1.4.2. The source of radiation utilized was deuterium lamp emitting a continuous UV spectrum between 200 to 400 nm.
Preparation of Stock Solution
Standard stock solution of Boceprevir was prepared by dissolving 100 mg of drug in 10 ml of methanol to get concentration of 10000 µg/ml. from which 1 ml was further diluted to 10 ml with methanol to get concentration of solution 1000 µg/ml
Selection of Detection Wavelength
[image:3.595.145.449.364.522.2]The UV spectrum of Boceprevir (100 μg/ml) solution was obtained over the range of 200-400 nm. It was observed that drug showed considerable absorbance at 215 nm. So, wavelength 215 nm was selected as the wavelength for detection.
Fig. 2: UV Spectrum of Boceprevir (100µg/ml)
Stress degradation studies of bulk drug
The forced degradation studies were carried out on bulk drug substance in order to prove the stability-indicating property and selectivity of the developed method. The degradation was carried out under acid, base and neutral hydrolytic, oxidative, thermolytic and photolytic conditions.[6,7]
Acid treatment
The 6 µl of resulting solution was applied on TLC plate and developed under optimized chromatographic condition.
Alkali treatment
1 ml working standard solution of Boceprevir (10000 µg/ml) was mixed with 1 ml of 0.1 N methanolic sodium hydroxide (NaOH) and 8 ml of methanol. Solution was kept at room temperture for 1 hour. The 6 µl of resulting solution was applied on TLC plate and developed under optimized chromatographic condition.
Neutral Hydrolysis
5 ml working standard solution of Boceprevir (10000µg/ml) was mixed with 5 ml of water and 40 ml of methanol. Solution was refluxed for 1 hour. The 6 µl of resulting solution was applied on TLC plate and developed under optimized chromatographic condition.
Oxidative degradation
1 ml working standard solution of Boceprevir (10000µg/ml) was mixed with 1 ml of 3% v/v methanolic Hydrogen peroxide (H2O2) and 8 ml of methanol. Solution was kept at room
temperture for 1 hour. The 6 µl of resulting solution was applied on TLC plate and developed under optimized chromatographic condition.
Degradation under dry heat
Dry heat study was performed by keeping drug in oven at 80ºC for period of 12 hours. A sample was withdrawn at appropriate times, weighed and dissolved in methanol to get solution of 1000 µg/ml. 6 µl of the resulting solution was applied to HPTLC.
Degradation under Photolytic conditions
Photolytic degradation studies were carried out by exposure of drug to UV light up to 200 watt hours /square meter and subsequently to fluorescence light illumination not less than 1.2 million lux hours. Sample was weighed, dissolved in methanol to get concentration of 1000 µg/ml. 6 µl of theresulting solution was applied to HPTLC.
RESULTS AND DISCUSSION
Optimization of chromatographic conditions
Fig. 3: Representative densitogram of standard solution of Boceprevir (6000ng/band, Rf
= 0.42 ± 0.02)
Results of forced degradation studies
Forced degradation study showed that the method is highly specific and there was no interference of degradation products observed at retention factor of drug.
Acid treatment
In Acid hydrolysis condition, 28.90 % degradation of Boceprevir was observed with the product of degradation at Rf = 0.04 ± 0.02. The representative densitogram obtained from
acid treatment after refluxed for 15 min. figure 4 respectively.
[image:5.595.144.452.512.727.2]Fig. 5: Overlay of UV spectra of boceprevir drug and degradation product
Alkali treatment
In Acid hydrolysis condition, 28.90 % degradation of Boceprevir was observed with the product of degradation at Rf = 0.25, 0.41 and 0.59 ± 0.02. The representative densitogram
obtained from alkali treatment after 12 hours. figure 5 respectively.
[image:6.595.140.459.470.711.2]Fig. 7: Overlay of UV spectra of boceprevir drug and degradation product Oxidative degradation
Oxidative Degradation
Boceprevir when treated with 3% v/v H2O2 i.e. oxidative degradation, 15.78 % degradation
was observed.
Neutral Hydrolysis
In neutral hydrolysis condition, 9.05 % degradation of Boceprevir was observed.
Dry heat degradation studies:
When the drug substance was exposed to dry heat at 80º C for 12 hrs.10.28% of degradation was observed.
Photodegradation Studies
Boceprevir exhibited 50.0 % of degradation, when exposed to ultraviolet light (200 Watt hours/Sequre meter) and 24.2 % of degradation when exposed to fluorescence light (1.2 million lux hours).
LCMS CONDITIONS
[image:7.595.149.450.75.283.2]CHARACTERIZATION OF DEGRADATION PRODUCT BY LCMS Alkali treatment
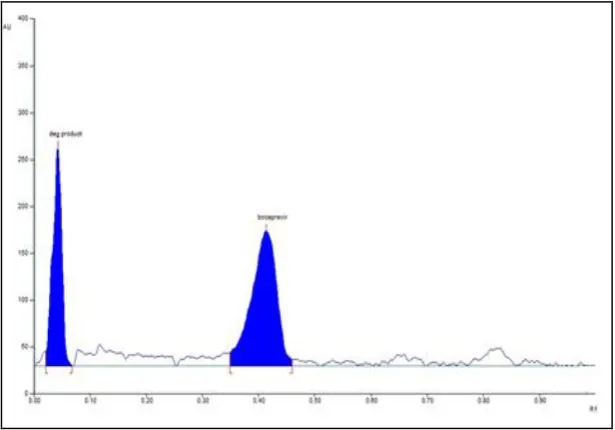
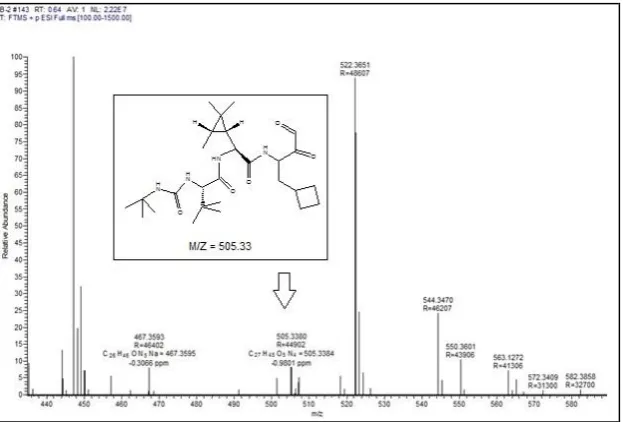
[image:8.595.142.455.201.396.2]From LC-MS data the degradation product which was observed in alkali degradation sample shows protonated molecular ion at m/z = 505.33. The possible probable structure of the degradation product (m/z = 505.33) was shown in fig. 9.
Fig. 8: Chromatogram obtained from base induced degradation product
Fig. 9: LCMC spectra of alkali degradation product
Probable Reaction Mechanism A) Cleavage of ring
[image:8.595.143.455.433.644.2]B) alkaline hydrolysis of amide Acid treatment
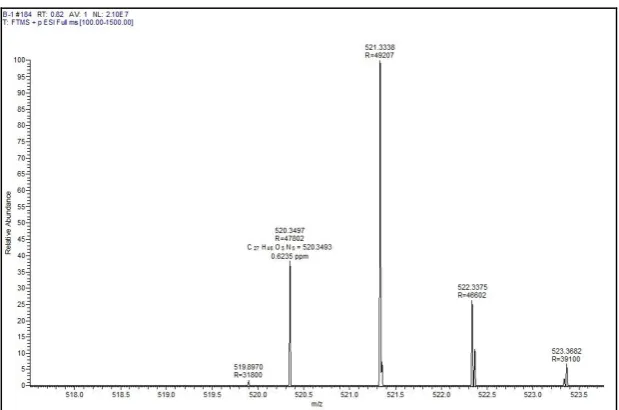
[image:9.595.142.453.207.410.2]From LC-MS data the degradation product which was observed in acid degradation sample shows protonated molecular ions at m/z = 520.34, 522.33, 521.33. The possible probable structure of the degradation product (m/z = 520.34, 522.33, 521.33.) was shown in fig. 11. And 12.
Fig. 10: Chromatogram obtained from sample subjected to acid degradation
Fig. 11: LCMC spectra of acid reflux degradation product
Probable Reaction Mechanism A) Toutomerism
[image:9.595.143.453.445.650.2]Fig. 12: formation of quaternary compound
The forced degradation studies data is summarized in Table 1.
Table 1: Data of forced degradation studies of Boceprevir
Stress conditions/ duration % Recovery % Degradation
Rf values of degraded Products
Acidic hydrolysis / 1 N HCl
reflux for 15 min. 71.09
28.90 % 0.04
Alkaline hydrolysis /0.1 N NaOH/ kept at room tempeture for 1 Hr.
75.18 24.82 % 0.25,0.59,78
Oxidative /3 % v/v H2O2 / kept at
room tempeture for 3 Hr. 84.22 15.78 % - Neutral hydrolysis /H2O reflux
for 1 hr 90.95 9.05 %
-
Dry heat/ 80ºC/ 12 hours 89.72 10.28 % - UV light
(200 Watt hours/Sequre meter) 50.0 50 - Fluorescence light
(1.2 million lux hours). 75.8 24.2 -
Validation of the method
The method was validated for various parameter in accordance with ICH guidelines.[8]
1. Specificity
The developed method was specific for analyte. The specificity of the method was ascertained by peak purity profiling studies. The peak purity values were found to be more than 0.9996, indicating the no interference of any other peak of degradation product.
2. Assay
lactose. Spiked blend (SB) was assayed and used for accuracy studies. To determine accuracy, 200 mg blank blend and 800 mg drug were mixed properly and finally 1000 mg SB were prepared. Blend equivalent to 10 mg of drug was transferred to 10 mL volumetric flask and was diluted with methanol, sonicated for 10 min and volume made to 10 mL (1000 µg/mL). Solution was filtered 4 µl volumes was applied on plate
Table 2: Assay of Spiked blend powder
Sr. No. Peak area Of Boceprevir
Amount Recovered
(ng/band) % assay
1 4985.23 3942.01 98.55 2 5012.1 3968.75 99.21 3 5002.14 3958.84 98.97 4 5100 4056.22 101.4 5 4900 3857.19 96.42 6 5021.11 3977.71 99.44 Mean 5003.43 3960.12 99.003
SD 64.41 64.09 1.602 %RSD 1.2873 1.6185 1.6185
3. Linearity and range
The standard stock solutions of Boceprevir (1000µg/ml) were applied by spotting on TLC plate in range of 2, 4, 6, 8 and 10 µl. Straight-line calibration graphs were obtained y = 1.0049x + 1023.7 in the concentration range 2000-10000 ng/band with high correlation coefficient > 0.99.
4. Accuracy
[image:11.595.130.464.208.371.2]To check accuracy of the method, recovery studies were carried out by adding standard drug to sample at three different levels 80, 100 and 120 %. Basic concentration of sample was 4000 ng/band from SB. The drug concentrations were calculated from respective linearity equation. The results of the recovery studies indicated that the method is accurate. The results obtained are shown in Table 2.
Table 3: Recovery studies of Boceprevir
Drug Amount taken
(ng/ band)
Amount added (ng/ band)
Total Area
found % Recovery % RSD
Boceprevir
5. Precision
A set of three different concentrations in three replicates of standard solutions of Boceprevir were prepared. All the solutions were analyzed on the same day in order to record any intraday variations in the results. Intra-day variation, as RSD (%), was found to be in the range of 0.35 to 1.23. For Inter day variation study, three different concentrations of the standard solutions in linearity range were analyzed on three consecutive days. Interday variation, as RSD (%) was found to be in the range of 1.24 to 1.48. The lower values of % R.S.D. (< 2) indicated that method was found to be precise.
6. Limit of detection (LOD) and Limit of quantitation (LOQ)
LOD and LOQ were calculated as 3.3 σ/S and 10 σ/S, respectively; where σ is the standard deviation of the response at lowest concentration in range and S is the slope of the calibration plot. The LOD and LOQ were found to be 157.76 ng/band and 478.07 ng/band respectively.
7. Robustness Studies
Robustness of the method was determined by carrying out the analysis under conditions during which mobile phase composition, chamber saturation time was altered and the effect on the area of drug was noted. Robustness of the method checked after deliberate alterations of the analytical parameters showed that areas of peaks of interest remained unaffected by small changes of the operational parameters (% R.S.D. < 2). The results are given in Table 3.
Table 4: Robustness Data in Terms of Peak Area (% RSD)
Sr. No. Parameter (% RSD)
1 Mobile phase saturation time 10 min and 20 min 1.51 2 Mobile phase variation chloroform 9.8 and 10 ml 1.47 *Average of three determinations
CONCLUSION
The developed method is stability indicating, since the drug peak was found to be pure as confirmed by peak purity profiling study. This proves that there is no interference of degradation product in analytical peak. The method is specific, accurate, precise, and robust and can be used for routine quality control as well as assessing the stability of Boceprevir.
ACKNOWLEDGEMENT
We also thankful to Mylan Laboratories Ltd.(Hyderabad), India. for providing us Boceprevir as gift sample.
REFERENCES
1. http://www.drugbank.ca/drugs/DB08873 (accessed on 02/05/2016)
2. European medicines agency,an agency of European union, assessment report, victrelis, 26 may 2011, procedure no,: EMEA/H/002332
3. Shiny. G., D.Satyavati. Development and validation of RP – HPLC method for the analysis of boceprevir and related impurities in bulk and pharmaceutical dosage forms, Indo Ame. Jour. P.R., 2015; 5(6): 2391-2401.
4. Antonio D, Danilo A, A UPLC–MS/MS method for the simultaneous plasma quantification of all isomeric forms of the new anti-HCV protease inhibitors boceprevir and telaprevir, J. O. P. Bio., 2013; 78–79: 217–223.
5. Zoubir D, Atherine F, Validation of a fast method for quantitative analysis of elvitegravir, raltegravir, maraviroc, etravirine, tenofovir, boceprevir and 10 other antiretroviral agents in human plasma samples with a new UPLC-MS/MS technology, J. O Pharma. Bio, 2013; 86: 100–111.
6. International Conference on Harmonization (ICH), Stability testing of new drug substances and products, Q1A (R2), 2003.
7. International Conference on Harmonization (ICH), Photo stability testing of new drug substances and products, Q1B.