www.wjpr.net Vol 4, Issue 4, 2015. 1690
ANALYTICAL METHOD DEVELOPMENT AND VALIDATION OF
OLANZAPINE IN FORMULATED PRODUCT
Navya Khandelwal1, Tapeesh Bharti2*, Chatrasal Singh Rajput2 and R P S Rathore1
1
Department of Quality Assurance, B.N College, Udaipur, India. 2
Jubilant Chemsys Ltd., B-34, Sector 58, Noida, U P India. ABSTRACT
A novel approach was carried out to develop and validate a rapid and selective analytical method by using Reverse Phase Ultra Performance Liquid Chromatographic (RP-UPLC) technique for the analysis of Olanzapine in raw materials, their pharmaceutical dosage forms. The developed analytical UPLC method is superior in technology to conventional HPLC method with respect to speed, resolution, solvent consumption and cost of analysis. Elution time for the separation was 3.5 min in reverse phase mode and ultra violet detection was carried out at 254 nm. Efficient separation was achieved on Water Acquity BEH C18 column (50 × 2.1 mm, 1.7μm) UPLC column using 0.1% v/v TFA and acetonitrile as organic solvent in a gradient. The olanzapine sample was first dissolved in ethanol and the final dilution done by using water:acetonitrile (50:50 v/v) as diluent. The method showed excellent recoveries for all drugs in bulk. The test solution was found to be stable in diluent for 72 h when stored at RT (i.e 25 oC) . Recovery data were in the range 96.74 to 101.35%. The developed UPLC method was validated with respect to linearity, precision, accuracy, stability and specificity. The method was economical in terms of the time taken and the amount of solvent used. To the best of our knowledge, a validated reverse phase analytical method for the analysis of olanzapine by using UPLC technique disclosed in this investigation was not published elsewhere.
KEYWORDS: Olanzapine, UPLC, new method development, validation.
INTRODUCTION
Olanzapine is an atypical antipsychotic that belongs to thienobenzodiazpine class, used for the treatment of schizophrenia and bipolar disorder. Olanzapine has the chemical name
2-Volume 4, Issue 4, 1690-1699. Research Article ISSN 2277– 7105
Article Received on 19 March 2015,
Revised on ---, Accepted on 26 March 2015
*Correspondence for
Author
Tapeesh Bharti
Jubilant Chemsys Ltd.,
B-34, Sector 58, Noida,
www.wjpr.net Vol 4, Issue 4, 2015. 1691 Methyl-4-(4-methyl-1-piperazinyl)-10H-thieno[2,3-b][1,5]benzodiazepine (Figure 1). In literature many analytical methods are specified for the determination of Olanzapine. Some UV-spectrophotometry,[1] visible spectrophotometry,[2-9] kinetic spectrophotometry,[10] capillary zone electrophoresis and linear voltammetry,[11] Titrimetry[12] have been reported for the quantification of Olanzapine in pharmaceuticals. High performance thin layer chromatography (HPTLC) has been used to quantify Olanzapine in pharmaceutical. High performance liquid chromatography[13] (HPLC) with UV detection has been used for the determination of the drug in human blood serum and blood plasma.[14-19] The reported HPLC methods are more time consuming, complex mobile phase mixtures, use high flow rate of analysis, lack of sensitivity and peak symmetry. However there was some report available on the estimation of Olanzapine by UPLC method.[20] The purpose of the present study was to develop a simple, sensitive, accurate and precise and time-saving UPLC method for the determination of Olanzapine. The developed method has been validated by evaluation of the system suitability, specificity, linearity, limits of detection and quantification, precision and accuracy. Hence RP UPLC method was developed for the quantitative determination of olanzapine by using Water Acquity BEH C18 column (50 × 2.1 mm, 1.7μm) UPLC column.
Fig.1. Structure of Olanzapine.
MATERIAL AND METHODS Materials and Reagents
www.wjpr.net Vol 4, Issue 4, 2015. 1692 Chromatographic conditions
Chromatography separation was performed on Waters Acquity UPLC with photodiode array detector. The output signal was monitored and processed using masslynx software. The chromatographic column is Water Acquity BEH C18 column (50 × 2.1 mm, 1.7μm). The mobile phase of 0.1% TFA and acetonitrile in the ratio 80:20v/v at a flow rate of 0.6 ml/min. The detection was monitored at the Wavelength of 254nm. The injection volume was 1.0μL and the chromatographic runtime of 3.5min was used.
Preparation of solutions Preparation of Buffer
Buffer was prepared by dissolving 500 µl TFA in 500 ml Milli-Q water, mixed well, filter through 0.2µ 6,6 Nylon membrane filter paper.
Preparation of mobile phase
The mobile phase was prepared by mixing Buffer: Acetonitrile in a ratio (80:20) and filtered through 0.2µ 6, 6 Nylon membrane filter paper.
Preparation of the Olanzapine Standard & Sample Solution Standard Solution Preparation
Weighed and Accurately transferred 101.12 mg of Olanzapine standard in a 100 ml volumetric flask and added a little quantity of ethanol then sonicated to dissolve it completely and the volume was made up to the mark with the water and Acetonitrile in a ratio (50:50). Further 5.00 ml of the above solution was diluted up to 20.00 ml the water and Acetonitrile in a ratio (50:50).
Sample Solution Preparation
www.wjpr.net Vol 4, Issue 4, 2015. 1693 RESULTS AND DISCUSSION
Method Development
Different chromatographic conditions were experimented to achieve efficiency of the chromatographic system. Parameters such as mobile phase selection, wavelength of detection, column selection, column temperature optimization. Several proportions of buffer and solvents were evaluated in order to obtain suitable composition of the mobile phase. Choice of retention time and run time were the major tasks while developing the method. Method validation
Based on International Conference on Harmonization (ICH) guidelines, the method is validated with regard to system suitability, linearity, accuracy, precision, robustness and sensitivity as follows.
Precision
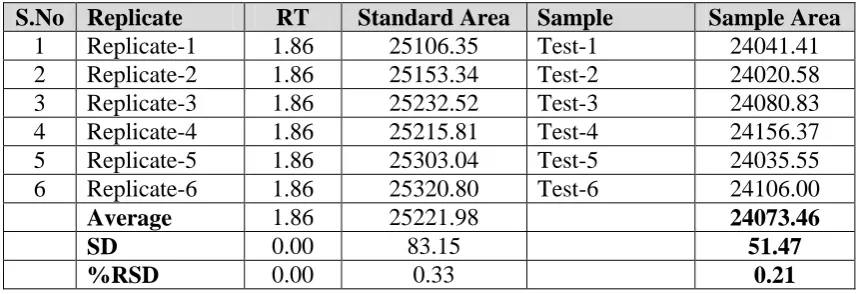
[image:4.595.83.517.469.616.2]The precision of the method was evaluated by carrying out six independent assay of test sample against a qualified reference standard and measurements of peak area response of standard preparation was found to be 0.33. The results are summarized in table 1 and Figure 2, Figure 3.
Table 1: Results of precision (System and Method)
S.No Replicate RT Standard Area Sample Sample Area
1 Replicate-1 1.86 25106.35 Test-1 24041.41
2 Replicate-2 1.86 25153.34 Test-2 24020.58
3 Replicate-3 1.86 25232.52 Test-3 24080.83
4 Replicate-4 1.86 25215.81 Test-4 24156.37
5 Replicate-5 1.86 25303.04 Test-5 24035.55
6 Replicate-6 1.86 25320.80 Test-6 24106.00
Average 1.86 25221.98 24073.46
SD 0.00 83.15 51.47
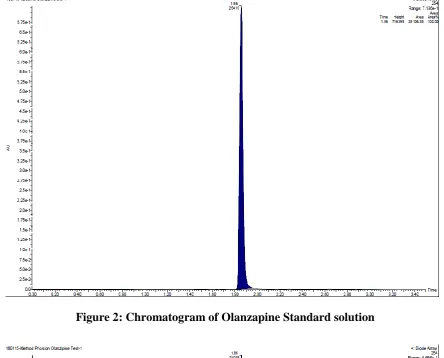
www.wjpr.net Vol 4, Issue 4, 2015. 1694 Figure 2: Chromatogram of Olanzapine Standard solution
www.wjpr.net Vol 4, Issue 4, 2015. 1695 Specificity
The specificity of the method was determined by comparing the chromatograms obtained from the sample containing Olanzapine standard stock with those obtained from test sample of olanzapine and blank of that. The specificity study revealed at the absence of interference of impurities with the drug since no extra peak appeared at the Retention Time of drug.The relative standard deviation for six replicate measurements of peak area response of standard preparation was found to be 1.16.
Reproducibility (Intermediate Precision)
This was performed by assaying the six samples of Olanzapine against qualified reference standard. The %RSD for the relative standard deviation for assay obtained from 6 precision samples was found to be 0.11 and peak area response of six replicate injections of standard solution of Olanzapine was found to be 0.23 %.
Accuracy
Recovery of the assay method for Olanzapine was established by three determinations of test sample using tablets at 50%, 100% and 150% of concentration. Each solution was injected thrice (n=3) into UPLC system and the average peak area was calculated from which Percentage recoveries. All the individual recoveries were found to be between 96.64 to 101.35%. All individual recoveries levels were found to be within 0.02 to 0.14% (%RSD). The results are summarized in table-3.
Table-3: Results of Accuracy
Level Sample area Average area Sample Wt. (mg) Amount added (µg) Amount recovered (µg) % Recovery Average % recovery
SD %
RSD
50%
13430
13420 43.49 434.90
441.09 101.42
101.35 0.14 0.14
13399 440.07 101.19
13431 441.12 101.43
100%
26176
26166 86.98 869.80
859.71 98.84
98.80 0.07 0.07
26145 858.69 98.72
26176 859.71 98.84
150%
38389
38391 130.47 1304.70
1260.83 96.64
96.64 0.02 0.02
38386 1260.73 96.63
38398 1261.12 96.66
Linearity
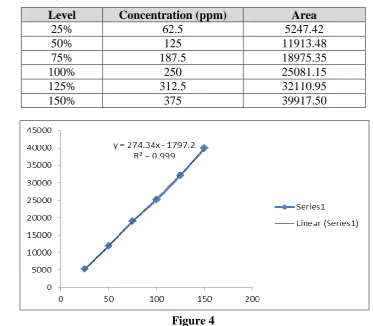
www.wjpr.net Vol 4, Issue 4, 2015. 1696 in six replicates. Calibration curve was constructed by plotting the mean peak area versus concentration which was linear over the concentration range. The Linearity co-efficient of mean response of replicate determination plotted against respective concentration was calculated. The results are summarized in table-4 and Figure 4.
Table-4: Linearity Data
Level Concentration (ppm) Area
25% 62.5 5247.42
50% 125 11913.48
75% 187.5 18975.35
100% 250 25081.15
125% 312.5 32110.95
150% 375 39917.50
[image:7.595.104.478.182.508.2]Area
Figure 4
Stability of Solution
The % Cumulative RSD for standard area and % assay of sample at initial hr and at predetermined time intervals at room temperature was found to be 0.80. The Assay method is also reproducible, gives stability up to 72 hrs.
Hours Sample RT Area Average Area % Assay
0 Hr 1 1.87 26760 26755 99.6
2 1.87 26751
2.5 Hr 1 1.86 26620 26574 98.6
2 1.86 26528
Day 2 1 1.86 26355 26350 98.1
2 1.86 26345
Day 3 1 1.86 26268 26261 97.8
www.wjpr.net Vol 4, Issue 4, 2015. 1697 Robustness
Robustness is the capacity of a metho to remain unaffecte y small eli erate variations in metho parameters. uch as change in flow rate ( 0.10 ml/min), uffer content ( 10 ), temperature ( 5 C).
CONCLUSION
The new, gradient RP-UPLC method proved to be simple, linear, precise, accurate, robust, rugged and rapid. The developed method was capable of giving faster elution, maintaining good separation more than that achieved with conventional HPLC. The short retention time of 1.86 min allows the analysis of a large number of samples in a short period of time and is therefore more cost-effective for routine analysis in the pharmaceutical industries. It is suitable for rapid and accurate quality control of olanzapine in tablet formulations.
ACKNOWLEDGMENT
We would like to sincerely thank Jubilant management in facilitating this work and also the analytical team for generating the spectral data.
REFERENCES
1. S. Firdous, T. Aman, and A.U. Nisa, Determination of Olanzapine by UV Spectrophotometry and non –aqueous titration. Journal of the Chemical Society of
Pakistan, 2005; 27(2): 163-167.
2. K .Basavaiah and S. A. M. Abdulrahman, Sensitive and selective methods for the determination of Olanzapine in pharmaceuticals using N-bromosuccinimide and two dyes. International Journal of ChemTech Research, 2010; 2(1): 660-668.
3. A. Jasinska and E. Nalewajko, Batch and flow injection methods for the spectrophotometric determination of Olanzapine. Analytical Chimica Acta, 2004; 508(2): 165-170.
4. A. Krebs, B. Starczewska, H. Puzanowska-Tarasiewicz, and J. Sled’z, Spectrophotometric determination of Olanzapine by its oxidation with N-bromosuccinimide and cerium (IV) sulphate. Analytical Sciences, 2006; 22(6): 829-833.
5. N. Rajendraprasad, K. Basavaiah, K. Tharpa and K.B Vinay, Quantitative determination of Olanzapine in tablets with visible spectrophotometry using cerium (IV) sulphate and
Average 1.86 26485 98.52
SD 0.01 0.78
www.wjpr.net Vol 4, Issue 4, 2015. 1698 based on redox and complexation reactions. Eurasian Journal of Analytical Chemistry, 2009; 4: 193-203.
6. N. Rajendraprasad, K. Basavaiah, Highly sensitive spectrophotometric determination of Olanzapine using cerium (IV) and iron (II) complexes of 1, 10-phenanthroline and 2, 2 bipyridyl. Journal of Analytical Chemistry, 2010; 65(5): 482-488.
7. K. Basavaiah, A.M.A. Sameer and K.B. Vinay, Newextractive spectrophotometric methods for the determination of Olanzapine in pharmaceutical formulations using bromocresol green. Jordan Journal of Chemistry, 2010; 5: 101-117.
8. N. Rajendraprasad and K. Basavaiah, Determination of Olanzapine by spectrophotometry using permanganate. Brazilian Journal of Pharmaceutical Sciences, 2009; 45(3): 539-550.
9. K. Basavaiah, K. Tharpa, N. Rajendraprasad, S.G. Hiriyanna and K.B. Vinay, Spectrophotometric determination of antipsychotic drug Olanzapine in pharmaceuticals.Jordan Journal of Chemistry, 2009; 4(1): 65-76.
10.A.A. Mohamed, Kinetic and maximum-absorbance spectrophotometric methods for the determination of Olanzapine.Monatshefte f’ur Chemie, 2008; 139(9): 1005-1010.
11.M.A. Raggi, G.Casamenti, R. Mandrioli, G. Izzo and E. Kenndler, Quantitation of Olanzapine in tablets by HPLC , CZE, derivative spectrometry and linear voltammetry.
Journal of Pharmaceutical and Biomedical Analysis, 2000; 23(6): 973-981.
12.K.Basavaiah, N. Rajendraprasad and K.B. Vinay, Microtitrimetric determination of a drug content of pharmaceuticals containing Olanzapine in non-aqueous medium.
Chemical Industry and Chemical Engineering Quarterly, 2009; 15(2): 77-81.
13.K. Basavaiah, A.K.Urdigere Rangachar, K. Tharpa, Quantitative determination of olanzapine in pharmaceutical preparations by HPLC. J.Mex.Chem.Soc, 2008; 52(2): 77-81.
14. O.V. Olesen and K.Linnet, Determination of olanzapine in serum by high-performance liquid chromatography using ultraviolet detection considering the easy oxidability of the compound and the presence of other psychotropic drugs. Journal of Chromatography B:
Biomedical Applications, 1998; 714(2): 309-315.
www.wjpr.net Vol 4, Issue 4, 2015. 1699 16.L. J. Dusci, L.P. Hackett, L. M. Fellows, Determination of Olanzapine in plasma by
high-performance liquid chromatography using ultraviolet absorbance detection. J
Chromatogr B: Anal Technol Biomed Life SCI’, 2002; 773: 191-197.
17.S.Ulrich, Assay of Olanzapine in human plasma by a rapid and sensitive gas chromatography-nitrogen phosphorus selective detection (GN-NPD) method: validation and comparison with high-performance liquid chromatography-coulometric detection.
Ther drug Monit, 2005; 27: 463-468.
18.M. A. Saracino, A Koukopoulos, G Sani, Simultaneous high-performance liquid chromatographic determination of Olanzapine and Lamotrigine in plasma of bipolar patients, 2007;29: 773-780.
19.M.A. Raggi, G. Casamenti, R. Mandrioli. A sensitive high –performance liquid chromatographic method using electrochemical detection for the analysis of Olanzapine and desmethylolanzapine in plasma of schizophrenic patients using a new solid-phase extraction procedure. J Chromatogr B: Biomedical Science Application, 2001; 750: 37-46.