1
Analysis of the 5 iron golf swing when hitting for
maximum distance
Aoife Healy
1, Kieran Moran
2, Jane Dickson
2, Cillian Hurley
2, Alan Smeaton
3, Noel E. OConnor
3, Philip Kelly
3,
Mads Haahr
4and Nachiappan Chockalingam
11
Faculty of Health, Staffordshire University, ST4 2DF, United Kingdom,
2School of Health and Human Performance, Dublin City University, Ireland,
3CLARITY: The Centre for Sensor Web Technologies, Dublin City University, Ireland,
4
Department of Computer Science, Trinity College, Dublin, Ireland
Abstract—Most previous research on golf swing mechanics has focused on the driver club. The aim of this study was to identify the kinematic factors that contribute to greater hitting distance when using the 5 iron club. Three-dimensional marker coordinate data was collected (250 Hz) to calculate joint kinematics at eight key swing events, while a swing analyzer measured club swing and ball launch characteristics. Thirty male participants were assigned to one of two groups, based on their ball launch speed (high : 52.9±2.1 ms−1; low: 39.9±5.2 ms−1). Statistical analyses were used to identify the variables which differed significantly between the two groups. Results showed significant differences were evident between the two groups for club face impact point and a number of joint angles and angular velocities, with greater shoulder flexion and less left shoulder internal rotation in the backswing, greater extension angular velocity in both shoulders at early downswing, greater left shoulder adduction angular velocity at ball contact, greater hip joint movement and X Factor angle during the downswing and greater left elbow extension early in the downswing appearing to contribute to greater hitting distance with the 5 iron club.
INTRODUCTION
Displacing the golf ball a specific distance with the iron clubs, using the full golf swing, is a key element of success in golf. Therefore, to help enhance golfing performance it is important to identify the factors that determine performance of the full golf swing. Comparison of joint kinematics between skilled and lesser skilled golfers provides an important insight into these performance-determining factors. Previous research, however, has focused primarily on the driver club despite the fact that shots for maximum distance are also taken with iron clubs.
Only two studies were identified that examined the effect of skill on joint kinematics of the golf swing with iron clubs (Budney & Bellow, 1982; Cheetham, Martin, Mottram, & St. Laurent, 2001). One of these studies (Cheetham et al., 2001) examined the 5 iron club and focused solely on the X Factor angle around the top of the backswing. The X Factor describes the relative rotation of the shoulders with respect to the hips during the golf swing. The term was first introduced by Jim McLean, who believed that it was more important for driving distance than absolute shoulder turn. His findings demonstrated that the greater the X Factor angle at the top of the backswing, the higher a professional was ranked
on driving distance (McLean, 1992). In contrast to McLean (1992), Cheetham et al. (2001) found that the X Factor angle was not significantly greater in professionals than in amateurs. Budney and Bellows (1982) examined five different clubs including the 3, 6, and 9 irons and the pitching wedge. They detailed for these clubs the left arm angular velocity and left wrist angular velocity at ball contact for a professional golfer. In addition, they compared the wrist angular velocities for two professional and two amateur golfers at impact for the 3, 6, and 9 irons. The results for each club were similar within each golfer but there were differences between the golfers. In particular, the professional golfers were found to achieve greater velocities than the amateur golfers. The only other studies found that examined iron clubs were studies they conducted comparisons between different clubs (Egret, Vincent, Weber, Dujardin, & Chollet, 2003; Lindsay, Horton, & Paley, 2002; Nagao & Sawada, 1973) providing limited information on the biomechanics of the golf swing using the 5, 7, and 9 iron clubs.
2
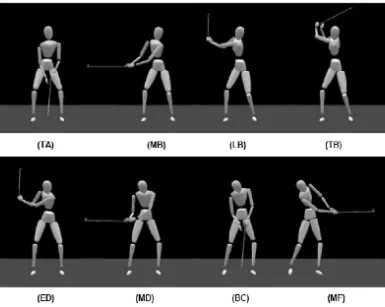
Fig. 1. Eight key events: (TA) Take away, (MB) Mid backswing, (LB) Late backswing, (TB) Top of backswing, (ED) Early downswing, (MD) Mid downswing, (BC) Ball contact, (MF) Mid follow through.
and from approximately the middle of the downswing it uncocked.
As a large number of joints are involved in the golf swing, it is important for research to examine the movement of these joints. In addition, most previous studies (including those on the driver) examined the golf swing at only three distinct events (address, top of the backswing, and ball contact). Recently, however, researchers (Ball & Best, 2007; Chu, Sell, & Lephart, 2010) have identified additional functional events during the swing (see Figure 1). Analysis of these additional events will provide a more comprehensive understanding of the swing.
It is important to note that as biomechanical research of golf is generally conducted in the laboratory, it is not always feasible to measure ball displacement. Club head speed is generally used as the predictor of golfing performance (Bar-rentine, Fleisig, & Johnson, 1994; Lephart, Smoliga, Myers, Sell, & Tsai, 2007; McLaughlin & Best, 1994; Myers et al., 2008). Wallace and colleagues (Wallace, Grimshaw, & Ashford, 1994) stated that there is no direct link between handicap and driving skill. However, Fradkin and colleagues (Fradkin, Sherman, & Finch, 2004) found that club head speed was a valid performance measure. They found that golfers with a lower handicap had faster club head speeds than higher handicap golfers (r = 0.95). Their study participants were 45 male golfers with varying handicaps (2−27) and they used the 5 iron club.
The aim of the present study was to identify the
biomechan-ical performance determining factors of the 5 iron golf swing when hitting for maximum distance through analysis of the kinematics of a range of joints across a number of key events during the swing. It was hypothesized that differences in joint kinematics would be evident between golfers who achieve a large hitting distance and those who achieve a smaller hitting distance.
METHODS
Forty male right-handed golfers aged 33+15 years (mean± s) were recruited from local golf clubs for the study. Ethics approval was received and all participants provided informed consent before testing. All participants were free of injury at the time of the test.
3
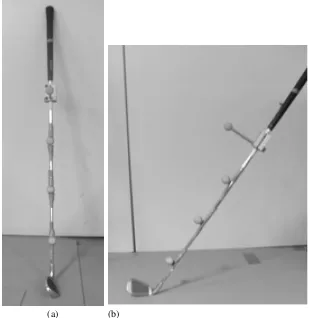
[image:3.612.151.461.54.372.2](a) (b)
Fig. 2. Marker placements on golf club (a) front view (b) side view.
by the manufacturer as follows: ±0.45 ms−1 for club head speed, ±0.45 ms−1 for ball speed, ±1◦ for club face angle, ±2◦ for club head swing-path angle, and ±0.6 cm for club head impact point. For the purpose of the present study, the manufacturers recommended procedures for the analyser were followed. No independent verification or validation of the analyser measurements was performed as part of this study. Previous research has confirmed the manufacturers reported accuracy for club head velocity measurement (Ball & Best, 2007; Moran, McGrath, Marshall, & Wallace, 2009).
Each participant attended one test session. Forty-one re-flective spherical markers (14 mm diameter) were placed on anatomical landmarks on the participant for use with the golf model (Vicon, Oxford Metrics, Oxford, UK). The markers were attached directly to the skin using double-sided tape. The authors acknowledge that reflective markers placed on the skin move relative to the underlying skeletal structures and there-fore some of the recorded movement may be subject to skin movement artifacts. The markers were located on the following anatomical landmarks: left and right temple and back of head, 7th cervical vertebra, 10th thoracic vertebra, clavicle, sternum, right scapula, left and right acromio-clavicular joint, upper arm, epicondyle of the elbow, forearm, lateral wrist, medial wrist, finger (just below the head of the second metacarpal), anterior superior iliac spine, posterior superior iliac spine, thigh, epicondyle of the knee, shank, lateral malleolus, calca-neous, and the second and fifth metatarsal heads. Four markers
were also placed on the golf club, three of which attached directly to the shaft of the club and one was placed at the end of a solid metal bar attached to the club via a metal clamp (see Figure 2).
The participants were allowed 3 min of practice swings to accustom themselves to the set-up. The test session consisted of recording 15 golf swings with the participants instructed to hit the ball as hard as possible towards the target-line, with the aim to maximize both distance and accuracy, as if in a competitive situation.
The ball speed results from the swing analyser for each participants 15 golf swings were examined. In our laboratory, it was not possible to measure the distance the ball travelled and so ball speed was used as the performance determinant, as it is a valid indicator of the distance the ball travels.
Participants were ranked based on their average ball speed for their 15 golf swings. To create two distinct groups with regard to ball speed, the median speed for all participants was calculated (48.5 ms−1). Due to the similarity in results of
the central 10 participants, the five participants whose average ball speed was immediately above (49−49.5 ms−1) and the
4
are presented in Table I.
TABLE I
PARTICIPANTS DEMOGRAPHICS(MEAN±S).
High ball speed Low ball speed
(n = 15) (n = 15) P Age (years) 27.5±10.0 41.4±18.0 0.02 Weight (kg) 78.8±7.19 82.3±10.9 0.31 Height (cm) 179.9±5.2 176.4±7.0 0.12 Ball speed (ms−1) 52.9±2.1 39.9±5.2 <0.001∗
Handicap# −4.3±4.1 −11.3±4.6 <0.001∗
#A handicap of 0 represents a scratch golfer; a negative handicap
represents a below scratch golfer; a positive handicap represents an above scratch golfer.
∗Significant difference (P≤0.01) between groups.
The authors acknowledge that this method of grouping participants is not without limitations. This method uses ball speed solely to predict golfing performance. While ball speed is a major factor in determining the distance the ball travels, it does not take into account the accuracy of the shot.
Joint kinematics were only examined for each participants top three trials with regard to ball speed. The three trials were assessed individually and then averaged to give a represen-tative value. Marker data were filtered using the Woltring filter routine with an MSE value of 9 (Woltring, 1986). X Factor, shoulder, elbow, wrist, hip and knee angles and angular velocities were calculated using the golf model (Vicon BodyLanguage model, Oxford Metrics Ltd., UK). Table II provides definitions for joint angle variables. The angle and angular velocity of each variable were obtained at each of eight key events during the swing (Figure 1), which have been defined previously by Ball and Best (2007). These key events were identified manually using the markers attached to the golf cub.
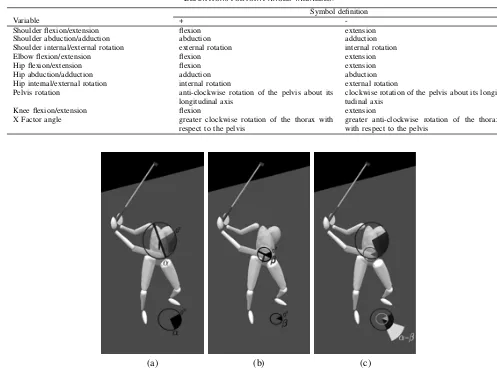
Recently, researchers (Lephart et al., 2007; Myers et al., 2008) have calculated the torso and pelvis angles by pro-jecting a line from the left and right of each segment onto the global horizontal plane (the ground) and calculating the angle between them. The X Factor angle is then subsequently calculated as the differential between these two angles (global plane method). When standing upright, rotation about the longitudinal axis of the pelvis and the torso is in the global horizontal plane (i.e. the plane this method uses to calculate the X Factor angle). However, in golf a forward tilting posture of the pelvis and torso occurs that results in the horizontal plane of these body segments no longer being parallel to the global horizontal plane. Therefore, when the X Factor angle is calculated using the global plane method errors may be introduced. This has been shown to be true for the thorax by Wheat and colleagues (Wheat, Vernon, & Milner, 2007). In the present study, the rotation of the torso and pelvis body segments about their own longitudinal axes was determined and then the X Factor angle was calculated as the difference between these two angles (see Figure 3). Four markers were used to define both the thorax (7th cervical vertebra, 10th thoracic vertebra, clavicle, and sternum) and pelvis segments (left and right anterior and posterior superior iliac spine).
It should be noted that all kinematic variables were cal-culated using the proprietary software (Vicon −Workstation,
using the Golf model, which is a variation on the general full body model Golem). The model and the plugin used within these analyses are explained elsewhere (Vicon, 2002). Furthermore, each trial was analysed separately and the data were extracted for further analysis, eliminating the risk of unwanted noise in the data.
Independent t-tests were used to assess differences between the two ability groups with a total of 75 variables compared. The use of Bonferroni adjustments when multiple statistical tests are performed has been criticized (e.g. Perneger, 1998; Savitz and Olshan, 1995). Therefore, to account for the multiple comparisons in the present study, a P-value 0.01 was considered significant. This level of significance has been employed in recent golf research (Ball & Best, 2007; Zheng, Barrentine, Fleisig, & Andrews 2008) involving multiple com-parisons.
RESULTS
Golf swing characteristics for both groups as measured by the swing analyser are shown in Table III. At the moment of ball contact, the high ball speed group contacted the ball significantly closer to the centre of the club face than the low ball speed group (−0.74± 0.68 cm vs.−1.95± 0.69 cm; t = 4.8, P <0.001). No differences were evident between the two groups for club face angle, tempo, or club rotation.
Although there was no significant difference between the groups for the overall duration of the swing (tempo), differ-ences were evident between the groups during the downswing (Table IV), with the high ball speed group completing the events of early downswing through to mid-follow-through significantly faster than the low ball speed group.
Table V details the joint angle variables that were sig-nificantly different between the groups at each of the eight swing events. Selected pertinent angular velocity results are also provided. At seven of the eight swing events, at least one significant difference in joint kinematics was observed between the groups. No significant differences between the groups were evident at the start of the golf swing (the takeaway event).
DISCUSSION
As few studies have examined the effect of skill on partic-ipant kinematics when using iron clubs (Budney & Bellow, 1982; Cheetham et al., 2001), where appropriate studies that have examined the effect of skill using the driver club will be included for comparative purposes.
5 TABLE II
DEFINITIONS FOR JOINT ANGLE VARIABLES.
Symbol definition
Variable +
-Shoulder flexion/extension flexion extension Shoulder abduction/adduction abduction adduction Shoulder internal/external rotation external rotation internal rotation Elbow flexion/extension flexion extension Hip flexion/extension flexion extension Hip abduction/adduction adduction abduction Hip internal/external rotation internal rotation external rotation Pelvis rotation anti-clockwise rotation of the pelvis about its
longitudinal axis
clockwise rotation of the pelvis about its longi-tudinal axis
Knee flexion/extension flexion extension X Factor angle greater clockwise rotation of the thorax with
respect to the pelvis
greater anti-clockwise rotation of the thorax with respect to the pelvis
[image:5.612.47.544.66.434.2](a) (b) (c)
Fig. 3. X Factor angle calculation; (a)αrepresenting torso rotation angle calculated about its own longitudinal axis, (b)βrepresenting pelvis rotation angle calculated about its own longitudinal axis, (c) calculation of X Factor angle (α−β).
negative value indicates the impact point is towards the heel of the club head). To maximize distance, golfers aim to hit the ball at the centre of the club face, where the club heads centre of mass is located, so that the ball will travel in a straight line. Off-centre contact results in what is known as the gear effect, with ball contacts towards the toe of the club causing the ball to hook and ball contacts towards the heel of the club causing the ball to fade (Penner, 2003). Off-centre impacts will also affect the club speed-ball speed ratio; in the present study, the high speed group were found to have a higher ratio than the low speed group (1.38 vs. 1.30). It is difficult to identify which joint action(s) resulted in the more accurate club face impact point because of the large number of biomechanical degrees of freedom associated with movements of the club in the sagittal plane.
During all four of the downswing events (early downswing, mid downswing, ball contact, and mid follow-through), sig-nificant differences were evident between the groups for X Factor angle (Table V). No previous studies using the 5 iron club have provided results for the X Factor angle at these events. At these events, the X Factor angle of high ball speed group was significantly greater than that of the low ball speed
group. Given that there was no difference in X Factor angle at the top of the backswing (discussed below), the greater X Factor angle during the downswing is indicative of the pelvis turning earlier and more towards the target than the torso, as evidenced by the significantly greater pelvis rotation at early and mid downswing (Table V). These results suggest that it may beneficial for golfers to maintain a large X Factor angle during the downswing in order to achieve greater ball speed.
6 TABLE III
GOLF CLUB SWING CHARACTERISTICS FOR HIGH BALL SPEED AND LOW BALL SPEED GROUPS(MEAN±S).
Variable Description High ball speed Low ball speed P Effect Size Club Speed (m.s) Speed the club was travelling during 7.16 inches
prior to contact
38.2±1.7 30.7±2.9 <0.001 72.4%
Clubface angle (◦) Angle of the clubface in the horizontal plane at the moment of contact with the ball (0 = square, - = closed, + = open)
2±3 3±5 0.57 1.2%
Tempo (s) Total time to complete the swing, from the moment of takeaway to ball contact
0.95±0.08 1.09±0.21 0.03 15.8%
Club rotation (deg.inch-1) Speed of clubface rotation in the horizontal plane during 7.16 inches prior to contact
2±1 1±1 0.41 2.5%
Impact point (cm) The position of contact of the ball on the club face (0 = centre of the clubface, + = towards toe of the club, - = towards heel of the club)
-0.74±0.68 -1.95±0.69 <0.001∗ 45.6%
∗Significant difference (P≤0.01) between groups.
TABLE IV
TIMING BETWEEN EIGHT SWING EVENTS FOR HIGH BALL SPEED AND LOW BALL SPEED GROUPS(MEAN±S).
Time (s) High ball speed Low ball speed P Effect Size Take away to Mid backswing 0.42±0.08 0.45±0.05 0.22 5.3% Mid backswing to Late backswing 0.16±0.04 0.19±0.05 0.06 11.8% Late backswing to Top of backswing 0.25±0.04 0.29±0.14 0.34 3.2% Top of backswing to Early downswing 0.19±0.03 0.20±0.05 0.56 1.3% Early downswing to Mid downswing 0.05±0.01 0.08±0.02 <0.001∗ 48.1%
Mid downswing to Ball contact 0.04±0.00 0.05±0.01 <0.001∗ 52.9% Ball contact to Mid follow through 0.07±0.01 0.08±0.01 <0.001∗ 55.4% ∗Significant difference (P≤0.01) between groups.
skilled golfers to have a significantly greater X Factor angle early in the downswing (termed the X Factor stretch) than their lesser skilled golfers. They considered greater club head speed at impact could be facilitated through utilization of the stretch-shortening cycle (i.e. the X Factor stretch) to increase force production in the downswing. In the present study, no such difference in X Factor stretch during the downswing was evident between the groups (high: 46.3 ± 11.1◦; low: 38.5 ± 10.6◦; P = 0.08), with a mean increase in X Factor angle during the downswing of only 28 for all participants.
Previous studies of shoulder movement when using iron clubs (Egret et al., 2003; Lindsay et al., 2002) limited their measurements to rotation of a segment formed by linking the two shoulders. The present study examined the right and left shoulder independently with significant differences evident between the groups for left and right shoulder flex-ion/extension and left shoulder internal/external rotation at various events (Table V). The high ball speed group flexed their right shoulders more than the low ball speed group during the backswing (at events mid backswing, late backswing, and top of backswing) and flexed their left shoulders more at late backswing, thereby utilizing a greater range of motion in the backswing. This appears to have allowed the high ball speed group to produce greater extension angular velocity in both shoulders at early downswing, which contributed to their greater ball speed at impact.
The high ball speed group were found to use less rotation of their left shoulder than the low ball speed group during the backswing (at events mid and late backswing). A possible benefit for this smaller range of movement by the high ball speed group is greater utilization of the stretch-shortening cycle. A small range of movement during the eccentric phase increases the potential for enhancements in neuromuscular
output during the concentric phase (Moran & Wallace, 2007). Another benefit of the smaller range of motion may be an increased likelihood of returning the club head to the ball at a more optimal orientation. By maintaining the club orientation as close to the take away position as possible there is less chance of inaccurate impact between the club head and ball, although no significant difference between the groups was evident in club face angle at ball contact.
7 TABLE V
SIGNIFICANT DIFFERENCES EVIDENT BETWEEN THE GROUPS FOR JOINT ANGLES(◦)AND ANGULAR VELOCITIES(DEG.S−1)AT EACH OF THE EIGHT SWING EVENTS(MEAN±S).
Variable High ball speed Low ball speed P Effect Size Mid backswing
Left shoulder internal/external rotation (◦) -49.5±17.6 -66.9±15.2 0.01∗ 23.0% Right shoulder flexion/extension (◦) 40.6±10.1 29.4±8.9 0.003∗ 26.9% Late backswing
Left shoulder flexion/extension (◦) 78.4±12.3 55.8±17.5 <0.001∗ 37.5%
Left shoulder internal/external rotation (◦) -42.5±15.1 -62.9±14.6 0.001∗ 33.7% Right shoulder flexion/extension (◦) 47.1±9.8 33.9±12.7 0.004∗ 26.4% Top of backswing
Right shoulder flexion/extension (◦) 57.3±10.6 44.2±15.9 0.01∗ 20.2% Early downswing
X Factor (◦) 39.8±9.9 29.0±10.7 0.007∗ 26.9% Pelvis rotation (◦) 5.1±8.1 -10.4±15.4 0.002∗ 29.9% Left elbow flexion/extension (◦) 32.2±8.6 43.6±8.7 0.004∗ 32.1% Left hip internal/external rotation (◦) -10.0±7.3 -19.0±9.4 0.01∗ 23.4%
Right hip abduction/adduction (◦) -17.0±6.7 -4.0±7.8 <0.001∗ 46.3% Left shoulder flexion/extension (deg.s−1) 494.5±200.3 224.5±119.7 <0.001 42.3%
Right shoulder flexion/extension (deg.s−1) 206.0±69.3 114.9±71.7 0.002 30.9%
Left knee flexion/extension (deg.s−1) -164.4±61.5 -52.6±68.7 <0.001 44.0%
Mid downswing
X Factor (◦) 35.1±8.2 24.8±8.7 0.002∗ 31.3% Pelvis rotation (◦) 27.0±7.6 15.24±14.2 0.008∗ 22.3%
Right hip flexion/extension (◦) 18.9±9.2 30.2±13.9 0.01∗ 19.7% Right hip abduction/adduction (◦) -25.4±5.8 -14.2±7.5 <0.001∗ 42.5% Left hip Flexion/extension (deg.s−1) -324.2±107.6 -218.4±91.4 0.01 23.3%
Right hip Flexion/extension (deg.s−1) -443.2±115.2 -290.4±106.7 <0.001 33.7%
Left wrist abduction/adduction (deg.s−1) -565.2±99.9 -376.8±158.8 0.004 33.8%
Left knee flexion/extension (deg.s−1) -238.0±75.9 -177.3±46.7 0.01 20.2%
Ball contact
X Factor (◦) 30.7±7.6 19.7±9.1 <0.001∗ 37.1% Right hip flexion/extension (◦) 2.3±9.4 14.5±13.9 0.01∗ 21.9% Right hip abduction/adduction (◦) -27.1±5.3 -18.5±6.0 <0.001∗ 38.3% Left shoulder abduction/adduction (deg.s−1) 609.2±304.9 234.8±197.6 0.001 36.6%
Mid follow through
X Factor (◦) 10.6±7.4 -3.16±13.5 0.002∗ 34.7%
∗Significant difference (P≤0.01) between groups.
These findings for hip abduction/adduction angle are be-lieved to have resulted in the high ball speed golfers transfer-ring a greater amount of weight onto their front foot, which would aid the generation of greater ball speed. In addition, the high ball speed group were found to have their left hip less externally rotated at early downswing. This finding may indicate that the high ball speed group initiated their downswing with their hips, which has been shown previously to occur in highly skilled golfers (Cheetham et al., 2001; McTeigue, Lamb, Mottram, & Pirozzolo, 1994). This rotation of the pelvis early in the downswing by the high ball speed group possibly contributed to their greater club head speed through a more enhanced utilization of the stretch-shortening cycle than the low ball speed group. Rapid rotation of the pelvis early in the downswing is believed to activate stretch receptors and facilitate elastic energy storage (Cheetham et al., 2001).
Subsequently, greater left and right hip extension angular velocity was evident for the high ball speed group at mid downswing. This finding supports the application of proximal-to-distal sequencing to golf; that is, to maximize the speed of the club head at the moment of impact with the ball, the golf swing should start with movements of more proximal segments and progress with faster movements of the more distal segments. In the present study, the high ball speed group
reached higher velocity of the proximal segment (hips) early in the concentric movement, which possibly led to their higher velocity at the distal segment (club head).
Greater left knee extension angular velocity was evident in the high ball speed group at early and mid downswing. Since the left foot remains on the ground during the golf swing, the increased velocity may be indicative of the high ball speed golfers moving their hips more towards the target than the low ball speed group.
CONCLUSION
8
findings have practical implications for coaches and golfers aiming to increase their maximum hitting distance.
ACKNOWLEDGMENT
This project was funded through a grant from Enterprise Ire-land and supported by Science Foundation IreIre-land under grant 07/CE/I1147.
REFERENCES
Ball, K. A., & Best, R. J. (2007). Different centre of pressure patterns within the golf stroke I: Cluster analysis. Journal of Sports Sciences, 25, 757–770.
Barrentine, S. W., Fleisig, G. S., & Johnson, H. (1994). Ground reaction forces and torques of professional and amateur golfers. In A. J. Cochran & M. R. Farrally (Eds.), Science and golf II: Proceedings of the 1994 World Scientific Congress of Golf (pp. 33–39). London: E & FN Spon.
Broer, M. R. (1973). Efficiency of human movement (3rd edn.). Philadelphia, PA: W. B. Saunders.
Budney, D. R., & Bellow, D. G. (1982). On the swing mechanics of a matched set of golf clubs. Research Quarterly for Exercise and Sport, 53, 185–192.
Bunn, J. W. (1972). Scientific principles of coaching (2nd edn.). Englewood Cliffs, NJ: Prentice-Hall.
Cheetham, P. J., Martin, P. E., Mottram, R. E., & St. Laurent, B. F. (2001). The importance of stretching the X factor in the downswing of golf: The X-factor stretch. In P. R. Thomas (Ed.), Optimising performance in golf (pp. 192–199). Brisbane, QLD: Australian Academic Press.
Chu, Y., Sell, T. C., & Lephart, S. M. (2010). The relationship between biomechanical variables and driving performance during the golf swing. Journal of Sports Sciences, 28, 1251–1259. Egret, C. I., Vincent, O.,Weber, J., Dujardin, F. H., & Chollet, D. (2003). Analysis of 3D kinematics concerning three different clubs in golf swing. International Journal of Sports Medicine, 24, 465–469.
Fradkin, A. J., Sherman, C. A., & Finch, C. F. (2004). How well does club head speed correlate with golf handicaps? Journal of Science and Medicine in Sport, 7, 465-472.
Jorgensen, T. (1970). On the dynamics of the swing of a golf club. American Journal of Physics, 38, 644–651. Lephart, S. M., Smoliga, J. M., Myers, J. B.,
Sell, T. C., & Tsai, Y. S. (2007). An eight-week golf-specific exercise program improves physical characteristics, swing mechanics, and golf performance in recreational golfers. Journal of Strength and Conditioning Research, 21, 860–869.
Lindsay, D. M., Horton, J. F., & Paley, R. D. (2002). Trunk motion of male professional golfers using two different golf clubs. Journal of Applied Biomechanics, 18, 366–373.
Maddalozzo, G. F. J. (1987). An anatomical and biomechanical analysis of the full golf swing. National Strength and Conditioning Association Journal, 9, 6–8, 77–79.
McLaughlin, P. A., & Best, R. J. (1994). Three-dimensional kinematic analysis of the golf swing. In A. J. Cochran and F. R. Farrally (Eds.), Science and golf II: Proceedings of the 1994 World Scientific Congress of Golf (pp. 91–96). London: E & FN Spon.
McLean, J. (1992), Widen the gap. Golf Magazine, December, pp. 49–53.
McTeigue, M., Lamb, S. R.,Mottram, R., & Pirozzolo, F. (1994). Spine and hi motion analysis during the golf swing. In A. J. Cochran and F. R. Farrally (Eds.), Science and golf II: Proceedings of the 1994 World Scientific Congress of Golf (pp. 50–58). London: E & FN Spon.
Milburn, P. D. (1982). Summation of segmental velocities in the golf swing. Medicine and Science in Sports and Exercise, 14, 60– 64.
Moran, K. A., McGrath, T., Marshall, B. M., & Wallace, E. S. (2009). Dynamic stretching and golf swing performance. International Journal of Sports Medicine, 30, 113–118.
Moran, K. A., & Wallace, E. S. (2007). Eccentric loading and range of knee joint motion effects on performance enhancement in vertical jumping. Human Movement Science, 26, 824–840.
Myers, J., Lephart, S., Tsai, Y. S., Sell, T., Smoliga, J., & Jolly, J. (2008). The role of upper torso and pelvis rotation in driving performance during the golf swing. Journal of Sports Sciences, 26, 181–188.
Nagao, N., & Sawada, Y. (1973). Kinematic analysis in golf swing concerning driver shot and no. 9 iron shot. Journal of Sports Medicine and Physical Fitness, 13, 4–16.
Neal, J. R., & Wilson, B. D. (1985). 3D kinematics and kinetics of the golf swing. International Journal of Sport Biomechanics, 1, 221–232.
Nesbit, S. M. (2005). A three dimensional kinematic and kinetic study of the golf swing. Journal of Sports Science and Medicine, 4, 499–519.
Penner, A. R. (2003). The physics of golf. Reports on Progress in Physics, 66, 131–171.
Perneger, T. V. (1998). Whats wrong with Bonferroni adjustments. British Medical Journal, 316 (7139), 1236–1238.
Pickering, W. M., & Vickers, G. T. (1999). On the double pendu-lum model of the golf swing. Sports Engineering, 2, 161– 172.
Robinson, R. L. (1994). A study of the correlation between swing characteristic and club head velocity. In A. J. Cochran and F. R. Farrally (Eds.), Science and golf II: Proceedings of the 1994 World Scientific Congress of Golf (pp. 84–90). London: E & FN Spon.
Savitz, D. A., & Olshan, A. F. (1995). Multiple comparisons and related issues I the interpretation of epidemiologic data. American Journal of Epidemiology, 142, 904–908.
Sprigings, E. J., & Mackenzie, S. J. (2002). Examining the delayed release in the golf swing using computer simulation. Sports Engineering, 5, 23–32.
Vicon (2002). Body builder model – golf. Retrieved 11 September 2010 from: http://www.vicon.com/support/downloads.php
Wallace, E. S., Grimshaw, P. N., & Ashford, R. L. (1994). Discrete pressure profiles of the feet and weight transfer patterns during the golf swing. In A. J. Cochran and F. R. Farrally (Eds.), Science and golf II: Proceedings of the 1994 World Scientific Congress of Golf (pp. 27–32). London: E & FN Spon.
Wheat, J. S., Vernon, T., & Milner, C. E. (2007). The measurement of upper body alignment during the golf drive. Journal of Sports Sciences, 25, 749–755.
Woltring, H. J. (1986). A Fortran package for generalized cross-validatory spline smoothing and differentiation. Advances in Engi-neering Software, 8, 104–113.