warwick.ac.uk/lib-publications Manuscript version: Author’s Accepted Manuscript
The version presented in WRAP is the author’s accepted manuscript and may differ from the published version or Version of Record.
Persistent WRAP URL:
http://wrap.warwick.ac.uk/109835
How to cite:
Please refer to published version for the most recent bibliographic citation information. If a published version is known of, the repository item page linked to above, will contain details on accessing it.
Copyright and reuse:
The Warwick Research Archive Portal (WRAP) makes this work by researchers of the University of Warwick available open access under the following conditions.
Copyright © and all moral rights to the version of the paper presented here belong to the individual author(s) and/or other copyright owners. To the extent reasonable and
practicable the material made available in WRAP has been checked for eligibility before being made available.
Copies of full items can be used for personal research or study, educational, or not-for-profit purposes without prior permission or charge. Provided that the authors, title and full
bibliographic details are credited, a hyperlink and/or URL is given for the original metadata page and the content is not changed in any way.
Publisher’s statement:
Please refer to the repository item page, publisher’s statement section, for further information.
1
Effect of alloying and coiling temperature on the
1microstructure and bending performance of ultra-high strength
2strip steel
34
Abhisek Mandal1*, Anish Karmakar2, Debalay Chakrabarti1, and Claire Davis3
5 6
1Department of Metallurgical and Materials Engineering, IIT Kharagpur, Kharagpur 721302, India 7
2Department of Metallurgical and Materials Engineering, NIT Warangal, Telangana 506004, India 8
3Warwick Manufacturing Group, University of Warwick, Zip-CV4 7AL, England, UK 9
10
*Corresponding Author, Mailing ID: [email protected], Phone: +91 9547374713 11
12
ABSTRACT 13
Two different high strength B-containing microalloyed steel strips produced in industrial 14
processing conditions, one treated with Ti and the other treated with Al, processed by 15
controlled rolling, accelerated cooling and coiling in two different temperatures ranges 16
[723 K to 733 K (450 C to 460 C)] and [633 K to 653 K (360 C to 380 C)] were 17
subjected to bend testing. The Ti treated steel coiled at the higher temperature 733 K (460 C) 18
showed the best bending performance. The relatively softer (tensile strength of < 900 MPa) 19
and homogeneous microstructure containing mostly granular bainite and upper bainite to 20
300-400 m depth below the surface, generated at the higher coiling temperature, is 21
preferred for bendability. The lower temperature coiling resulted in the formation of a hard 22
surface layer dominated by martensite which is undesired as the steel becomes prone to shear 23
cracking and interphase separation due to strain-localization. The combined effect of 24
beneficial texture components such as -fiber, {332} <113> and even {112} <131> in the 25
sub-surface region as well as uniformity of through thickness texture of the rolled sheet 26
improve the bendability. In the presence of crack initiators, like coarse and brittle TiN 27
particles found in the Ti treated steel, a harder microstructure and the presence of Cube and 28
Goss texture in the sub-surface layer, seen for the lower coiling temperature can cause local 29
transgranular cleavage cracking. Finally the post-uniform elongation obtained from tensile 30
testing and bendability follow a good correlation. 31
32
Keywords: High strength steel strip; Coiling temperature; Bainite; Martensite; Bend test;
33
Microstructural homogeneity; Crystallographic texture 34
2
1. INTRODUCTION
36
There has been an increasing interest to develop ultra-high strength steels (UHSS), i.e. 37
steels with yield strength greater than 700 MPa, for various applications, such as 38
transportation, construction, engineering, shipbuilding, energy and defence [1]. Such a 39
development is based on the requirement of structures with lighter weight and reduced 40
material thickness without sacrificing safety and structural integrity. Thus significant cost and 41
energy savings can be achieved as a result of a reduced requirement of material and welding 42
consumables, better energy efficiency and even improved fracture toughness due to the 43
reduced section thickness [1,2]. However, a major challenge concerning the application of 44
UHSS is its poor formability [3]. UHSS in the form of thick strip is primarily used in 45
structural components which are formed by bending. Hence, satisfactory bendability is an 46
essential requirement of UHSS [2,4]. 47
Bending is a conventional sheet metal forming process [5], where the deformation 48
behavior of the material differs from that of simple tensile testing [6]. During bending the 49
outer layers of the metal piece are subjected to higher tensile strains as compared to the inner 50
layers. Hence the yield strength is exceeded first at the outer layers [7]. Uniform deformation 51
continues till the point at which the increase in stress can accommodate plastic strengthening. 52
Subsequent bending results in non-uniform plastic deformation leading to the onset of 53
diffused necking [8–10]. Eventually, strain increasingly localizes into a narrow band, termed as 54
a shear band [11,12]. According to several studies, strain localization and the formation of shear 55
bands is the precursor for damage in bending. Therefore, a considerable scientific effort has 56
been made to identify the factors contributing to the evolution of shear bands during bending 57
operation [3,13–15]. Those factors are commonly related to the specific mechanical properties of
58
the material such as strength and work-hardening capability. Such properties depend on the 59
microstructural constituents and their homogeneity, crystallographic texture, inclusions and 60
defects and surface roughness [2,14,16–19]. It has been established that the local-scale
61
deformation behavior instead of the total elongation governs the bendability of UHSS[20,21]. It 62
has been suggested that inhomogeneity in the microstructure act as local hot-spots for stress 63
and strain and contribute to the failure during bending [2,22]. A homogeneity index, based on 64
the deviation in hardness measurements, was proposed to evaluate the homogeneity of the 65
microstructure [2,23]. In addition to microstructural uniformity, the beneficial effect of a soft 66
surface layer on bendability has been widely recognized [14,19,24,25]. A soft surface layer 67
provides increased deformation capability at the region, which is subjected to the maximum 68
3
Research emphasis has mostly been on improving the strength and toughness of UHSS 70
grades. Therefore, there is a lack of information on the effect of processing parameters on 71
bendability of UHSS. Thus the primary aim of this study is to understand the influence of 72
processing and composition on the microstructure, and hence on bendability, of boron 73
containing microalloyed UHSS. To establish the microstructure-bendability correlation, there 74
is a need to identify the exact mechanism governing cracking during bending. In particular, 75
the effects of surface hardness and microstructural homogeneity on the bendability need to be 76
understood and are discussed in this paper. 77
78
2. EXPERIMENTAL DETAILS
79
Four samples with dimensions of 600 mm length, 300 mm width and 6-8 mm thickness 80
were received from Tata Steel in Europe. The samples were taken from boron containing 81
ultrahigh strength microalloyed steel strips. These steel strips were produced in industrial 82
trials at Tata Steel and were part of a larger development program of UHSS intended to 83
determine which combination of chemical composition and processing parameters was 84
optimal. To retain boron in solution by avoiding BN formation, it is necessary to treat the 85
steel with a stronger nitride former, such as Ti or Al. The investigated steels were either Al-86
treated or Ti-treated and their chemical compositions are given in Table 1. 87
The strips were controlled rolled, with finish rolling temperatures of around 1223 K 88
(950 C), accelerated cooled and coiled at two different temperature ranges; higher [723 K to 89
733 K (450 °C to 460 C)] and lower [633 K to 653 K (360 C to 380 C)] coiling start 90
temperatures. The schematic diagram in Fig. 1 shows the typical processing schedule. 91
The steel samples were coded by the treatment adopted (Al- or Ti-) followed by the 92
respective coiling start temperature, i.e. Al-450, Al-360, Ti-460 and Ti-380. The Ti-380 93
sample was 8 mm thick and the other samples were 6 mm thick. Actual coiling start 94
temperatures could be a little higher than the measured values as the pyrometers monitor the 95
temperature at a distance away from the coils. The presence of some water or moisture on the 96
4 98
Fig. 1: Schematic diagram of the thermomechanical processing schedule applied on the 99
investigated strips along with the bainitic and martensitic transformation start 100
temperatures as predicted from JMatPro® software. Bs - bainitic start temperature, 101
Ms - martensitic start temperature, M50 - 50% martensite formation temperature Mf -
102
martensite finish temperature. TNR- Recrystallization stop temperature.
103 104
Thermodynamic calculations were performed using Thermo-Calc® 4.1 software based 105
on the nominal steel compositions to predict the formation of different phases and 106
precipitates under equilibrium cooling conditions. Cross-sections (RD-ND plane) of the 107
samples were prepared following standard metallographic techniques and investigated by 108
optical microscopy (model-Leica DM600M) with the attachment of image analysis, and 109
scanning electron microscopy (SEM model Zeiss EVO 60), with the attachment of energy 110
dispersive spectroscopy (EDS). The microstructural study was carried out by SEM on five 111
different locations across the sheet thickness. From each locations a 300 µm × 300 µm area 112
was covered by SEM study. Thus the microstructural characterization was performed over an 113
area of approximately 1.5 mm × 1.5 mm for each sample. Microstructural constituents such 114
as GB, UB, LB and TM were identified separately in those high magnification (3000x) SEM 115
[image:5.595.75.528.75.413.2]5
X-ray Goniometer (Model PW 3040/60) was used for the macrotextural study (on RD-TD 117
plane). Thin foils (~ 30 nm) were prepared by electropolishing using a solution of 80 percent 118
methanol and 20 percent perchloric acid. These foils were studied by high-resolution 119
transmission electron microscope, TEM (JEOL-2000 FX, Japan). Vickers macrohardness 120
readings were taken through the thickness at different locations i.e., sub-surface (350 µm 121
from free surface), quarter thickness and mid thickness of the strip, on the RD-ND plane of 122
the strip samples at 20 Kgf load with 15 s dwell time using LV-700 model LECO® hardness 123
tester. Heterogeneity of the microstructure at those above mentioned locations of the strip 124
was estimated by the variation in 200 hardness measurements and represented by the 125
heterogeneity index (HI). The equation used to determine HI is given below. 126
HI =
HSav
× 100
(1)127
where, Hav and S represent the average macrohardness value and the standard deviation in 128
hardness measurement, respectively. Tensile specimens were prepared following ASTM E-8 129
standard and tested in a 250 ton Universal Testing Machine Instron®8801 at room 130
temperature [~ 298 K (~ 25 C)] and a strain rate of 6.6x10⁻⁵/s.
131
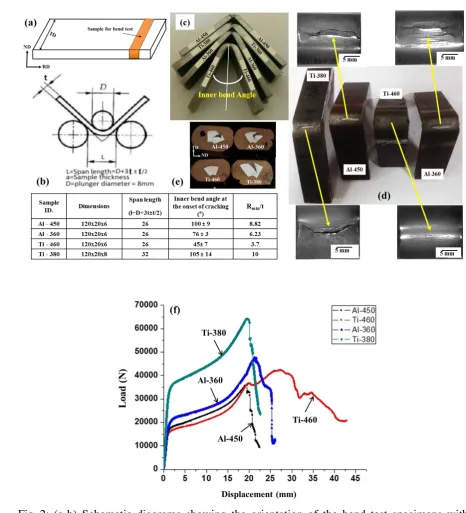
Bend testing was performed by following the ASTM E290 Bend Testing standard. The 132
samples for bend testing were taken from the RD-TD plane of the rolled strip as shown in 133
Fig. 2a. Schematic diagram of the bend testing setup is shown in Fig. 2b. Macroscopic
134
images of the bent samples with cross sections of the bent portions are also illustrated in 135
Fig. 2(c-e). All the investigated samples were bent under notch free three-point using a 250 136
ton Instron®8801 Universal Testing Machine. The load vs. displacement plot was recorded 137
based on three samples for each coiling treatment; examples are given in Fig. 2f. The 138
bending of a sample continued till the load dropped and visible cracks appeared on the outer 139
‘tensile’ surface. The inner-bend-angle between the two arms of a bend tested sample was 140
measured as shown in Fig. 2c. The lower the inner-bend-angle, the better the bendability. 141
Bendability was represented by the bend-ratio, i.e. the ratio of minimum bend radius to sheet 142
6 144
145
146
147
148
149
150
151
152
Fig. 2: (a-b) Schematic diagrams showing the orientation of the bend test specimens with 153
respect to the strip and bend testing setup. (c) Macroscopic side-view of the bend 154
tested specimens showing the minimum inner bend angles (until visible cracking and 155
load-drop) with their values listed below along with the minimum bend ratio. (d) 156
Corresponding macro-views of the cracks (at different magnifications) on the outer 157
surface of the bend tested samples. (e) Showing the cracked regions mounted in 158
Bakelite. (f) Load vs. displacement (at the middle of the specimen) plots obtained 159
from bend testing. 160
161
[image:7.595.54.521.71.585.2]7
3. RESULTS AND DISCUSSION
163
3.1 Thermodynamic calculation
164
Thermo-Calc® software estimated the ferrite transformation start temperature, 165
Ae3 [~ 1373 K (~ 1100 C)], and the end temperature, Ae1 [~ 1173 K ( 900 C)], under
166
equilibrium cooling to be the same for both the steels. Thermo-Calc® also predicted the 167
formation of different kinds of precipitates as shown in Fig. 3. 168
169 170 171 172
173
174
175
176
Fig. 3: Prediction of precipitate volume fraction with temperature in (a) Al-treated and (b) Ti- 177
treated steels as predicted from Thermo-Calc®. 178
179
Fig. 3 suggest that the Ti-treated steel had a higher precipitation start temperature [by 445 180
K (172 C)] and volume fraction of Ti(C,N) (more than ten times) as compared to the Al-181
treated steel. The estimated precipitation temperature and volume fraction of AlN are lower 182
in the Al-treated steel as compared to those for Ti(C,N) in the Ti-treated steel. Equilibrium 183
prediction suggested no formation of BN as evidenced in Fig. 3. Therefore, it is assumed that 184
B is protected in both the investigated steels to influence hardenability. Thermo-Calc® 185
anticipated the formation of Nb-rich (Nb,V)(C,N) and V-rich complex carbides containing Cr 186
and Mo at around 1373 K (1100 C) and 1053 K (780 C), respectively, in both the steels. 187
Fractions of those precipitates increased with the decrease in temperature. V-rich carbides in 188
microalloyed steels primarily form during and after the transformation of austenite as the 189
steel cools down [27], with fine VC being seen in hot rolled and coiled strip with coiling 190
temperatures in the range examined in this work [28]. Presence of a small fraction of MnS is 191
also expected. 192
8
3.2 Microstructural characterization
193
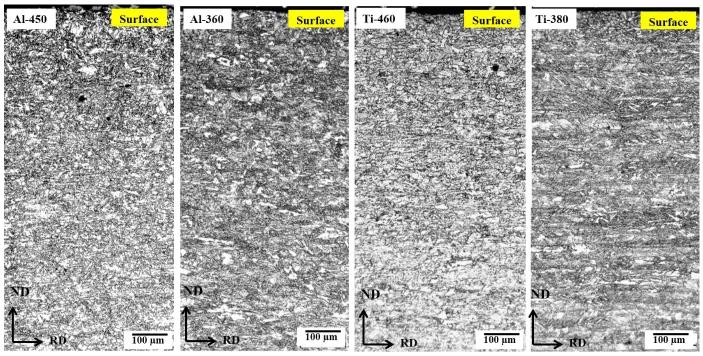
Low-magnification optical micrographs of the sub-surface regions of Al-treated (Al-450 194
and Al-360) and Ti-treated (Ti-460 and Ti-380) samples are illustrated in Fig. 4. No surface 195
decarburized layer was present. The microstructures are comprised of different forms of 196
bainite such as granular bainite (GB), upper bainite (UB) and lower bainite (LB) along with 197
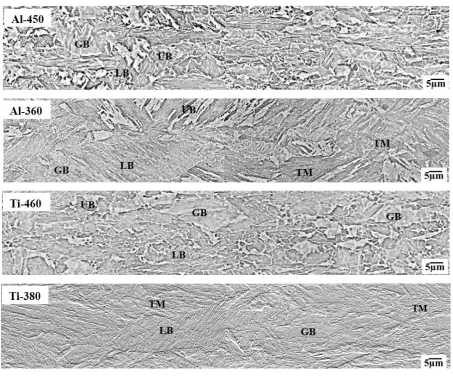
tempered martensite (TM) at different fractions. Higher magnification SEM images in Fig. 5 198
focus on the different microstructural constituents and their distribution at the sub surface 199
region. Typical higher magnification SEM micrograph, showing the dominance of granular 200
bainite (MA constituents are indicated) and upper bainite in Ti-460 sample, is given in Fig. 201
6a. The micrograph for Al-360 sample showing a predominantly tempered martensite and 202
lower bainite microstructure, is presented in Fig. 6b. Islands of martensite-austenite 203
constituents were distributed in the bainitic ferrite matrix of GB. Upper bainite consists of 204
inter lath carbides along the lath boundaries. On the other hand in the case of lower bainite, 205
carbides are precipitated within the bainitic ferrite at an angle of approximately 55° to its long 206
axis. Whereas, in tempered martensite a more random distribution of very fine carbides are 207
observed within the martensitic laths. Detailed discussion on the formation and characteristics 208
of each microstructural constituent is available in the literature [29]. Fractions of the 209
9 211
Fig. 4: Optical micrographs of the region from the top-surface up to ~ 600 µm depth along the thickness direction of RD-ND plane of the Al-212
treated (Al-450 and Al-360) and Ti-treated (Ti- 460 and Ti-380) strips. 213
[image:10.842.71.774.68.424.2]10 215
Fig. 5: Higher magnification scanning electron micrographs (SEM) of the investigated 216
samples (mentioned within the respective image) at the sub surface region (~300-217
400µm from the top surface). Abbreviations: GB: Granular bainite, UB: Upper 218
11 220
Fig. 6: Higher magnification SEM micrographs of (a) Ti-460 and (b) Al-360 samples. MA 221
constituents are marked by yellow arrow. Abbreviations: GB: Granular bainite, UB: 222
Upper bainite, LB: Lower bainite, TM: Tempered martensite. 223
224
Fig. 5, Fig. 6 and Table 2 show that the microstructures of the samples coiled at higher 225
temperatures (Al-450 and Ti-460) and lower temperatures (Al-360 and Ti-380) were 226
dominated by upper bainite (59-65%) and tempered martensite (48-58%), respectively. The 227
relative fractions of UB and TM were higher in the Al-treated steel as compared to the Ti-228
treated steel. The fraction of GB was highest in Ti-460, followed by Al-450, whilst Al-360 229
had the lowest GB fraction. Al-360 and Ti-380 contained 24-30% LB besides TM. 230
JMatPro® software was used to predict the start temperatures of the bainitic 231
transformation [Bs ~ 873 K ( 600 C)] and martensitic transformation [Ms ~ 673 K 232
( 400 C)] for the investigated steels. According to the literature the nature of bainite 233
depends on the undercooling below Bs [29]. The higher the coiling temperature, the lower the
234
undercooling and the larger the fractions of softer constituents like GB and UB that forms, as 235
in Ti-460. The lower coiling start temperature, below Ms, resulted in high fraction of TM in 236
Al-360 and Ti-380, Table 2. 237
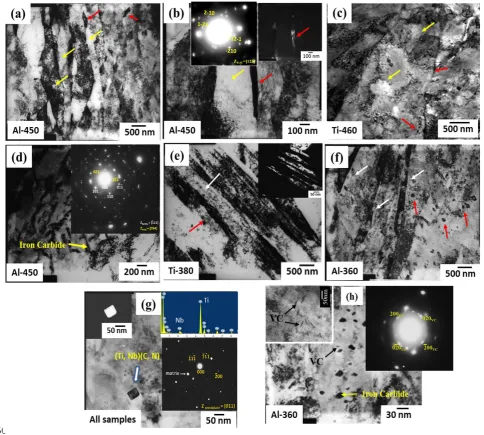
The TEM study helped in identifying the microstructural features, Fig. 7. Bright field 238
TEM images in Fig. 7(a-c) shows the presence of UB with carbide films situated along the 239
lath-boundaries in Al-450 and Ti-460. In order to confirm the presence of carbide in the form 240
of cementite selected area diffraction pattern was indexed (given as an insert in Fig. 7b along 241
with the corresponding dark field image), which indicates inter lath carbide precipitation. LB 242
with carbide precipitates inclined at certain angles within the ferritic laths was also observed, 243
Fig. 7d. TM structure in Al-360 and Ti-380 comprised of martensitic laths with numerous 244
12
diagonal length were detected in all the samples, especially in the Ti-treated steel, Fig. 7g. 246
Maximum size of those precipitates was also higher in Ti-treated steel (50 nm) than in the Al-247
treated steel (20 nm). The numerous spherical precipitates were iron-carbides (30-100 nm) 248
and V-rich carbides (less than 30 nm), Fig. 7h. 249
250
Fig. 7: (a-f) Bright field, dark field, selected area diffraction patterns (SADP) and energy 251
dispersive spectroscopy (EDS) of the investigated samples coiled at different temperatures as 252
indicated by the sample codes given on the respective micrographs. The bainitic laths, 253
martensitic laths and cementite precipitates are indicated by yellow, white and red arrows, 254
respectively. SADP and EDS spectrums are taken from (Ti,Nb)(C,N), iron-carbide and 255
vanadium carbide precipitates as given in figures (g-h). The precipitates are also marked in 256
the corresponding images. 257
[image:13.595.47.532.164.599.2]13
The observation of fine V-rich carbides is consistent with other studies on high strength 260
microalloyed strip steel [28]. Vanadium addition and the consequent VC formation can help in 261
retaining the strength of bainitic hot strip steel after coiling treatment [28]. Interestingly neither 262
AlN nor BN was detected in any of the samples. Even if those precipitates formed, their size 263
and / or fraction were lower than the precipitate detection limit or so few as to not be present 264
in the TEM foils examined. 265
266
3.3 Assessment of microstructural heterogeneity by hardness testing
267
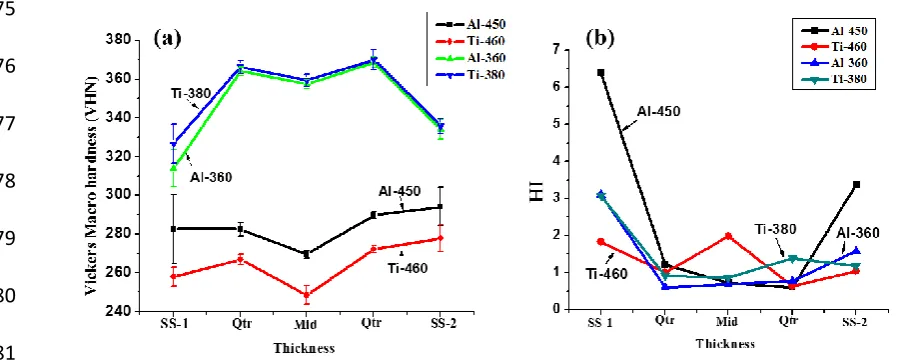
Average Vickers macrohardness (20 Kgf) was measured through the thickness on the 268
cross-section (RD-ND plane) of each sample as plotted in Fig. 8a. The decrease in coiling 269
temperature significantly increased the hardness level. Ti-460 showed the minimum hardness 270
followed by Al-450. Al-360 and Ti-380 had equally high hardness. Hardness of Al-360 and 271
Ti-380 increased from sub-surface (0.2 mm from the surfaces) towards quarter-thickness and 272
mid-thickness. In contrast hardness of Al-450 and Ti-460 decreased slightly from sub-surface 273
towards mid-thickness, Fig. 8a. 274
275
276
277
278
279
280
281
Fig. 8: (a) Average Vickers macrohardness through the thickness of the strip samples; (b) 282
Variation in heterogeneity index (HI) through the thickness of the strip samples. 283
Abbreviations: SS-1: Top sub surface, Qtr: Quarter thickness, Mid-Mid thickness and 284
SS-2: Bottom sub surface. 285
286
Microstructural heterogeneity was quantified at different locations based on hardness 287
variation as represented by the Heterogeneity Index (HI) in Fig. 8b. High and low HI value 288
[image:14.595.46.501.414.594.2]14
terms of hardness, respectively. Ti-460 showed superior homogeneity at sub-surface and 290
quarter-thickness whilst heterogeneity increased towards the mid-thickness, Fig. 8b. Al-450, 291
on other hand, had the most heterogeneous microstructure at the sub-surface and the 292
heterogeneity was more severe than the rest of the samples. Samples coiled at lower 293
temperatures (Al-360 and Ti-380) showed an intermediate level of microstructural 294
homogeneity, Fig. 8b. 295
296
297
298
299
300
301
302
303
304
305
306
307
308
Hardness contour plots of the sub-surface region of the investigated samples are shown in 309
Fig. 9: Hardness contour plots at the sub-surface region of the investigated strips (RD-ND 310
plane). X-axis is in mm. and Y-axis is in µm. Color codes represent Vickers 311
macrohardness values as given in the legends. Note that same hardness scale is used 312
in all the plots. 313
314
Fig 9, which clearly illustrate the microstructural heterogeneity with respect to hardness. 315
Al-450 had sub-surface hardness ranging from 272-322 VHN, whereas in Ti-450 this 316
[image:15.595.37.522.180.641.2]15
(Ti-380, Al-360) had a minimal hardness variation ranging over 310-330 VHN and high 318
hardness due to the presence of harder microstructural constituents, Fig 9. 319
3.4 Assessment of textural heterogeneity by XRD texture analysis
320
Fig. 10 shows the 2 = 45 ODF sections obtained from the macrotexture study at the
321
sub-surface (Fig. 10(a-d)) and mid-thickness (Fig. 10(e-h)) regions of the samples. The 322
major texture components observed in the different samples are indicated in Fig. 10 and the 323
color legend represents the maximum and minimum intensities by ‘red’ and ‘blue’ colors, 324
respectively. A schematic diagram of a 2 = 45 ODF section showing ideal BCC orientations
325
as expected in ferritic steel is presented as reference in Fig. 10i. 326
327
328
329
330
331
332
333
334
335
336
337
338
339
340
Fig. 10: Φ2=45° ODF sections of the strip samples obtained from the macro-texture study at
341
(a-d) sub-surface (SS) and (e-h) mid-thickness regions. The important texture 342
components are indicated by red and yellow arrows, respectively. (i) Ideal Φ2=45°
343
section of the Euler space showing ideal BCC orientations (Bunge notation) along 344
[image:16.595.42.519.275.690.2]16
The texture of all the samples was similar at the mid-thickness location as expected from 346
plane-strain deformation of austenite and its transformation during cooling, Fig. 10(e-h). The 347
mid-thickness texture is comprised of different orientations like Rotated Cube ({001}<110>), 348
from {112}<110> of RD-fiber (RD||<110>) to {112}<131>, Goss ({110}<001>), -fiber 349
(ND//<111>), and ε-fiber components from {332}<113> to {441}<118>. The different strip 350
samples showed different sub-surface textures, Fig. 10(a-d). Al-450 contained some Cube 351
({001}<010>), Brass ({110}<112>) and Goss ({110}<001>), orientations at the sub-surface, 352
Fig. 10a. Sub-surface textures of Al-360 and Ti-460 were similar to their corresponding mid-353
thickness textures, Fig. 10(b, c). The sub-surface texture of Ti-380 was quite random with ε-354
fiber close to Goss being the only prominent orientation along with weak Cube orientation 355
and {112}<110> component, Fig. 10d. 356
3.5 Evaluation of tensile properties
357
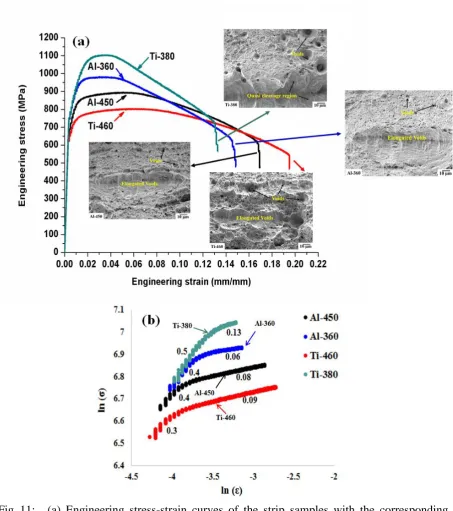
Engineering stress vs. engineering strain curves from the tensile tested specimens are 358
presented in Fig. 11a and the tensile properties are summarized in Table 3. Fig. 11a and 359
Table 3 show that the strength (both YS and UTS) increased with the decrease in coiling 360
temperature. Dependence of strength on coiling temperature was more sensitive in the Ti-361
treated samples (strength increased by 144 (YS) and 201 (UTS) MPa) in comparison to the 362
Al-treated samples (strength increased by 86 (YS and UTS) MPa). 363
The increase in YS was accompanied by a continuous decrease in total elongation (TE) 364
to failure. Ti-460 had the maximum TE followed by Al-450. It is interesting to note that the 365
post-uniform elongation (Post-UE) was 2.5 – 4.2 times higher than the corresponding 366
uniform elongation (UE) of the samples. Ti-460 showed the maximum TE, UE and even 367
Post-UE, followed by Al-450. Ti-380 had the lowest ductility in all these respects. Tensile 368
toughness was estimated from the area under the stress-strain curve. Ti-460 had the highest 369
tensile toughness followed by Al-450, whilst Al-360 and Ti-380 had equally low tensile 370
toughness, Table 3. 371
Logarithmic values of true-stress and true-strain are plotted in Fig. 11b to study the 372
hardening behavior. The samples showed two-stage hardening and the strain-373
hardening exponent for each stage was calculated and is stated on Fig. 11b. Ti-380 had the 374
highest n-values for both the hardening stages. The ‘n-value’ was also high for the second 375
hardening stage of Ti-460. Strain-hardening ability and even formability of steel can be 376
17
provides a larger stress range to perform the forming operation. Ti-380 had the lowest 378
YS:UTS ratio of 0.74 whereas this ratio was within a close range (0.81-0.84) for the other 379
samples. 380
381
Fig. 11: (a) Engineering stress-strain curves of the strip samples with the corresponding 382
fractographs given as inserts. (b) Logarithmic plots of the true-stress vs. true-strain 383
for the determination of strain-hardening exponent (n). 384
[image:18.595.74.528.148.660.2]18
The tensile fractographs of the samples are inserted in Fig. 11a. Presence of coarse and 387
deep dimples, indicating greater extent of void growth, on the fracture surface of Ti-460 was 388
in accordance with its high TE and post-UE. On the other hand, existence of cleavage and 389
quasi-cleavage regions on the fracture surface of Ti-380 justified its low TE and Post-UE. 390
Although coarse and elongated voids were present, the fracture surfaces of 450 and Al-391
360 were mostly covered by fine and shallow dimples. Such fine and shallow dimples, or 392
dimple-sheets, were the outcome of extensive void nucleation but limited void growth, which 393
contributed to limited ductility. 394
395
3.6 Evaluation of bending performance
396
Photographs of typical bend tested samples are illustrated in Fig. 2a and the average 397
values of inner-bend-angle and minimum bend-radius to thickness ratio (Rmin/t) are listed in
398
Fig. 2. With minimum values of inner-bend-angle and Rmin/t, Ti-460 showed the best
399
bendability, followed by Al-360, Al-450 and Ti-380 in terms of inner bend angle. According 400
to Hutchinson et al. [30] and Datsko et al. [31] the smaller the Rmin/t ratio the better the bending
401
performance of a material. Hutchinson et al. suggested Rmin/t ratio to be maintained below 2.5
402
for ensuring satisfactory bending performance [30]. Although the best bending ratio obtained 403
in the present study for Ti-460 sample is 3.7, this value may not be directly comparable with 404
the earlier studies due to the difference in specimen size. The macroscopic views of the outer 405
surfaces of the bend tested samples are given in Fig. 2d. Formation of cracks on the outer 406
surfaces of the bend was studied at higher magnification as indicated in Fig. 2d by yellow 407
arrows. Bend tested samples were further investigated by sectioning to view the cross section 408
at the bend region, shown in Fig. 2e. 409
Only a few thin-cracks developed on the outer side of Ti-460, which showed the best 410
bending performance. In contrast prominent and deep cracks appeared on the outer surfaces 411
of both Al-450 and Ti-380, which had poor bendability. Al-360, which showed intermediate 412
bending performance, contained multiple fine cracks along with a prominent crack, Fig. 2d. 413
Visible cracks could not be detected on the inner surfaces of the bend tested specimens. The 414
load vs. displacement plot for the bend tested samples in Fig. 2f showed that the samples 415
failed at different points after reaching the peak load. Samples coiled at lower temperatures 416
(Al-360 and Ti-380) followed a sudden and unstable drop from peak load indicating early 417
failure. Al-450 sample also failed early during the bending test after a peak load lower than 418
19
followed a gradual load drop even after the peak load associated with the stable growth of 420
fine surface cracks which cause surface stretch marks without showing any macroscopic 421
visual cracks. 422
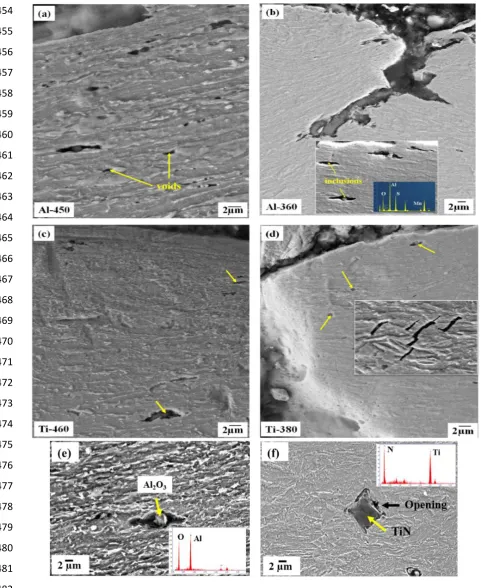
In order to understand the damage mechanisms operating in the bend tested samples, 423
cross-sections of the bend region were mounted, prepared metallographically and the regions 424
beneath the outer surfaces were studied under SEM, Fig. 12. Al-450 showed a heavily 425
strained microstructure with the presence of numerous voids, originated around carbides and 426
MA constituents and also at the interfaces of different microstructural constituents, Fig. 12a. 427
Localized deformation and shear band formation was noticed in Al-360 (dotted region in 428
Fig. 12b) and the primary crack propagated along the shear band, Fig. 12b. In contrast, the
429
microstructure at the outer bend layer of Ti-460 was more homogeneously deformed and the 430
formation of very few defects was noticed around inclusions and occasionally along the 431
interfaces of different constituents, Fig. 12c. The void formation was also limited in Ti-380. 432
However transgranular cleavage micro-cracks were noticed inside the tempered martensite 433
regions as shown by the insert in Fig. 12d. Although the steel was clean with low inclusion 434
content, local void and crack formation from the hard and brittle Al2O3 inclusions and TiN
435
particles was occasionally seen, but no link between inclusions and the main cracks were 436
found in the investigated samples, Fig. 12(e, f). The propagation of those defects depended 437
on the matrix microstructure and its deformability and their location with regard to the 438
macroscopic stress field. 439
20 454
455 456 457 458 459 460 461 462 463 464 465 466 467 468 469 470 471 472 473 474 475 476 477 478 479 480 481 482
Fig. 12: SEM micrographs showing the generation of cracks along the transverse-section 483
just beneath the fracture surface of (a) Al-450, (b) Al-360, (c) Ti-460 and (d) Ti-380 484
samples after bend testing. Yellow arrows indicated locations of voids or cracks in 485
the microstructures of the bend tested samples. (e-f) Nucleation of cracks from the 486
hard and brittle Al2O3 inclusions and TiN particles.
[image:21.595.41.523.69.658.2]21
3.7 Assessment of bendability in view of processing, microstructure and texture
489
A comparative summary for the different samples considering microstructural 490
features, hardness variation, texture, tensile and bending properties is given in Table 4. The 491
microstructural constituents are divided into two major categories, softer (GB and UB) and 492
harder (LB and TM). Total fraction of softer constituents was highest in Ti-460, followed by 493
Al-450; this difference in microstructure between Ti-460 and Al-450 was due to the 494
following reasons. First, there is a marginal difference in coiling start temperature 733 K 495
(460 C)] and 723 K (450 C)], which may have influenced the amount of upper and 496
granular bainite formed. Besides, the higher Ti level in the Ti-treated steel, along with Nb, 497
consumed more C from the austenite solution to form complex (Ti,Nb)(C,N) as compared to 498
in the Al-treated steel, with much lower Ti content. As a result, the C content in austenite was 499
slightly lower in the Ti-treated steel (by 0.005 wt.% as predicted from Thermo-Calc®), over 500
the range of 1073 K (800 C) to the coiling temperatures, than that in the Al-treated steel 501
reducing the hardenability and increasing the content of upper and granular bainite. Ti affects 502
the microstructure in these steels in two ways. Firstly, it preferentially reacts with nitrogen to 503
form TiN at high temperatures removing free nitrogen from the steel thereby retaining boron 504
in solid solution (rather than allowing the formation of BN). Boron is known to have a strong 505
effect on hardenability and therefore will affect the CCT diagram and microstructural 506
constituents that form. Boron will therefore allow GB to form at high coiling temperatures in 507
low carbon steels under natural cooling or continuous cooling. Secondly, presence of micro-508
alloying elements in solution can also promote the formation of GB [32]. Formation of carbide 509
or carbo-nitride precipitation removes the interstitial elements from solution, which affects 510
hardenability and can also contribute to the formation of softer constituents like GB and UB. 511
This affect helps to explain the lower martensite fraction in the Ti treated steel at lower 512
coiling temperature as compared to Al treated steel. These factors compete to influence the 513
final microstructure, along with the role of prior austenite grain size / shape and coiling 514
temperature. On the other hand the absence of AlN particles in the Al-treated steels raises a 515
doubt about the effectiveness of B protection in that steel, although no BN was observed 516
either (including during TEM studies). The GB fraction was lower in the Al-treated steel at 517
higher coiling temperature, which may be due to the lack of B influence. The absence of 518
nitride or carbo-nitride precipitation may retain more carbon / nitrogen in solution 519
contributing to the formation of UB and TM. This may explain the higher martensite fraction 520
22
The higher proportion of softer microstructure contributed to the best ductility and tensile 522
toughness in Ti-460, at the expense of hardness and strength. Not only was the overall 523
hardness low, the variation in hardness through the thickness was also small (within 20 524
VHN), Fig. 8a. Similarly, not only was the heterogeneity index (HI) at the sub-surface the 525
least, its variation through the thickness was also small (within 1.5), Fig. 8b. The above 526
factors encouraged uniform deformation not only at the microscopic scale, in a particular 527
location, but also macroscopically over the entire strip thickness. A low overall hardness 528
level with higher hardness at the sub-surface than the mid-thickness further ensured 529
deformation uniformity as the surface layers preferentially deformed during bending. 530
Another important aspect that improved the bendability of Ti-460 is the similarity in 531
texture between sub-surface and mid-thickness, Fig. 10(c, g). The orientations found in this 532
sample are listed in Table 4, along with the microstructures presented in Figs. 4 and 5, which 533
indicate that the deformed austenite transformed during cooling and coiling operations 534
through the thickness. The equation proposed by Boratto et al. [33] predicted the 535
recrystallization stop temperatures (TNR) of the Al-treated and Ti-treated steels to be ~
536
1248 K ( 975 C) and ~ 1258 K ( 985 C), respectively. The slightly higher TNR of the
Ti-537
treated steel was due to the contribution of both higher Ti content in solution and higher 538
volume fraction of Ti(C,N) particles, Fig. 3. Ti retards the recrystallization of austenite 539
although, not as effectively as Nb [33,34]. Thus the finish rolling temperature is further below 540
TNR for the Ti-treated steel than the Al-treated steel. The texture components found in Ti-460
541
originated from the transformation of Brass ({110}<112>), Copper ({112}<111>), Goss 542
({110}<001>) and S ({123}<634>) textures in the deformed austenite. Among the 543
transformed texture, -fiber (ND//<111>), {332}<113> and {112}<131> components are 544
known to be beneficial for ductility, formability and toughness [35,36]. Those beneficial texture
545
components are indicated by yellow arrows in Fig. 10(a-h). All these factors in combination 546
not only facilitated the uniform plastic deformation but also promoted void growth, after 547
defect generation. In addition, the moderate strain-hardening rate delayed void coalescence 548
[37]. Finally at the outer ‘tensile’ surface the strain energy was released by the formation of
549
multiple, thin, fibrous cracks instead of prominent deep cracking. The combination of all the 550
above factors improved the tensile ductility and bendability of Ti-460. 551
Among the investigated samples, the lack of bendability of Al-450 and Ti-380 and 552
23
In spite of the fact that softer constituents dominated the sub-surface 554
microstructure of Al-450, the distribution of microstructural constituents and their 555
respective hardness were such that a high heterogeneity index developed there. 556
Microstructural heterogeneity resulted in strain-partitioning and deformation 557
incompatibility between the harder and softer constituents contributing to defect 558
generation by interface separation, Fig. 12a. Numerous voids also formed around 559
the MA constituents and carbide films due to the preferential deformation of GB 560
and UB. Coalescence of those voids before sufficient growth led to premature 561
failure during bending. 562
Another aspect of concern in Al-450 was the dominance of Cube and Goss 563
orientations in the transformed texture. Those textures are indicated by red arrows 564
in Fig. 10(a-h). Such orientations are expected to originate from recrystallized
565
austenite, instead of deformed austenite. The sub-surface microstructure of Al-450 566
also indicated the presence of recrystallized prior-austenite grains at the point of 567
transformation along with few deformed prior-austenite grains, Fig. 5. The TNR of
568
Al-treated steel wasn’t much higher than the FRT ~ 298 K (~ 25C). Considering 569
the variability in industrial processing parameters and the adiabatic heating of the 570
heavily deformed surface layer, the possibility of austenite recrystallization at that 571
location could not be ruled out. Cube and Goss orientations are known to be 572
detrimental for ductility and toughness [35,38,39], and in turn bendability. Such 573
orientations not only promote the unstable crack propagation along the {001} 574
cleavage planes in BCC structures, but are also known to cause delamination and 575
crack initiation by interface separation of adjacent crystals [33, 36. 37]. 576
Ti-380 not only had a high hardness level but also a significant hardness variation 577
with high HI that reflected the microstructural heterogeneity. High fraction of 578
martensite, presence of Cube texture along with coarse and brittle TiN particles as 579
crack initiators (Fig. 12f) led to transgranular cleavage micro-cracking of 580
martensite, affecting the bendability. The different / weaker surface texture would 581
be consistent with a higher FRT (due to the fact this strip is thicker (8 mm) than 582
the others (6 mm)) and therefore there is less deformation below TNR.
583
Harder microstructural constituents with low n-value and high HI at the sub-584
24
other hand, beneficial sub-surface texture promoted plastic flow and resulted in 586
intermediate bendability. 587
Overall Ti treatment appeared to be more effective than Al treatment in retaining B in 588
solution and utilizing its beneficial effect in ensure microstructural uniformity. Use of higher 589
coiling temperature of 733 K (460 C) was beneficial from bendability point of view for Ti 590
treated steel due to the softer surface microstructure and superior uniformity in microstructure 591
and texture at the local-scale as well as through the thickness, however a lower strength is 592
seen. Finally the effect of post uniform elongation on bendability (Fig. 13) of the investigated 593
materials showed that in general with the increase in post-uniform elongation the inner bend 594
angle decreased, i.e. bendability increased. Although Al-450 had the second highest post-595
uniform elongation, its inhomogeneous distribution of microstructural constituents resulted in 596
an inferior bendability. Thus it appears that the post-uniform elongation can be related to 597
bendability. 598
599
600
601
602
603
604
605
606
607
608
[image:25.595.68.480.352.649.2]609
Fig. 13: Effect of post uniform elongation on the bendability of the investigated samples. 610
25
4. CONCLUSIONS
615
The conclusions of the present study can be considered in the context of other studies 616
performed over the last two decades on the bending performance of high strength steels. The 617
major findings of the present work are summarized below: 618
Microstructure, hardness and their variations locally and through thickness along 619
with the crystallographic texture at the sub-surface location plays the most 620
important role on bendability. Defect generation during bending is associated with 621
the separation of interphase boundaries or the strain-localization in form of shear-622
band and the associated shear cracking. Ensuring homogeneity in microstructure 623
and minimum hardness variation at the local-scale in the sub-surface regions are 624
therefore necessary for good bendability. 625
Relatively softer and homogeneous microstructure containing granular bainite and 626
upper bainite down to 300-400 m depth below the surfaces, generated at higher 627
coiling temperature ~ 733 K ( 460C), is preferred for bendability. The upper 628
bainite formed in the present study was relatively free from coarse MA films, 629
which can be detrimental for bendability. 630
Lower temperature coiling [633 K to 653 K (360 C to 380 C)] developed harder 631
surface layers dominated by martensite along with the softer constituents. Such a 632
microstructure is undesired as the steel acts like a dual-phase steel that is prone to 633
shear cracking and interphase separation due to strain-localization. 634
Lower hardness as well as less hardness variation at the sub surface region and 635
throughout the thickness contributed to the best bending performance of the Ti 636
treated sample coiled at 733 K (460 C). Overall Ti treatment showed better 637
microstructural uniformity as compared to Al treatment for B protection. 638
Through thickness textural uniformity and presence of beneficial texture 639
components such as -fiber, {332}<113> and even {112}<131> improve the 640
bendability of rolled and coiled strip. 641
Strain-hardening has a complex effect on bendability. High strain-hardening 642
certainly delays defect generation. However, in particle containing systems where 643
the particles facilitate defect generation, rapid hardening of the material can 644
26
In the presence of crack initiators like coarse and brittle TiN particles, hard 646
microstructures and Cube and Goss texture in the sub-surface layer can cause 647
local transgranular cleavage cracking. 648
Finally the total elongation and post-uniform elongation obtained from tensile 649
testing and bendability show a direct correlation. 650
651
Acknowledgements: Tata Steel in Europe, UK, for providing the Research Material and 652
sharing industrial information of the subject, Department of Science and Technology, New 653
Delhi, India, for the support of the research scholar Mr. Abhisek Mandal, research facilities 654
developed at IIT Kharagpur through Institute SGDRI 2015 grant, finally Dr. Martin 655
Strangwood from the University of Birmingham for providing valuable inputs at different 656
stages of the work. 657
658
5. REFERENCES
659
1 M. Saiji, H. Kohei, and T. Yasush: Newly-Developed Ultra-High Tensile Strength
660
Steels with Excellent Formability and Weldability, 2007. 661
2 K. Yamazaki, M. Oka, H. Yasuda, Y. Mizuyama, and H. Tsuchiya: Recent Advances
662
in Ultrahigh-Strength Sheet Steels for Automotive Structural Use, Japan, 1995. 663
3 Y.B. Xu, Y.L. Bai, Q. Xue, and L.T. Shen: Acta Materialia, 1996, vol. 44, pp. 1917– 664
26. 665
4 M. Kaupper and M. Merklein: CIRP Annals - Manufacturing Technology, 2013, vol. 666
62, pp. 247–50. 667
5 Z. Marciniak, J.. Duncan, and S.J. Hu: Mechanics of Sheet Metal Forming, 2nd editio., 668
Elsevier Ltd, 2002. 669
6 E. Tempelman, H. Hercliff, and B.N. van Eyben: Manufacturing and Design:
670
Understanding the Principles of How Things Are Made, 1st edn., 2014. 671
7 D. Rèche, T. Sturel, A.F. Gourgues-Lorenzon, and J. Besson: in Strain Based Design
672
of Pipelines, 2010, pp. 1–8. 673
8 Liang Xue: Engineering Fracture Mechanics, 2010, vol. 77, pp. 1275–97. 674
27
Department, ed., Kemi-Tornio University of Applied Sciences, 2012, pp. 19–29. 676
10 Y. Nagataki, S. Tsuyama, and Y. Hosoya: Steel Research Laboratory, 2013, vol. 99, 677
pp. 245–53. 678
11 K. Hashiguchi: Elastoplasticity Theory, vol. 42, Springer Berlin Heidelberg, Berlin, 679
Heidelberg, 2009. 680
12 W. Wang, M. Li, Y. Zhao, and X. Wei: Materials and Design, 2014, vol. 56, pp. 907– 681
13. 682
13 M. Kuroda and V. Tvergaard: European Journal of Mechanics - A/Solids, 2004, vol. 683
23, pp. 811–21. 684
14 A.J. Kaijalainen, P. Suikkanen, L.P. Karjalainen, and J.J. Jonas: Metallurgical and
685
Materials Transactions A, 2014, vol. 45, pp. 1273–83. 686
15 W. Wang, M. Li, Y. Zhao, and X. Wei: Materials & Design (1980-2015), 2014, vol. 687
56, pp. 907–13. 688
16 M.D. M. Lie: Philosophical Magazine A, 2001, vol. 81, pp. 1997–2020. 689
17 J. R. Rice: in Proceedings of the 14th International Congress on Theoretical and
690
Applied Mechanics, vol. 1, NorthHolland Publishing Co, 1976, pp. 207–20. 691
18 A. Maatta, A. Jarvenpaa, M. Jaskari, K. Mantyjarvi, and J.A. Karjalainen: Material
692
Forming - Esaform 2012, Pts 1 & 2, 2012, vol. 504–506, pp. 901–6. 693
19 A.J. Kaijalainen, M. Liimatainen, V. Kesti, J. Heikkala, T. Liimatainen, and D.A. 694
Porter: Metallurgical and Materials Transactions A, 2016, vol. 47, pp. 4175–88. 695
20 D. Rèche, T. Sturel, A.F. Gourgues-Lorenzon, and J. Besson: Proceeding of European
696
Conference of Fracture 18, 2010, pp. 1–8. 697
21 A. Väisänen, K. Mäntyjärvi, and J.A. Karjalainen: Key Engineering Materials, 2009, 698
vol. 410–411, pp. 611–20. 699
22 N. Pottore, N. Fonstein, I. Gupta, and D. Bhattacharya: AHSSS Proc, 2004, pp. 119– 700
29. 701
23 G. Rosenberg, I. Sinaiová, P. Hvizdoš, and L. Juhar: Metallurgical and Materials
702
28
24 K. Kawamura and K. Seto: US Patent 20,130,048,151, 2013, vol. 2, pp. 6–13. 704
25 A.-M. Arola, A. Kaijalainen, and V. Kesti: in AIP Conference Proceedings, vol. 1769, 705
AIP Publishing LLC, 2016, p. 200024. 706
26 J. Sarkar, T.R.G. Kutty, D.S. Wilkinson, J.D. Embury, and D.J. Lloyd: Materials
707
Science and Engineering: A, 2004, vol. 369, pp. 258–66. 708
27 T. Gladman: The Physical Metallurgy of Microalloyed Steels, Institute of Materials, 709
1997. 710
28 T. Siwecki, J. Eliasson, R. Lagneborg, and B. Hutchinson: ISIJ International, 2010, 711
vol. 50, pp. 760–7. 712
29 H.K.D.H. Bhadeshia: Bainite in Steels: Transformations, Microstructure and
713
Properties, IOM Communications, 2001. 714
30 B. Hutchinson, T. Siwecki, J. Komenda, J. Hagström, R. Lagneborg, J.-E. Hedin, and 715
M. Gladh: Ironmaking & Steelmaking, 2014, vol. 41, pp. 1–6. 716
31 J. Datsko and C.T. Yang: Journal of Engineering for Industry, 1960, vol. 82, pp. 309– 717
13. 718
32 S.-C. Wang and P.-W. Kao: Journal of Materials Science, 1993, vol. 28, pp. 5169–75. 719
33 F. Boratto, R. Barbosa, S. Yue, and J.J. Jonas: in International conference on physical
720
metallurgy of thermomechanical processing of steels and other metals, Imao Tamura., 721
ed., 1988, pp. 383–90. 722
34 M.G. Akben, T. Chandra, P. Plassiard, and J.J. Jonas: Acta Metallurgica, 1984, vol. 723
32, pp. 591–601. 724
35 R.K. Ray and J.J. Jonas: International Materials Reviews, 1990, vol. 35, pp. 1–36. 725
36 M.P. Butrón-Guillén, J.J. Jonas, and R.K. Ray: Acta Metallurgica Et Materialia, 1994, 726
vol. 42, pp. 3615–27. 727
37 D.M. Tracey: Engineering Fracture Mechanics, 1971, vol. 3, pp. 301–15. 728
38 P. D. Wu, S. R. MacEwen, D. J. Lloyd, and K. W. Neale: Effect of Cube Texture on
729
Sheet Metal Formability, vol. 364, 2004. 730
39 A.J. Kaijalainen, P.P. Suikkanen, L.P. Karjalainen, and D.A. Porter: Materials Science
29
and Engineering: A, 2016, vol. 654, pp. 151–60. 732
733
List of figures
734
Fig. 1: Schematic diagram of the thermomechanical processing schedule applied on the 735
investigated strips along with the bainitic and martensitic transformation start 736
temperatures as predicted from JMatPro® software. Bs - bainitic start temperature, 737
Ms - martensitic start temperature, M50 - 50% martensite formation temperature Mf -
738
martensite finish temperature. TNR- Recrystallization stop temperature.
739
Fig. 2: (a-b) Schematic diagrams showing the orientation of the bend test specimens with 740
respect to the strip and bend testing setup. (c) Macroscopic side-view of the bend 741
tested specimens showing the minimum inner bend angles (until visible cracking and 742
load-drop) with their values listed below along with the minimum bend ratio. (d) 743
Corresponding macro-views of the cracks (at different magnifications) on the outer 744
surface of the bend tested samples. (e) Showing the cracked regions mounted in 745
Bakelite. (f) Load vs. displacement (at the middle of the specimen) plots obtained 746
from bend testing. 747
Fig. 3: Prediction of precipitate volume fraction with temperature in (a) Al-treated and (b) Ti- 748
treated steels as predicted from Thermo-Calc®. 749
Fig. 4: Optical micrographs of the region from the top-surface up to ~ 600 µm depth along 750
the thickness direction of RD-ND plane of the Al-treated (Al-450 and Al-360) and Ti-751
treated (Ti- 460 and Ti-380) strips. 752
Fig. 5: Higher magnification scanning electron micrographs (SEM) of the investigated 753
samples (mentioned within the respective image) at the sub surface region (~300-754
400µm from the top surface). Abbreviations: GB: Granular bainite, UB: Upper 755
bainite, LB: Lower bainite, TM: Tempered martensite. 756
Fig. 6: Higher magnification SEM micrographs of (a) Ti-460 and (b) Al-360 samples. MA 757
constituents are marked by yellow arrow. Abbreviations: GB: Granular bainite, UB: 758
Upper bainite, LB: Lower bainite, TM: Tempered martensite. 759
760
Fig. 7: (a-f) Bright field, dark field, selected area diffraction patterns (SADP) and energy 761
dispersive spectroscopy (EDS) of the investigated samples coiled at different 762
temperatures as indicated by the sample codes given on the respective micrographs. 763
The bainitic laths, martensitic laths and cementite precipitates are indicated by yellow, 764
white and red arrows, respectively. SADP and EDS spectrums are taken from 765
(Ti,Nb)(C,N), iron-carbide and vanadium carbide precipitates as given in figures (g-766
h). The precipitates are also marked in the corresponding images. 767
Fig. 8: (a) Average Vickers macrohardness through the thickness of the strip samples; (b) 768
Variation in heterogeneity index (HI) through the thickness of the strip samples. 769
Abbreviations: SS-1: Top sub surface, Qtr: Quarter thickness, Mid-Mid thickness and 770
30
Fig. 9: Hardness contour plots at the sub-surface region of the investigated strips (RD-ND 772
plane). X-axis is in mm. and Y-axis is in µm. Color codes represent Vickers 773
macrohardness values as given in the legends. Note that same hardness scale is used 774
in all the plots. 775
776
Fig. 10: Φ2=45° ODF sections of the strip samples obtained from the macro-texture study at
777
(a-d) sub-surface (SS) and (e-h) mid-thickness regions. The important texture 778
components are indicated by red and yellow arrows, respectively. (i) Ideal Φ2=45°
779
section of the Euler space showing ideal BCC orientations (Bunge notation) along 780
with different fibers observed in BCC materials. 781
Fig. 11: (a) Engineering stress-strain curves of the strip samples with the corresponding 782
fractographs given as inserts. (b) Logarithmic plots of the true-stress vs. true-strain 783
for the determination of strain-hardening exponent (n). 784
Fig. 12: SEM micrographs showing the generation of cracks along the transverse-section 785
just beneath the fracture surface of (a) Al-450, (b) Al-360, (c) Ti-460 and (d) Ti-380 786
samples after bend testing. Yellow arrows indicated locations of voids or cracks in 787
the microstructures of the bend tested samples. (e-f) Nucleation of cracks from the 788
hard and brittle Al2O3 inclusions and TiN particles.
[image:31.595.42.529.46.804.2]789
Fig. 13: Effect of post uniform elongation on the bendability of the investigated samples. 790
31 808
[image:32.595.29.565.155.307.2]809
Table 1: Chemical composition of the investigated steels (wt. %). 810
811
812
813
Table 2: Fractions of microstructural constituents in the investigated samples as measured by 814
image analysis. 815
Sample No. Coiling Temperature [K (C)]
GB (vol. %)
UB (vol. %)
LB (vol. %)
TM (vol. %)
Al - 450 723 (450) 16 ± 4 59 ± 7 25 ± 2 ---
Al - 360 633 (360) 5 ± 2 13 ± 6 24 ± 2 58 ± 4
Ti - 460 733 (460) 25 ± 6 65 ± 5 10 ± 3 ---
Ti - 380 653 (380) 10 ± 2 12 ± 3 30± 3 48± 2
** GB-granular bainite; UB-upper bainite; LB-lower bainite; TM-tempered martensite. 816
817
818
819
820
821
C Mn S+P Si Al Ti Cu+ Ni
Cr Nb+Mo +V
B N
Al-treated 0.117 1.571 0.014 0.057 0.068 0.003 0.030 0.503 0.322 0.0019 0.0046
[image:32.595.82.494.437.611.2]
32
Table 3: Tensile properties of the tested samples. 822
Sample ID
YS (in MPa)
UTS
(in MPa) TE (%) UE (%)
Post-UE
(%) YS/UTS
Tensile toughness
(MJ/ m3)
Al - 450 722 ± 11 894 ± 8 16.7 ±1.2 4.5 ± 0.9 11.7 ± 0.72 0.81 139
Al - 360 808 ± 5 980 ± 12 14.5 ± 0.6 2.7 ± 1 11.4 ± 0.7 0.82 131
Ti - 460 670 ± 10 802 ± 12 19.5 ± 0.8 5.5 ± 0.1 13.5 ± 0.5 0.83 145
Ti - 380 814 ± 8 1103 ± 10 13.0 ± 0.2 2.8 ± 1.1 9.6 ± 0.9 0.74 131
Abbreviations: YS: Yield strength, UTS: Ultimate tensile strength, TE: Total elongation, UE:
823
Uniform elongation, Post-UE: Post-uniform elongation, YS/UTS: yield strength to ultimate
824
tensile strength ratio.
33
Table 4: Comparative assessment of microstructure, texture and mechanical properties of the investigated samples. * Softer constituents refers to upper and granular bainitic structures
Sample Microstruct ure * Overall hardness through thickness Heterogeneity Index (estimated from Hardness) Sub-Surface Texture Tensile properties Bending property and Rmin/t
Tensile fractography
Bend fractography
Al-450 75% softer constituents.
Low.
Harder sub-surface, softer mid-thickness.
Very high at sub-surface, low at
mid-thickness
Cube, Brass, Goss and weak
alpha fiber.
Low strength, intermediate ductility,
n-value and tensile toughness. Poor 8.82 Large and elongated dimples along with fine dimple
sheet.
Prominent cracking.
Al-360 18% softer constituents.
High.
Softer sub-surface, harder mid-thickness.
High at sub-surface, low at mid-thickness.
Rotated Cu to {112}<131>. Gamma fiber to
{332}<113>. Some rotated Cube and Goss.
High strength, low ductility, n-value and
tensile toughness. Intermediate 6.23 Large and elongated dimples along with fine dimple
sheet.
Prominent crack with several fine
cracks.
Ti-460 90% softer constituents.
Lowest.
Harder sub-surface, softer mid-thickness.
Low at sub-surface, comparatively higher at
mid-thickness
Rotated Cu to {112}<131>. Gamma fiber to
{332}<113>. Some rotated Cube and Goss.
Lowest strength, best ductility and tensile
toughness. High-n during second stage.
Best 3.7 Relatively coarser and deeper voids. Several fine cracks.
Ti-380 22% softer constituents.
High.
Softer sub-surface, harder mid-thickness.
High at sub-surface, low at mid-thickness.
Weak texture of rotated Cu, transformed Cu
and Cube.
Highest strength with lowest ductility and