STELLAR DYNAMICS AND STAR-FORMATION HISTORIES OF Z∼1 RADIO-LOUD GALAXIES
Ivana Bariˇsi´c1, Arjen van der Wel1, Rachel Bezanson2, Camilla Pacifici3, Kai Noeske4, Juan C.
Mu˜noz-Mateos5, Marijn Franx6, Vernesa Smolˇci´c7, Eric F. Bell8, Gabriel Brammer9, Jo˜ao Calhau10, Priscilla Chauk´e1, Pieter G. van Dokkum11, Josha van Houdt1, Anna Gallazzi12, Ivo Labb´e6, Michael V. Maseda6, Adam
Muzzin13, David Sobral6,10, Caroline Straatman1, Po-Feng Wu1
ABSTRACT
We investigate the stellar kinematics and stellar populations of 58 radio-loud galaxies of intermediate luminosities (L3GHz >1023W Hz−1 ) at 0.6<z<1. This sample is constructed by cross-matching galaxies from the deep VLT/VIMOS LEGA-C spectroscopic survey with the VLA 3 GHz dataset. The LEGA-C continuum spectra reveal for the first time stellar velocity dispersions and age indicators of z ∼ 1 radio galaxies. We find that z ∼ 1 radio-loud AGN occur exclusively in predominantly old galaxies with high velocity dispersions: σ∗>175 km s−1, corresponding to black hole masses in excess of 108M
. Furthermore, we confirm that at a fixed stellar mass the fraction of radio-loud AGN at z ∼1 is 5 - 10 times higher than in the local universe, suggesting that quiescent, massive galaxies at z ∼1 switch on as radio AGN on average once every Gyr. Our results strengthen the existing evidence for a link between high black-hole masses, radio loudness and quiescence at z∼1.
Keywords: galaxies: star formation — galaxies: jets — galaxies: high-redshift — galaxies: evolution — galaxies: fundamental parameters
1. INTRODUCTION
In order to match the stellar and dark matter halo mass functions and reproduce their evolution through cosmic time, semi-analytical and hydrody-namical galaxy formation models rely on two primary feedback channels to decrease the efficiency of star-formation. These models implement heating by super-novae that lead to a low star-formation efficiency in low-mass dark matter halos (White & Rees 1978; White &
1Max-Planck Institut f¨ur Astronomie, K¨onigstuhl 17, D-69117,
Heidelberg, Germany
2Department of Astrophysics, Princeton University, Princeton,
NJ 08544, USA
3Astrophysics Science Division, Goddard Space Flight Center,
Code 665, Greenbelt, MD 20771, USA
5European Southern Observatory, Alonso de C´ordova 3107,
Casilla 19001, Vitacura, Santiago, Chile
6Leiden Observatory, Leiden University, P.O.Box 9513,
NL-2300 AA Leiden, The Netherlands
7Department of Physics, Faculty of Science, University of
Za-greb, Bijeniˇcka cesta 32, 10000 Zagreb, Croatia
8Department of Astronomy, University of Michigan, 1085 S.
University Ave, Ann Arbor, MI 48109, USA
9Space Telescope Science Institute, 3700 San Martin Drive,
Bal-timore, MD 21218, USA
10Department of Physics, Lancaster University, Lancaster LA1
4YB, UK
11Department of Astronomy, Yale University, New Haven,
CT06511, USA
12INAF-Osservatorio Astrofsico di Arcetri, Largo Enrico Fermi
5, I-50125 Firenze, Italy
13Department of Physics and Astronomy, York University, 4700
Keele Street, Toronto, Ontario, ON MJ3 1P3, Canada
barisic@mpia.de
Frenk 1991;Hopkins et al. 2012). Feedback from
super-massive black holes (SMBHs) is implemented to prevent excessive star-formation in high-mass halos (De Lucia
& Blaizot 2007; Croton et al. 2006; Bower et al. 2006;
Vogelsberger et al. 2014;Schaye et al. 2015). The
phys-ical prescriptions differentiate between radiative-mode feedback and jet-mode feedback. Radiative-mode feed-back (quasar mode) is associated with the high accretion rate of the cold gas onto the SMBH and is related to the gas outflows (Shakura & Sunyaev 1973; Di Matteo
et al. 2005). Jet-mode (radio mode) feedback is
asso-ciated with a low accretion rate of hot (‘coronal’) gas onto the SMBH. The feedback loop is thought to ex-ist between the cooling of hot gas that feeds the SMBH (e.g., Blanton et al. 2001) to trigger an active galactic nuclei (AGN) phase that subsequently provides a heat-ing source, counter-actheat-ing coolheat-ing and preventheat-ing fur-ther growth in stellar mass.
Direct observational evidence for a link between AGN and the heating of halo gas is found in massive clusters, where radio jets are seen to produce cavities in the X-ray emitting gas (seeMcNamara & Nulsen 2007; Heckman
& Best 2014, and references therein) and also in
early-type galaxies in lower-mass groups where the presence of cold gas and radio jets is linked to the thermodynamical state of the warm/hot gas (Werner et al. 2012, 2014). Furthermore, indirect evidence in the form of a strong correlation between a lack of star formation (quiescence) and the presence of radio AGN has been gathered for
galaxies in the local universe (e.g.,Matthews et al. 1964;
Kauffmann et al. 2003a;Best et al. 2005). This
correla-tion suggests that massive galaxies spend extended peri-ods in a radio-loud AGN phase, which provides sufficient energy to keep the halo gas from cooling.
Until recently, radio observations of high-redshift galaxies were limited to the very highest luminosities (L > 1024W Hz−1), where radio AGN hosts are the most extreme galaxies: brightest cluster galaxies, but also star-bursting galaxies (De Breuck et al. 2002; Willott
et al. 2003). Deep surveys with the Karl G. Jansky
Very Large Array (VLA) are now probing lower lumi-nosities (L &1022W Hz−1), enabling us to explore the link between radio AGN and quiescence at large look-back time. Donoso et al.(2009) showed that the fraction of radio-loud galaxies increases out to z ∼1, and that its power-law dependence on stellar mass (fradio−loud ∝ M2.5
∗ ) is consistent with what is seen for present-day galaxies (Best et al. 2005). Simpson et al.(2013) demon-strate that up to z∼1 radio AGN preferentially reside in galaxies with evolved stellar populations as traced by the Dn(4000) index. Rees et al.(2016) confirm these re-sults, but show that atz >1 radio AGN are hosted more frequently by star-forming galaxies. Finally, Williams
& R¨ottgering (2015) demonstrate that the fraction of
radio-loud AGN of luminosities>1024W Hz−1increases out to z = 2, that the power-law mass dependence be-comes flatter with the increasing mass, and that the slope of mass dependence becomes shallower with the increasing redshift.
In this study we use deep, rest-frame optical spec-tra from the Large Early Galaxy Astrophysics Census (LEGA-C) survey of galaxies in the redshift range 0.6
< z <1 (van der Wel et al. 2016). The LEGA-C
op-tical spectra provide us for the first time with direct constraints on recent and long-term star-formation his-tories and stellar dynamical properties of a large sam-ple of galaxies at large look-back time. Cross-matching the LEGA-C sample with the recently completed 3 GHz VLA survey (Smolcic et al. 2017) allows us to examine for the first time stellar populations and velocity dis-persions of intermediate luminosity radio-loud AGN at these redshifts. The aim of this paper is to test the hy-pothesis that radio-loud AGN preferably occur in quies-cent galaxies with large velocity dispersions (black hole masses) over a broad range in cosmic time. The confir-mation of this hitherto poorly constrained assumption is crucial for the radio-mode feedback picture.
The outline of this paper is the following. In Section 2 we give an overview of LEGA-C and VLA datasets, and introduce the selection criteria and classification scheme for the radio-loud sub-sample. We present our main results and describe stellar content and star-formation activity of radio-loud AGN in Section 3. A summary of
our work is then given in Section 4.
2. DATA, SAMPLE SELECTION AND CLASSIFICATION
In this section we give an overview of the data sets analysed in this work. We present the criteria adopted for the selection of the radio-loud sub-sample among the whole LEGA-C sample, and we describe the method used to classify the radio-loud galaxies into quiescent and star-forming galaxies. By comparing with local benchmark samples we also measure the evolution of the fraction of radio-loud galaxies out to z∼1.
2.1. LEGA-C
The LEGA-C survey (van der Wel et al. 2016) is an ESO public spectroscopic survey with VLT/VIMOS
(LeFevre et al. 2003) with the aim of obtaining high
signal-to-noise ratio (S/N∼ 20 ˚A−1) continuum spec-tra of 0.6 < z < 1 galaxies. The full LEGA-C sam-ple will consist of more than 3000 galaxies,K-band se-lected from theMuzzin et al.(2013) UltraVISTA survey in the 1.62 square degree region within the COSMOS field (Scoville et al. 2007). The spectral resolution is R = 2500, spanning the wavelength range from 6300 ˚A to 8800 ˚A. The current paper uses the Data Release II 1 sample of 1989 galaxies observed during the first two
years of LEGA-C observations. This sample is repre-sentative of the final sample, which is, in turn, represen-tative of the galaxy population at a givenK-band flux density. That is, our sample selection is independent of galaxy color and morphology.
In this study we use redshifts, stellar velocity disper-sions, Dn(4000) break and Hδ absorption indices, neb-ular emission line equivalent widths, as well as physi-cal parameters estimated from broad-band photometry (UV+IR star formation rates (SFR) and stellar masses). UV and IR luminosity based SFRs are estimated
follow-ing Whitaker et al. (2012). Stellar masses are derived
using aChabrier(2003) Initial Mass Function,Calzetti
et al.(2000) dust extinction, and usingBruzual &
Char-lot(2003) stellar population libraries and exponentially declining SFR. For further details on the data reduc-tion steps and the method used to derive the physical parameters we refer tovan der Wel et al.(2016).
2.2. VLA - COSMOS
We use the observations at 3 GHz (10 cm) (PI: Ver-nesa Smolˇci´c) covering the 2 square degree COSMOS field, obtained by the VLA radio interferometer. The observations were conducted between 2012 and 2014, with a total observation time of 384 hours, yielding a
10
010
110
2SFR
IR+UV[M
¯yr
−1]
10
2210
2310
2410
25L
3GHz
[W
H
z
−
1
]
3Ghz matched jet-mode, visible jet radio-loud AGN
10
110
210
3SF
R
3GHz
[M
¯yr
−
[image:3.612.56.285.62.236.2]1
]
Figure 1. The 3 GHz radio luminosity (left-hand y-axis) and implied SFR (right-hand y-axis) versus SFRU V+IR for the
LEGA-C + VLA cross-matched sample. Red points meet our luminosity criteria for radio-loud AGN, red diamonds have visible jets in the radio image. Grey error bar represents the typical uncertainty of the SFRU V+IR. The 3 GHz luminosity
uncertainties for radio-loud AGN are smaller than the size of the data points.
final mosaic with the angular resolution of 0.75 ” and a median rms of 2.3µJy beam−1. For further details we refer toSmolcic et al.(2017).
2.3. Selection of radio-loud AGN
The current LEGA-C dataset contains 1989 galaxies, out of which 322 are found to have a radio counter-part after cross-matching the LEGA-C survey catalog and the VLA 3 GHz 5.5σcatalog (Smolcic et al. 2017). The matching radius between LEGA-C and VLA co-ordinates is 0.7 ”. The systematic offset in right ascen-sion and declination is 0.1 ” and 0.03 ” respectively, while the random offset is 0.1 ”. We convert radio continuum fluxes for cross-matched sources to luminosities, using VLA 3 GHz flux densities and LEGA-C spectroscopic redshifts, following the Condon(1992) luminosity rela-tion. Implied radio-based star formation rates are then found from luminosities usingBell(2003) calibration of the radio-FIR correlation.
Figure 1 compares the radio luminosity, L3GHz (and the corresponding star-formation rate) with the UV+IR-based SFR for this cross-matched sample. The good correspondence between the star-formation rate in-dicators is by construction, as the radio-based SFR is calibrated with the SFR derived from the IR luminos-ity. We see no evidence for a change in the far-infrared to radio luminosity ratio q, but this is not inconsistent with the evidence for such evolution (Magnelli et al.
2015; Delhaize et al. 2017) obtained from larger
sam-ples across a much larger redshift range thanz = 0 to z= 1.
Of interest for this study are the sources that are
out-LERG
(jet-mode)
HERG
(radiative-mode)
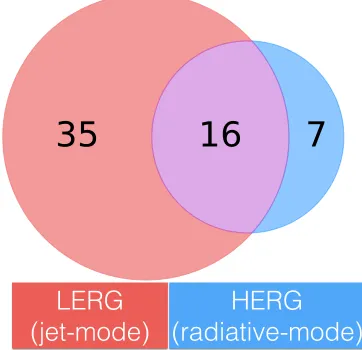
Figure 2. Classification of galaxies on jet-mode / radiative-mode based on the ratio of optical emission lines [OIII]/Hβ
and [OII]/Hβ(see Section2.4for details).
liers from the one-to-one relation (black line), that is, the sources with excessive radio luminosities. We esti-mate the radio AGN luminosity by subtracting 3×the radio luminosity expected on the basis of the UV+IR-based SFR from the observed radio luminosity. That is, we allow for a factor 3 scatter in the radio-SFR re-lation. Adopting the radio luminosity limit from Best
et al.(2005), we select those 58 galaxies with radio AGN
luminosities>1023W Hz−1as our radio-loud AGN sam-ple (see Figure1, red dashed curve).
2.4. Classification of the radio-loud objects
We examine the optical spectra of the 58 radio-loud AGN in order to distinguish between jet-mode (low-excitation radio galaxy, LERG) and radiative-mode (high-excitation radio galaxy, HERG) based on the pres-ence or abspres-ence of strong high-excitation emission lines
(Hine & Longair 1979;Laing 1994). We classify a radio
galaxy as a LERG if there are no or only low-excitation (Balmer) emission lines (EW([OIII], [OII], [Hβ])>-5 ˚A). For systems with strong emission lines we classify those with high [OIII]λ5007/Hβ and/or [OII]λ3727/Hβratios (>1) as HERGs. In our sample of 58 radio-loud AGN, 35 are classified as LERGs and 7 as HERG with high confidence. The classification of 16 objects remains un-determined, as we were not able to discriminate with high confidence between jet/radiative-mode. For the re-mainder of this paper we consider these objects as LERG with 50% probability for the purpose of statistical cal-culations. In Figure2 we summarize the results of our classification, which illustrates that almost 60% of our sample are LERGs. We list the properties of the 58 radio AGN in Table1.
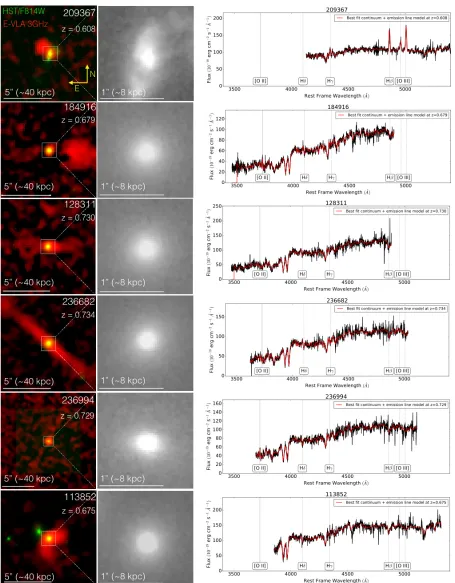
[image:3.612.350.531.66.241.2]loud galaxies are consistent with point sources, but in 12 cases we identify extended morphologies. We show the VLA 3 GHz and HST F814W images as well as the LEGA-C spectra of these 12 objects in Figure3.
3. PROPERTIES OFZ ∼1 JET-MODE GALAXIES 3.1. Fraction of jet-mode galaxies
Using the selection criteria defined in Section2.4, we determine the fraction of jet-mode radio galaxies in the LEGA-C sample, considering both star-forming and
qui-escent galaxies (see Figure4). Since we adopt the radio-loud AGN selection criteria fromBest et al.(2005), we compare our fraction of jet-mode galaxies at a redshift range 0.6<z<1 to their fraction of jet-mode galaxies for present-day galaxies. At fixed mass the fraction of jet-mode galaxies is on average 5 - 10 times higher at 0.6 <z<1 compared to the present-day universe. Further-more, we notice the flattening of the power-law mass dependence for the highest mass bin. These findings are consistent with the measurements from Donoso et al.
[image:6.612.115.498.229.717.2](2009).
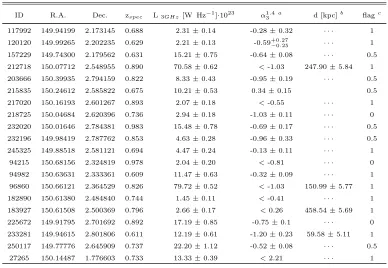
Table 1. Physical properties of the observed sub-sample of radio-loud galaxies
ID R.A. Dec. zspec L3GHz[W Hz−1]·1023 α13.4a d [kpc]b flagc
126578 150.09805 2.281367 0.750 2.89±0.18 -0.46±0.14 · · · 1
140050 150.14168 2.446062 0.899 8.04±0.42 -0.03±0.11 · · · 0.5
209637 150.10378 2.507702 0.608 3.21±0.17 -0.93±0.19 17.69±5.10 0
131063 150.35016 2.334642 0.667 12.27±0.63 -0.41±0.09 · · · 1
182797 150.39577 2.481532 0.903 2.22±0.17 <-0.42 · · · 1
184916 150.42589 2.513884 0.679 6.11±0.33 <1.77 50.00±5.36 1 185625 150.42506 2.524558 0.984 1.83±0.18 <-0.89 · · · 0.5 210716 150.17261 2.523343 0.69 12.21±0.60 -0.80±0.08 · · · 1
106926 150.29488 2.034494 0.955 77.68±3.91 1.02±0.09 · · · 0.5
108227 150.26643 2.049850 0.960 7.07±0.39 -0.41±0.31 · · · 0.5
109352 150.10892 2.063952 0.724 4.96±0.28 −0.49+0−0..1617 · · · 1 110509 150.26849 2.077003 0.667 6.64±0.34 -0.06±0.14 · · · 1
110805 150.17149 2.084074 0.729 3.77±0.20 −0.82+0−0..1617 · · · 0.5
113394 150.35657 2.117532 0.875 2.02±0.16 <-0.48 · · · 1
128311 150.05669 2.301382 0.730 4.49±0.24 -0.50±0.28 19.12±5.52 1
129746 150.02608 2.318864 0.941 3.40±0.24 <0.13 · · · 0.5
205180 150.00731 2.453467 0.730 18.94±0.96 −0.43+0−0..0708 · · · 1 209377 150.02267 2.508070 0.746 85.76±4.47 -0.79±0.07 · · · 0
210031 150.02242 2.516584 0.679 5.82±0.29 -0.93±0.13 · · · 0
210739 150.00941 2.526713 0.733 4.09±0.24 -0.49±0.25 · · · 1
234067 149.85017 2.452237 0.714 29.15±1.48 -0.35±0.07 · · · 1
236682 149.87180 2.479084 0.734 20.77±1.04 -0.78±0.07 95.81±5.53 1
236994 149.86151 2.484360 0.730 2.57±0.16 -0.65±0.29 109.57±5.52 1
129631 149.98328 2.317157 0.934 9.60±0.49 -0.61±0.16 · · · 0.5
131657 149.95264 2.341849 0.945 2.33±0.19 -1.06±0.20 · · · 1
169076 149.78040 2.318275 0.677 1.96±0.12 -0.43±0.17 · · · 1
169901 149.79379 2.327209 0.893 2.64±0.19 <-0.23 · · · 0
210564 149.91573 2.521326 0.729 6.55±0.35 -0.47±0.14 · · · 1
235394 149.76112 2.460729 0.671 4.92±0.25 0.09+0.28
−0.29 · · · 1
235431 149.78880 2.466439 0.732 1.19±0.11 <-0.61 · · · 0.5
237437 149.79221 2.489063 0.734 1.25±0.11 <-0.56 · · · 1
111543 149.91492 2.094372 0.884 2.09±0.17 <-0.54 · · · 0.5 113852 150.01424 2.123182 0.675 31.92±1.59 -0.47±0.07 35.63±5.34 1
125257 150.06847 2.265479 0.979 3.62±0.25 <-0.04 · · · 0.5 147270 149.87502 2.062635 0.847 12.63±0.65 -1.28±0.07 51.16±5.81 1
151161 149.89481 2.109374 0.666 7.65±0.43 -0.004±0.14 · · · 1
161004 149.83919 2.226176 0.943 4.68±0.28 -0.82±0.32 24.00±6.00 0.5
105328 149.90935 2.013062 0.848 1.84±0.15 <-0.45 · · · 1
Table 1(continued)
ID R.A. Dec. zspec L3GHz[W Hz−1]·1023 α13.4a d [kpc]b flagc
117992 149.94199 2.173145 0.688 2.31±0.14 -0.28±0.32 · · · 1
120120 149.99265 2.202235 0.629 2.21±0.13 -0.59+0.27
−0.25 · · · 1
157229 149.74300 2.179562 0.631 15.21±0.75 -0.64±0.08 · · · 0.5
212718 150.07712 2.548955 0.890 70.58±0.62 <-1.03 247.90±5.84 1 203666 150.39935 2.794159 0.822 8.33±0.43 -0.95±0.19 · · · 0.5
215835 150.24612 2.585822 0.675 10.21±0.53 0.34±0.15 0.5
217020 150.16193 2.601267 0.893 2.07±0.18 <-0.55 · · · 1
218725 150.04684 2.620396 0.736 2.94±0.18 -1.03±0.11 · · · 0
232020 150.01646 2.784381 0.983 15.48±0.78 -0.69±0.17 · · · 0.5
232196 149.98419 2.787762 0.853 4.63±0.28 -0.96±0.33 · · · 0.5
245325 149.88518 2.581121 0.694 4.47±0.24 -0.13±0.11 · · · 1
94215 150.68156 2.324819 0.978 2.04±0.20 <-0.81 · · · 0
94982 150.63631 2.333361 0.609 11.47±0.63 -0.32±0.09 · · · 1
96860 150.66121 2.364529 0.826 79.72±0.52 <-1.03 150.99±5.77 1
182890 150.61380 2.484840 0.744 1.45±0.11 <-0.41 · · · 1
183927 150.61508 2.500369 0.796 2.66±0.17 <0.26 458.54±5.69 1 225672 149.91795 2.701692 0.892 17.19±0.85 -0.75±0.1 · · · 0
233281 149.94615 2.801806 0.611 12.19±0.61 -1.20±0.23 59.58±5.11 1
250117 149.77776 2.645909 0.737 22.20±1.12 -0.52±0.08 · · · 0.5
27265 150.14487 1.776603 0.733 13.33±0.39 <2.21 · · · 1
aRadio spectral slopeαinferred using S∝ναat 1.4 GHz and 3 GHz
bLinear size (diameter) of the jet, with the errors estimated from the beam size (0.75”)
cClassification of galaxies onto LERG (1) or HERG (0). For conflicting indicators, we classify galaxies as 50% LERG
(0.5)
10.2 10.4 10.6 10.8 11.0 11.2 11.4 11.6
log(M
∗/M
¯)
0.001
0.01
0.1
1
10
100
%
of
je
t-m
od
e g
ala
xie
s
z = 0.6 - 1 (This work, whole sample) z = 0.6 - 1 (This work, quiescent only) z = 0 (Best et al. 2005, whole sample)
Figure 4. Fraction of jet-mode galaxies among all and qui-escent galaxies in the LEGA-C as a function of the stellar mass (orange diamonds and red circles respectively). Open orange diamonds show the fraction of jet-mode galaxies for the sample of present-day galaxies.
One possible evolutionary scenario is that galaxies grow in stellar mass by a factor of two from z ∼ 1 to the present while conserving the fraction of jet-mode galaxies. This would imply that growth in stellar mass exceeds growth in black hole mass if we assume that the black hole mass is the only factor that sets the proba-bility or frequency of becoming a radio galaxy. Alterna-tively, if BHs and stellar mass grow in lockstep (e.g.,
Cal-hau et al. 2017), then more frequent (or longer)
radio-loud AGN phases at fixed BH mass could be understood by shorter cooling times at earlier cosmic times. The evolution in the fraction of jet-mode AGN in quiescent galaxies must be even faster than that for the general population, given that the fraction of quiescent galax-ies is lower at z ∼1 than at the present day (e.g.Bell
et al. 2004; Faber et al. 2007). We show the fraction
of jet-mode AGN in quiescent galaxies in Figure4, and see that above 1011M
the fraction of jet-mode galaxies reaches 20 %.
[image:7.612.56.285.439.613.2]jet-100
150
200
250
300
350
σ
[km s
−1]
0.1
1
10
100
%
of
je
t-m
od
e g
ala
xie
s
z = 0.6 - 1 (This work, whole sample) z = 0.6 - 1 (This work, quiescent)
1
10
100
period [Gyr]
9.5
10.0
10.5
11.0
11.5
12.0
log(M
∗/
M
¯)
[image:8.612.59.561.60.252.2]50
100
150
200
250
300
350
400
σ
[k
m
s
− 1]
quiescent star forming jet-mode, visible jet jet-mode; quiescent jet-mode; star-forming6.0
7.0
8.0
9.0
10.0
log
(M
B H/
M
¯)
possible-jet/radiative-mode; quiescent possible-jet/radiative-mode; star-forming possible-jet/radiative-mode; quiescent possible-jet/radiative-mode; star-formingFigure 5. Left: Fraction of jet-mode galaxies among the full LEGA-C sample (orange diamonds) and among the quiescent galaxies the LEGA-C sample (red diamonds) as a function of the stellar velocity dispersionσ∗,Right: Stellar velocity dispersion σ∗as a function of the stellar mass. Blue and red points mark star-forming and quiescent galaxies, respectively. Large symbols
represent radio AGN, with filled symbols showing those that are securely classified as jet-mode / low-excitation AGN (see Section 2.4). Large diamonds represent those with visible jets in the radio image (see Figure 3). Jet-mode AGN occur in massive galaxies with high stellar velocity dispersions, and old stellar populations. Typical error bars are indicated in the corners.
mode AGN, reaching 20 - 30% at σ∗∼300 km s−1. This behavior is only weakly dependent on star-formation ac-tivity if at all, which suggests that jet-mode AGN are not associated with quiescence but with high σ∗. Be-low σ∗ = 175 km s−1 we find three jet-mode AGN (one 100% and two 50% objects), whereas if the power-law trend seen at high σ∗ were to continue to low σ∗ we would expect a total of ten jet-mode AGN in the three low-σ∗bins. The detection of only three jet-mode AGN may suggest a threshold black-hole mass of ∼ 108M
for jet-mode AGN, as inferred from the local black-hole mass -σ∗ relation (Gebhardt et al. 2003; Beifiori et al.
2012;van den Bosch 2016). We argue that this
thresh-old is not artificially introduced by our radio luminosity limit, as there is virtually no correlation betweenσ∗and radio luminosity, as shown in Figure6.
Assuming that the jet-mode fraction of 10−30% at high σ∗ can be interpreted as a duty cycle, we convert these fractions into the period (or frequency) at which galaxies turn on a jet-mode AGN. In order to make the conversion of the fraction of jet-mode AGN into the pe-riod, we need a life time of an AGN jet. Examination of the jet structure morphology of the 12 objects in Fig-ure 3 reveals that they are reminiscent of the classical Fanaroff-Riley I (FRI) type radio galaxy (Fanaroff &
Ri-ley 1974;Ledlow & Owen 1996). It has been argued that
life times evolve with redshift (Athreya & Kapahi 1998), but, among our radio galaxies that are detected in the pre-existing 1.4 GHz VLA data (Schinnerer et al. 2010) we find that the spectral slopes, and therefore presum-ably the ages, are similar to local counterparts (see Ta-ble1). The typical spectral slopes of local counterparts
range between -1.3 < α < -0.5 with the average spec-tral slope being -0.8 (Condon 1992). Parma et al.(1998) find a correlation for FRI radio galaxies between the lin-ear size of the jet and the synchrotron age of the jet as traced by the spectral slope, implying typical jet ages of about 100 Myr with an uncertainty of at most a factor 2. We therefore assume a lifetime of 2×100 Myr and show the resulting periods in Figure 5 on the left. We con-clude that galaxies turn on a jet-mode AGN about once every Gyr provided that it has a stellar velocity disper-sion in excess of σ∗ = 175 km s−1, corresponding with a black hole mass of 108M
. Remarkably, this is the same black-hole mass threshold that has been shown to separate quiescent and star-forming galaxies in the local universe (Terrazas et al. 2016).
3.2. Stellar Populations of Galaxies with Radio-Loud AGN
Our z∼1 radio AGN typically live in red, quiescent galaxies (Figure7) as was shown before bySmolˇci´c et al.
(2009),Simpson et al.(2013), andRees et al. (2016).
With the LEGA-C spectra we can examine, for the first time, the detailed stellar population properties of z ∼ 1 radio galaxies. Figure 8 shows the Balmer ab-sorption line index Hδas a function of the 4000˚A break Dn(4000) (Bruzual et al. 1983;Balogh et al. 1999;
Kauff-mann et al. 2003b, Wu et al., in prep). Both of these
0
100
200
300
400
500
σ
∗[km s
−1]
10
2310
2410
25L
3GHz
[W
H
z
− 1]
[image:9.612.57.288.62.237.2]jet-mode, visible jet radio-loud AGN
Figure 6. The 3 GHz luminosity as a function of the stellar velocity dispersionσ∗for the LEGA-C + VLA cross-matched
sample of galaxies.
0.5
1.0
1.5
2.0
2.5
3.0
U-V
1.0
0.5
0.0
0.5
1.0
1.5
2.0
2.5
3.0
log
(S
FR
IR + U V)
quiescent star-forming jet-mode, visible jet jet-mode; quiescent jet-mode; star-formingpossible-jet/radiative-mode; quiescent possible-jet/radiative-mode; star-forming
Figure 7. SFRU V+IR as a function of the rest-frame U-V
color. The symbols are described in Figure 5. Jet-mode AGN reside in red, quiescent galaxies as had been demonstrated before.
observed AGN with a lifetime of∼100 Myr are not im-mediately responsible for the quenching of recent star formation. However, they may play a crucial role in maintaining quiescence, at least over the past 7 Gyr.
4. CONCLUSIONS
Maintenance-mode feedback from central BHs is a key element of all galaxy formation models in a cosmologi-cal context. Jet-mode AGN are the physicosmologi-cal manifesta-tion of this concept and a minimum requirement for the model in general is that jet-mode AGN frequently occur in galaxies devoid of significant levels of star formation. This hypothesis has thus far only been tested directly in the present-day universe but in this paper we investigate whether jet-mode galaxies at z∼1 have been quiescent for an extended period of time.
0.8
1.0
1.2
1.4
1.6
1.8
2.0
2.2
D
n(4000)
4
2
0
2
4
6
8
10
12
EW
(H
δ)[
Å
]
quiescent star-forming jet-mode, visible jet jet-mode; quiescent jet-mode; star-forming [image:9.612.325.568.62.248.2]possible-jet/radiative-mode; quiescent possible-jet/radiative-mode; star-forming
Figure 8. Balmer absorption line index Hδas a function of the 4000˚A break Dn(4000). The symbols are explained in
Figure 5. Jet-mode AGN occur in galaxies with old stellar populations, with little star-formation activity for at least a Gyr.
We select the radio-loud subset of galaxies in the LEGA-C spectroscopic survey sample by matching against the newly acquired VLA 3 GHz dataset (Smolcic
et al. 2017). We identify 58 radio-loud galaxies, most of
which (∼ 60%) are confirmed to be low-excitation ra-dio AGN. Most rara-dio sources appear point-like, but 12 sources show clear jet-like morphologies and are classi-fied as FRI types.
The galaxies that host these jet-mode AGN have high stellar velocity dispersions of σ∗ >175 km s−1, trans-lating into a black-hole mass threshold of ∼ 108M
for jet-mode AGN, low specific star-formation rates (< 10−1Gyr−1) and high stellar masses (> 1011M). The fraction of jet-mode AGN is∼ 30% among galax-ies with the highest stellar masses&1011M
. Further-more, strong 4000˚A breaks and weak Balmer absorption lines imply that these galaxies have been devoid of signif-icant star-formation activity for more than∼1 Gyr. As-suming the jet-mode AGN share similar physical prop-erties in a certain mass bin, and considering their life time we infer that every massive, quiescent galaxy at z∼1 will switch on a jet-mode AGN about once every Gyr.
Our findings put firmer footing on the conclusions by
Best et al. (2014), who statistically link the quiescent
and radio-loud populations by comparing the evolution of their respective luminosity functions out toz∼1. It therefore seems increasingly plausible that radio AGN play a crucial role across cosmic time in keeping the halo gas around massive galaxies hot, preventing further star formation.
[image:9.612.54.289.298.473.2]We thank the anonymous referee for valuable feed-back. This project has received funding from the European Research Council (ERC) under the Euro-pean Union’s Horizon 2020 research and innovation pro-gramme (grant agreement 683184). Based on
obser-vations made with ESO Telescopes at the La Silla or Paranal Observatories under programme ID 194.A-2005. V.S. acknowledges support from the European Union’s Seventh Frame-work program under grant agreement 337595 (ERC Starting Grant, ’CoSMass’)
REFERENCES
Athreya, R. M., & Kapahi, V. K. 1998, Journal of Astrophysics and Astronomy, 19, 63
Balogh, M. L., Morris, S. L., Yee, H., Carlberg, R., & Ellingson, E. 1999, The Astrophysical Journal, 527, 54
Beifiori, A., Courteau, S., Corsini, E., & Zhu, Y. 2012, Monthly Notices of the Royal Astronomical Society, 419, 2497 Bell, E. F. 2003, The Astrophysical Journal, 586, 794 Bell, E. F., Wolf, C., Meisenheimer, K., et al. 2004, The
Astrophysical Journal, 608, 752
Best, P., Kauffmann, G., Heckman, T., et al. 2005, Monthly Notices of the Royal Astronomical Society, 362, 25 Best, P., Ker, L., Simpson, C., Rigby, E., & Sabater, J. 2014,
Monthly Notices of the Royal Astronomical Society, 445, 955 Blanton, E. L., Sarazin, C. L., McNamara, B. R., & Wise, M. W.
2001, The Astrophysical Journal Letters, 558, L15
Bower, R., Benson, A., Malbon, R., et al. 2006, Monthly Notices of the Royal Astronomical Society, 370, 645
Bruzual, A., et al. 1983, The Astrophysical Journal, 273, 105 Bruzual, G., & Charlot, S. 2003, Monthly Notices of the Royal
Astronomical Society, 344, 1000
Calhau, J., Sobral, D., Stroe, A., et al. 2017, Monthly Notices of the Royal Astronomical Society, 464, 303
Calzetti, D., Armus, L., Bohlin, R. C., et al. 2000, The Astrophysical Journal, 533, 682
Chabrier, G. 2003, Publications of the Astronomical Society of the Pacific, 115, 763
Condon, J. 1992, Annual review of astronomy and astrophysics, 30, 575
Croton, D. J., Springel, V., White, S. D., et al. 2006, Monthly Notices of the Royal Astronomical Society, 365, 11
De Breuck, C., Van Breugel, W., Stanford, S., et al. 2002, The Astronomical Journal, 123, 637
De Lucia, G., & Blaizot, J. 2007, Monthly Notices of the Royal Astronomical Society, 375, 2
Delhaize, J., Smolcic, V., Delvecchio, I., et al. 2017, arXiv preprint arXiv:1703.09723
Di Matteo, T., Springel, V., & Hernquist, L. 2005, Nature, 433, 604
Donoso, E., Best, P., & Kauffmann, G. 2009, Monthly Notices of the Royal Astronomical Society, 392, 617
Faber, S., Willmer, C., Wolf, C., et al. 2007, The Astrophysical Journal, 665, 265
Fanaroff, B., & Riley, J. 1974, Monthly Notices of the Royal Astronomical Society, 167, 31P
Gebhardt, K., Richstone, D., Tremaine, S., et al. 2003, The Astrophysical Journal, 583, 92
Heckman, T. M., & Best, P. N. 2014, Annual Review of Astronomy and Astrophysics, 52, 589
Hine, R., & Longair, M. 1979, Monthly Notices of the Royal Astronomical Society, 188, 111
Hopkins, P. F., Quataert, E., & Murray, N. 2012, Monthly Notices of the Royal Astronomical Society, 421, 3522 Kauffmann, G., Heckman, T. M., Tremonti, C., et al. 2003a,
Monthly Notices of the Royal Astronomical Society, 346, 1055 Kauffmann, G., Heckman, T. M., White, S. D., et al. 2003b,
Monthly Notices of the Royal Astronomical Society, 341, 33 Laing, R. 1994, in The Physics of Active Galaxies, Vol. 54, 227
Ledlow, M. J., & Owen, F. N. 1996, in Extragalactic Radio Sources (Springer), 238–239
LeFevre, O., Sa¨ısse, M., Mancini, D., et al. 2003, in Astronomical Telescopes and Instrumentation, International Society for Optics and Photonics, 1670–1681
Magnelli, B., Ivison, R., Lutz, D., et al. 2015, Astronomy & Astrophysics, 573, A45
Matthews, T. A., Morgan, W. W., & Schmidt, M. 1964, The Astrophysical Journal, 140, 35
McNamara, B., & Nulsen, P. 2007, Annu. Rev. Astron. Astrophys., 45, 117
Muzzin, A., Marchesini, D., Stefanon, M., et al. 2013, The Astrophysical Journal Supplement Series, 206, 8
Parma, P., Murgia, M., Morganti, R., et al. 1998, Arxiv preprint astro-ph/9812413
Rees, G., Spitler, L., Norris, R., et al. 2016, Monthly Notices of the Royal Astronomical Society, 455, 2731
Schaye, J., Crain, R. A., Bower, R. G., et al. 2015, Monthly Notices of the Royal Astronomical Society, 446, 521 Schinnerer, E., Sargent, M., Bondi, M., et al. 2010, The
Astrophysical Journal Supplement Series, 188, 384 Scoville, N., Aussel, H., Brusa, M., et al. 2007, The
Astrophysical Journal Supplement Series, 172, 1 Shakura, N. I., & Sunyaev, R. A. 1973, Astronomy and
Astrophysics, 24, 337
Simpson, C., Westoby, P., Arumugam, V., et al. 2013, Monthly Notices of the Royal Astronomical Society, stt940
Smolˇci´c, V., Zamorani, G., Schinnerer, E., et al. 2009, The Astrophysical Journal, 696, 24
Smolcic, V., Novak, M., Bondi, M., et al. 2017, arXiv preprint arXiv:1703.09713
Terrazas, B. A., Bell, E. F., Henriques, B. M., & White, S. D. 2016, Monthly Notices of the Royal Astronomical Society, 459, 1929
van den Bosch, R. C. 2016, The Astrophysical Journal, 831, 134 van der Wel, A., Noeske, K., Bezanson, R., et al. 2016, The
Astrophysical Journal Supplement Series, 223, 29
Vogelsberger, M., Genel, S., Springel, V., et al. 2014, Monthly Notices of the Royal Astronomical Society, 444, 1518
Werner, N., Allen, S., & Simionescu, A. 2012, Monthly Notices of the Royal Astronomical Society, 425, 2731
Werner, N., Oonk, J., Sun, M., et al. 2014, Monthly Notices of the Royal Astronomical Society, 439, 2291
Whitaker, K. E., Van Dokkum, P. G., Brammer, G., & Franx, M. 2012, The Astrophysical Journal Letters, 754, L29 White, S. D., & Frenk, C. S. 1991, The Astrophysical Journal,
379, 52
White, S. D., & Rees, M. J. 1978, Monthly Notices of the Royal Astronomical Society, 183, 341
Williams, W., & R¨ottgering, H. 2015, Monthly Notices of the Royal Astronomical Society, 450, 1538