Economics Working Paper Series
2017/031
Offshoring and the Age-Skill Composition of Labour
Demand
Sotiris Blanas
The Department of Economics
Lancaster University Management School
Lancaster LA1 4YX
UK
© Authors
All rights reserved. Short sections of text, not to exceed two paragraphs, may be quoted without explicit permission,
provided that full acknowledgement is given.
Offshoring and the Age-Skill Composition of Labour Demand
∗Sotiris Blanas†
December 2017
Abstract
This paper is the first to study the impact of offshoring on the age-skill composition of labour demand. In doing so, it provides novel empirical evidence firmly supporting the argument that the age profile of a worker is at least as crucial a criterion as the skill to be taken into account by firms while they make optimal labour utilisation adjustments through offshoring. The analysis is conducted on a sample of manufacturing and service industries in 12 developed countries for the period 1995–2005. Its main findings are that material and service offshoring to high-income countries decrease the relative demands for older more skilled workers, while they increase the relative demands for the youngest less skilled. In addition, material and service offshoring to low/middle-income countries decrease the relative demands for the youngest workers, while they mostly increase the relative demands for older workers. These findings are explained by the relative abundance of offshoring destinations in skills and in aspects of employment associated with workers’ age profiles, such as the level of human capital and expertise, the returns to training and the level of employment protection.
Keywords: offshoring; relative labour demand; age-skill profile
JEL Classification: F14, F16, F66, J21, J23, J24, J31
∗
I thank participants at numerous conferences, workshops and seminars for their comments and suggestions. Special thanks are extended to Rosario Crin`o, Francesco Di Comite, Gino Gancia, Maarten Goos, David Kang, Nicholas Lazarou, Jay Lee, Fabio Mariani, Julien Martin, Ilaria Maselli, Mar´ıa Navarro Paniagua, Peter Neary, William Parient´e, Andrea Pirrone, Thomas Sampson, Vincent Vandenberghe, Jan Van Hove, Christian Viegelahn, Ian Walker, and Maurizio Zanardi. I gratefully acknowledge financial support from the Fonds de la Recherche Scientifique – FNRS under Grant number “2.4624.12”. All errors are mine.
†
Lancaster University Management School, Economics Department, LA1 4YX, Lancaster, UK, e-mail:
1
Introduction
The age profile of a worker is a crucial criterion of human resource management as it is
associated with important aspects of employment; namely, the gradual acquisition of human
capital and the returns to training, the level of expertise and work experience, the strength
of ties with employers, as well as the employment protection level and the wage evolution
over time (Blossfeld et al., 2005; Blossfeld et al., 2009; OECD, 2011). Therefore, when the
representative firm makes optimal labour utilisation adjustments through offshoring, it may
consider not only the skill profile of a worker, which the existing literature has exclusively
focused on,1 but also her age profile.
As offshoring is unlikely to be age-neutral, my main objective in this paper is to study its
impact on the age-skill composition of labour demand. In doing so, I provide novel empirical
evidence on how material and service offshoring lead to within-skill inter-generational and
cross-skill intra-generational inequalities in developed countries. Importantly, I distinguish
throughout the empirical analysis between high-income and low/middle-income offshoring
destination countries as the motives for offshoring to these two destination types differ. The
different motives imply that the representative firm makes optimal adjustments in the
utili-sation of different labour types in each of the two cases. Also, the descriptive statistics of this
paper reveal important qualitative and quantitative differences in the trends of material and
service offshoring to high-income and low/middle-income destinations.
The analysis conducted is particularly relevant also because of demographic ageing and
the increasing trend in early retirement experienced by many developed countries in recent
decades (OECD, 2006a; Buchholz et al.,2009). These trends have important socio-economic
implications, most notably, the requirement for greater inter-generational pecuniary transfers
from younger to older workers and the ensuing financial pressure on public pension schemes
1
A voluminous literature has emerged in recent decades studying the impact of offshoring on the skill composition of labour demand. The skill profile of a worker is mostly captured by her education level. Some early studies, though, make the crude distinction between non-production and production workers in order to proxy for the skilled and unskilled workers, respectively. The main findings of this literature are that material and service offshoring increase the relative demand for more skilled workers, while they decrease the relative demand for the low-skilled. For relevant empirical evidence on the effects of material offshoring on the skill composition of labour demand, see among others: Feenstra & Hanson(1996,1999) for the US,B. Anderton & Brenton(1999) for the UK,Strauss-Kahn(2004) for France,Egger & Egger(2005) for Austria,R. Anderton et al.(2002) andHansson(2005) for Sweden,Helg & Tajoli(2005) for Italy and Germany,Minondo & Rubert
and welfare states (European Policy Committee,2001,2003,2006).
The sample that I use for the empirical analysis is a panel of 20 manufacturing and service
industries of 12 developed countries over the period 1995–2005. EU KLEMS is the main
source of information on labour and other production-related variables. Labour variables
correspond to heterogeneous workers in age and skill who form nine relevant groups. Skill is
proxied by the worker’s level of education. For the construction of the measures of material
and service offshoring, I draw information on imported material and service inputs from
the World Input-Output Database (WIOD). In order to distinguish between high-income and
low/middle-income offshoring destination countries, I use the World Bank’s Historical Country
Classification By Income.
The minimisation of the translog cost function of the representative firm yields a system
of nine wage bill share equations, with each equation corresponding to one of the nine age-skill
groups of workers. In the benchmark analysis, I treat all explanatory variables as endogenous
and estimate the system by Iterated Three-Stage Least Squares (I3SLS). As instruments for
each explanatory variable, I use its first and second lags. For material and service offshoring
to high-income and low/middle-income destinations which are the key explanatory variables,
I construct additional instruments. These are the first two lags of offshoring measures
corre-sponding to three countries that are not included in the benchmark sample as they do not
provide information on labour variables by age and skill. The three selected countries are
France, Ireland and Sweden, whose levels and trends of offshoring are very similar to those of
the 12 countries of the benchmark sample. In order to ensure that the first- and second-lagged
measures of material and service offshoring of these three countries to high-income
destina-tions are exogenous instruments, I exclude trade between these countries and the 12 countries
of the sample.
The findings of the empirical analysis firmly support the argument that the age profile of
a worker is at least as crucial a criterion as the skill to be taken into account by firms while
they make optimal labour utilisation adjustments through offshoring. In particular, I find
that material and service offshoring to high-income countries decrease the relative demands
for older more skilled workers, while they increase the relative demands for the youngest less
skilled. In addition, I find that material and service offshoring to low/middle-income countries
decrease the relative demands for the youngest workers of all skills, while they mostly increase
of offshoring destinations in skills and in aspects of employment associated with workers’ age
profiles, such as the level of human capital and expertise, the returns to training and the level
of employment protection.
The remainder of the paper is structured as follows. In Section2, I describe the theoretical
background of the effects of offshoring on the age-skill composition of labour demand, after
discussing the reasons for which the age profile of a worker is a crucial criterion of human
resource management. In Section3, I describe the data and provide descriptive statistics for
offshoring and key labour variables which motivate the subsequent econometric analysis. In
Section4, I present the econometric model and discuss the estimation strategy. In Section5, I
present the main results and the robustness checks, while in Section6, I conclude and provide
some suggestions for further research.
2
Theoretical background
In this section, I first discuss the reasons for which the age profile of a worker is a crucial
criterion of human resource management. Then, I describe the theoretical background of the
empirical analysis on the effects of material and service offshoring on the relative demands for
heterogeneous workers in age and skill.
Human resource management and the age profile of workers
The literature highlights several reasons for which the age profile of a worker is among
the most prominent criteria of firms’ human resource management. To start with, employers
place a high value on the advantage of older workers over younger workers of the same
ed-ucation level in human capital development, know-how and expertise, especially, when these
are employer-specific (OECD, 2011). Employers also value highly their greater work
expe-rience –although this might have become less important in recent years (Buchholz et al.,
2009)– and their stronger ties with them, implying loyalty and stronger commitment (OECD,
2011). In addition, the recent reforms towards the flexibilisation of the labour market in many
developed countries and the shift of firms’ pay schemes from seniority-related to
performance-related have been borne disproportionately by young labour market entrants, while older
workers have enjoyed relatively high employment protection and seniority wages (Blossfeld et
al.,2005;Blossfeld et al.,2009;Blossfeld et al.,2011;OECD,2011;Hof¨acker,2012).2
2
However, the older workers’ relatively high employment protection and seniority wages
may adversely affect their hiring rates and employment levels, since employers deem them as
a relatively costly labour force.3 In addition, the increasing demand for new skills induced
by globalisation has rendered certain skills of older workers outmoded. On top of that, older
workers have lower returns to training relative to younger workers due to the shorter time
horizon that they have in order to recoup their investment in training (Hutchens,1988;
Bloss-feld et al.,2006; Hof¨acker, 2012) and the smaller benefits from human capital accumulation
(Heckman,2000). There is also evidence that these returns are even lower for older workers of
low skill (Mayhew & Rijkers,2004). The anticipated relatively low returns to training of older
workers determine both employers’ and older workers’ practices in this regard. Specifically,
employers are less willing to invest in training of older workers and older workers themselves
–especially, those close to retirement age–, are less willing to engage in training activities.4
Finally, negative stereotypes of employers about older workers result in discrimination against
them (OECD,2006a;OECD,2011), and ultimately, may impact hiring decisions and human
resource management (Dalen & Henkens,2005;Schr¨oder et al.,2009;Neumark,2009).
In summary, the age profile is an essential worker characteristic capturing the gradual
acquisition of human capital of a worker and her returns to training, her level of expertise and
work experience, the strength of her ties to an employer, her employment protection level,
and the evolution of her wage over time. Therefore, the representative firm, while optimising
its labour utilisation through offshoring, is likely to take into account not only the education
paid, had the only criterion been the productivity level of the worker. This practice has been justified by economists as a way of firms to build strong ties with their employees (Lazear,1981). OECD(2011) reports that the age-earnings relationship has been monotonically increasing in Austria, Belgium, France, Germany and the Netherlands, while it has been hump-shaped in Ireland, Japan and the UK. In addition,Hellerstein & Neumark(1995) andHellerstein et al.(1999), with the use of Israeli and US firm-level data, respectively, find no evidence that older workers are overpaid relative to their productivity. Mahlberg et al. (2013) reach the same conclusion, using matched employer-employee data for Austria. By contrast,Vandenberghe et al.(2013) use Belgian firm-level data and find a negative impact of larger shares of older workers on firm productivity that is not compensated by lower labour costs, thereby indicating the existence of seniority wages in these firms that are not justified by the levels of productivity and employability of their older workers.
3
Lanciano & Nitta(2010) examine the downsizing process that French and Japanese firms in the declining steel industry have undergone in recent decades and find that this process, with the support of relevant govern-ment policy measures, has been mostly characterised by age managegovern-ment. In addition,OECD(2011) reports that the hiring rate and employment level of workers aged 50–64 are negatively associated with employment protection, whileOECD(2006b) andDorn & Sousa-Poza(2010) find these associations to be weak. There also seems to be a strong negative association between hiring rates and seniority wages (Daniel & Heywood,2007;
OECD,2011). 4
level of a worker which defines her skill, but also her age profile.
Offshoring and the relative demands for heterogeneous workers in age and skill
The production process of the representative firm is conceptualised in terms of tasks
(Grossman & Rossi-Hansberg,2008) and therefore, material and service offshoring refer to the
transfer of manufacturing and service tasks, respectively, abroad.5 The distinction, though,
between high-income and low/middle-income offshoring destination countries is crucial as the
motives for offshoring to the two destination types differ. The different motives imply that
the firm makes optimal adjustments in the utilisation of different labour types in each of the
two cases.
The main motive of the representative firm of a high-income country to offshore
manu-facturing and service tasks to other high-income countries is to gain access to very
highly-specialised and therefore, scarce human capital. This is because high-income destination
countries are relatively abundant in older workers of relatively high education who acquire
exceptional know-how, expertise and work experience that are highly valued by their own
employers and other firms as well. Given also the relatively low returns to training of older
workers, the representative firm is incentivised to offshore to high-income destinations in order
to source the additional know-how and expertise that its own older workers of relatively high
education do not possess. Therefore, offshoring to high-income destinations is expected to
substitute for older and relatively high-educated domestic workers, resulting in a decrease in
their relative demands. By contrast, it is expected to complement domestic workers of lower
education and mostly of young age, resulting in an increase in their relative demands.
The main motive of the representative firm of a high-income country to offshore
manu-facturing and service tasks to low/middle-income destination countries is to take advantage
of wage cost differentials. As low/middle-income countries are relatively abundant in
low-educated workers with common know-how and expertise and of mostly young age, the
manu-facturing and service tasks that are offshored to these countries mostly require utilisation of
workers with such characteristics. In recent decades, these countries have also experienced an
increase in the pool of workers with relatively high education, who are mostly of young age
and possess common know-how and expertise. The increasing pool of these workers explains
the recent increasing trend in offshoring to these countries of tasks such as reading of X-rays,
5
software development, tax forms preparation (Grossman & Rossi-Hansberg, 2008). As the
utilisation of common know-how and expertise possessed by domestic workers of all education
levels and of mostly young age is relatively expensive, the representative firm is incentivised to
offshore to low/middle-income countries in order to acquire common know-how and expertise
at a lower cost. Given also the stronger ties of older workers with their employers and their
higher employment protection and more rigid wages relative to younger workers, offshoring
to low/middle-income countries is expected to substitute for young domestic workers of all
education levels, resulting in a decrease in their relative demands. By contrast, it is expected
to mostly complement older domestic workers of different education levels.
3
Data and descriptive statistics
In the first part of this section, I describe the data and the construction of variables. In the
second part, I present descriptive statistics for material and service offshoring, and for key
labour variables such as the wage bill and employment shares of the nine age-skill groups of
workers and their real hourly wages.
3.1 Data and variables
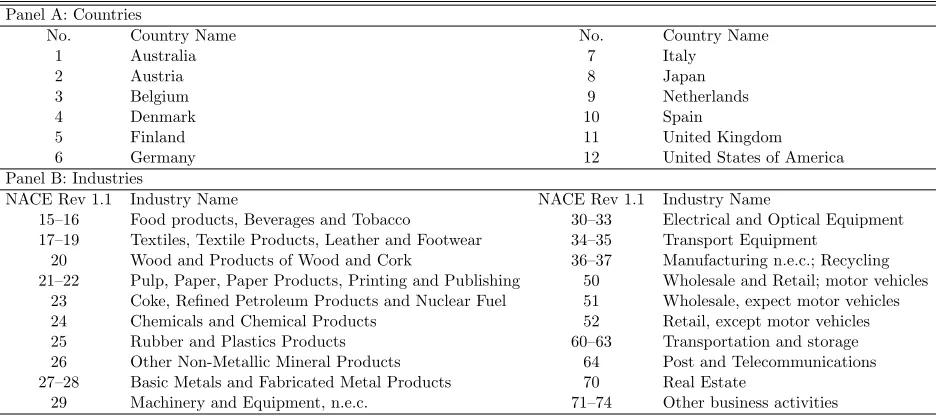
For the purpose of the empirical analysis, I create a panel of 12 countries, 20 manufacturing
and service industries and 11 years. All countries examined are advanced economies and are
displayed in Panel A of Table 1. Panel B of the same table displays the 13 manufacturing
and 7 service industries examined, which are aggregated at the two-digit level according to
the NACE Rev. 1.1. The selection of countries has been driven by their development status
and the availability of data on main labour variables. Also, the selected set of industries
accounts for the largest share of a country’s market economy and is very similar or identical
to those used in previous relevant studies. The time period examined spans over 1995–2005.
Its selection has been determined by the merger of the labour data with the trade data used
for the construction of the measures of material and service offshoring.
<< Table1about here >>
EU KLEMS is the main source of information, comparable across countries, industries
deflators. Regarding labour variables, it includes information on the wage bill and employment
shares of heterogeneous workers in age and skill. Employment is captured by the hours of
work. It also includes information on the total wage bill and the total hours worked. The
youngest, middle-aged and oldest workers are those aged 15–29, 30–49, and 50 and over,
respectively. Skill is captured by the level of education. Workers with at least a bachelor’s
degree are labeled as high-skilled (HS), those with upper-secondary education or vocational
training are labeled as medium-skilled (MS), and those with lower-secondary education or no
formal qualification are labeled as low-skilled (LS). Using this labour disaggregation, I capture
empirically the crucial aspects of employment associated with the age profile of a worker that
are described in Section2, in addition to her education level. I compute the hourly wage for
each of the nine age-skill groups of workers as the ratio of their wage bill to their hours of
work. Then, I compute the relative wage for each age-skill group, that is, the ratio of the
hourly wage for each age-skill group to the hourly wage for the benchmark age-skill group,
which in my case is selected to be the group of the oldest low-skilled workers.
Furthermore, EU KLEMS includes information on gross output, gross fixed capital
forma-tion, total purchases of non-energy intermediate material and service inputs, and the share
of investment in Information and Communication Technologies (ICT) in total capital
invest-ment. The latter is used as a proxy for technological change and ranges between 0 and 1. Since
information on capital investment of Belgium is not available in the EU KLEMS database, I
retrieve this information from the OECD database for Structural Analysis (STAN). As 1995
is the base year for the deflators of variables in the EU KLEMS, while in the STAN is the
year 2000, I re-base the capital deflator of the STAN database so that is in line with the
cor-responding EU KLEMS deflator. Then, I divide the nominal gross fixed capital formation of
Belgium with the re-based deflator in order to compute the real gross fixed capital formation
of this country. For cross-country comparability of monetary variables, I convert these from
national currencies in US dollars with the use of exchange rate data from the OECD.
Following the extant literature, I construct the measures of material and service offshoring
as the shares of imported material and service inputs, respectively, in total purchases of
non-energy intermediate material and service inputs.6 I retrieve information on imported material
and service inputs from the World Input-Output Database (WIOD).7 The shares range
be-tween 0 and 1. All import values are in US dollars. The supplying industries of material and
6
service inputs considered are identical to the 13 sourcing manufacturing and 7 sourcing
ser-vice industries, respectively, listed in Table1. In addition, the database includes 40 supplying
countries8 and the Rest of World (RoW). The sum of imports from the 40 supplying countries
and the RoW allows for the construction of the overall measures of material and service
off-shoring of the 12 countries examined (MOFF, SOFF). For the construction of the measures
of material and service offshoring to high-income and low/middle-income countries, I use only
the information on imports from the 40 supplying countries, as the RoW is unclassified.9
In order to classify offshoring destination countries by their income level, I rely on the
World Bank’s Historical Country Classification By Income. In this classification, countries
are classified as high-income, upper-middle-income, lower-middle-income and low-income,
ac-cording to their GNI per capita. In the benchmark case, I consider an offshoring destination
country as high-income (HI) if it belongs to the group of high-income countries for at least half
of the years of the period examined, 1995–2005. Similarly, I consider an offshoring destination
country as low/middle-income (LMI) if it belongs to the group of upper-middle-income,
lower-middle-income or low-income countries for at least half of the period examined. Alternatively,
I consider the World Bank’s income group(s) to which offshoring destination countries belong
in 1995 (HI2, LMI2) –the first year of the sample–, as well as their OECD membership status
by that year (OECD, non-OECD).10
Using alternative normalisations of the measures of material and service offshoring, I
compute these as the shares of imported material and service inputs in gross output (Egger &
Egger,2005,Geishecker,2006,Helg & Tajoli,2005,Strauss-Kahn,2004;Ekholm & Hakkala,
2005) and in gross value added (Ekholm & Hakkala,2005). I draw information on gross value
added and its deflator from EU KLEMS.
8
These are: Australia, Austria, Bulgaria, Belgium, Brazil, Canada, China, Cyprus, Czech Republic, Den-mark, Estonia, Finland, France, Germany, Greece, Hungary, Indonesia, India, Ireland, Italy, Japan, Korea, Lithuania, Luxembourg, Latvia, Mexico, Malta, the Netherlands, Poland, Portugal, Romania, Russia, Slo-vakia, Slovenia, Spain, Sweden, Turkey, Taiwan, United Kingdom, United States of America.
9
The exclusion of imports from the RoW results in little loss of information. In particular, the sample mean of the sum of material offshoring to high- and low/middle-income countries as a share in overall material offshoring is 0.87. The corresponding sample mean for service offshoring is 0.84.
10
3.2 Descriptive statistics
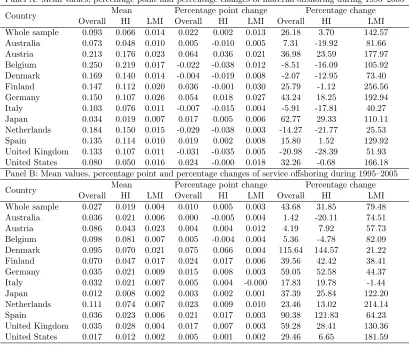
Table 2 displays the mean values, percentage point changes and percentage changes of
ma-terial offshoring (Panel A) and service offshoring (Panel B) during 1995–2005 for the whole
sample and by country. The statistics are produced for material and service offshoring to all
destination countries available (overall), as well as for material and service offshoring to
high-income and low/middle-high-income countries. The highest mean values of material and service
offshoring correspond to countries of relatively small size, such as Austria, Belgium, Denmark
and the Netherlands.
<< Table2about here >>
The average material offshoring to all destination countries is greater than the
corre-sponding average service offshoring for the whole sample and for each of the 12 countries
examined. This holds also when I distinguish between high-income and low/middle-income
offshoring destinations. In terms of growth rates over the period examined, aggregate
mate-rial offshoring increased for some countries, while it decreased for others, namely, Belgium,
Denmark, Italy, the Netherlands and the UK. Instead, the aggregate service offshoring of all
12 countries increased. As all 12 countries experienced increases in aggregate material
off-shoring to low/middle-income destinations, the declines in aggregate material offoff-shoring of the
5 aforementioned countries are accounted for by declines in material offshoring to high-income
destinations. The increases in aggregate service offshoring of all 12 countries are accounted for
by increases in service offshoring to both high-income and low/middle-income destinations.
In addition, aggregate service offshoring increased more than aggregate material offshoring
for the whole sample and for Finland, Germany and Spain. Instead, it increased by less
for Australia, Austria, Japan and the US. For most of the 12 countries, service offshoring to
high-income destinations grew more than material offshoring to the same type of destinations,
while it grew by less in the case of low/middle-income destinations.
According to the same table, the average material and service offshoring to high-income
destination countries is greater than the average material and service offshoring, respectively,
to low/middle-income destination countries for the whole sample and by country. However,
both material and service offshoring to low/middle-income destinations grew faster than
of the countries examined.11 As stressed earlier, the distinction between high-income and
low/middle-income offshoring destinations is primarily justified by the different motives of
firms to offshore to the two destination types. The documented quantitative and, in many
cases, qualitative differences in the trends of material and service offshoring to the two
desti-nation types provide additional support to this approach.
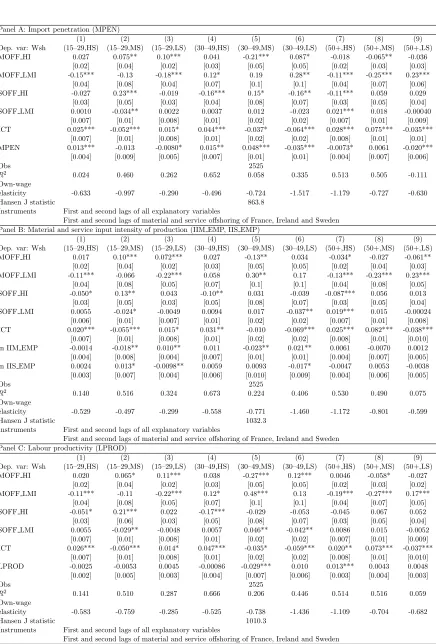
Shifting the focus from offshoring onto the nine age-skill groups of workers, Table3displays
the mean values, percentage point changes and percentage changes of their wage bill shares
(Panel A), employment shares (Panel B) and real hourly wages (Panel C) during 1995–2005
for the whole sample. According to Panels A and B, the medium-skilled workers of all three
age profiles and the middle-aged high-skilled account, on average, for the highest shares of the
total wage bill and total employment. Within each age group of workers, the medium-skilled
also have, on average, the highest wage bill and employment shares.12 Within each skill group
of workers, the highest wage bill and employment shares are, on average, accounted for by
the middle-aged.
<< Table3about here >>
The growth rates in Panels A and B reveal that the middle-aged and the oldest
high-skilled and medium-high-skilled workers experienced increases in their wage bill and employment
shares, while the youngest medium-skilled and skilled and the middle-aged and oldest
low-skilled experienced declines. The youngest high-low-skilled workers experienced a decrease and an
increase, respectively, in their wage bill and employment shares. The largest increases in the
wage bill and employment shares were experienced by the oldest high-skilled workers, while
the smallest increases were experienced by the middle-aged medium-skilled and the youngest
high-skilled, respectively. The largest decreases in the wage bill shares were experienced by
the youngest and middle-aged low-skilled, while the largest decrease in the employment shares
is experienced by the middle-aged low-skilled.
11I obtain very similar growth rates of material and service offshoring when I normalise their measures by gross output and gross value added, as well as when I classify high-income and low/middle-income offshoring destination countries according to the World Bank’s classification in 1995 and their OECD membership status by this year. Although the patterns are very similar, the mean values of the measures of material and service offshoring that are normalised by gross output are smaller than those of the benchmark measures, while the mean values of the measures of material and service offshoring that are normalised by gross value added are larger. The relevant tables are available upon request.
The mean values of real hourly wages in Panel C indicate that, within each skill group, the
oldest workers earn, on average, the highest real hourly wage, while the middle-aged workers
earn, on average, the second highest. This evidence can be viewed as a compensation to older
workers within a skill group for their greater human capital, work experience and stronger ties
with employers. It could also be explained only by seniority, rather than higher productivity
levels. Within each age group, I find evidence for skill premia, as high-skilled workers earn, on
average, the highest real hourly wage, while the medium-skilled earn the second highest. This
evidence is in line with the literature documenting skill premia without taking into account
workers’ age profiles (e.g. Hijzen et al.,2005;Crin`o,2012). In terms of growth rates, all
age-skill groups of workers experienced increases in their real hourly wages except for the youngest
and middle-age low-skilled and the oldest high-skilled who experienced declines. The largest
and smallest increases in real hourly wages were experienced by the middle-aged high-skilled
and the youngest medium-skilled, respectively. The largest decline in the real hourly wage
was experienced by the youngest low-skilled.13
According to the three panels of Table3, the declines in the wage bill shares of the youngest
and middle-aged low-skilled workers are driven by declines in both their employment shares
and real hourly wages, while the declines in the wage bill shares of the youngest
medium-skilled and the oldest low-medium-skilled workers are driven mostly by declines in their employment
shares. Also, the decline in the wage bill share of the youngest high-skilled workers is driven
by the lower increases in their employment shares and real hourly wages as compared to those
of older more skilled workers. The increases in the wage bill shares of the middle-aged
high-skilled and medium-high-skilled and the oldest medium-high-skilled workers are driven by increases in
both their employment shares and real hourly wages. By contrast, the increase in the wage
bill share of the oldest high-skilled is driven mostly by an increase in their employment share.
The simultaneous increase in material and service offshoring, especially to low/middle-income
destinations, might have had an impact on the aforementioned trends in wage bill shares.
I study the causal relationship between changes in offshoring and changes in the age-skill
composition of labour demand in the next sections.
4
Econometric model and estimation strategy
In this section, I derive the econometric model and discuss the strategy that I implement for
its estimation.
4.1 Econometric model
According to the labour demand approach, the representative firm optimises its labour
de-mand for given wages since labour supply is assumed to be perfectly inelastic. In my analysis,
this implies that when offshoring opportunities arise, the representative firm adjusts optimally
its demand for the nine age-skill groups of domestic workers. Hence, offshoring acts as a shift
factor which increases or decreases the relative demand for each of the nine labour types.
Due to lack of information on the price of capital, this production factor is treated as
quasi-fixed, implying that the cost function is of the short-run form (Berman et al., 1994).
The cost-minimisation problem that the representative firm faces is as follows:
CSR(W, Y, K, Z0) = min(W ·E0) s.t. Y =f(E, K, Z0) (1)
CSR represents the short-run cost of the firm which in my case comprises only the total
wage bill. W and E are vectors of hourly wages and total hours worked, respectively, of
the nine age-skill groups of workers. Y stands for output, K for capital and Z is a vector
comprising labour demand shifters, namely, material and service offshoring to high-income
and low/middle-income countries and the proxy for technological change.
In accord with previous studies, I consider the cost function to be of translog
represen-tation.14 Total differentiation of the cost function with respect to prices of variable factors
(i.e., wages) yields a system of nine wage bill share equations that correspond to the age-skill
group of workers examined:
14
W sha,s =βa,s+
X
g∈A
X
v∈S
βa,s,g,vlnWg,v+βa,s,Y lnY +βa,s,KlnK+
X
z∈Z
βa,s,zZ,
∀a, g∈A={15−29,30−49,50+},∀s, v∈S={HS, M S, LS}
(2)
The dependent variable of equation (2) is the wage bill share of the age-skill group of
workers (a,s) in the total wage bill. The first set of explanatory variables comprises the log of
relative wages, that is, the wage for each age-skill group of workers relative to the wage for the
benchmark age-skill group of workers. The benchmark group in my case is that of the oldest
low-skilled. Capital and gross output also enter the model in logs. Note, though, that the
labour demand shifters in Z are not in logs, as they represent non-monetary shares ranging
between 0 and 1. The coefficient estimates of material and service offshoring to high-income
and low/middle-income countries in βa,s,z are the main focus of this analysis. When these
are positive and statistically significant, they suggest that offshoring increases the wage bill
share of the age-skill group (a,s), or equivalently, shifts this group’s relative demand schedule
outwards. Similarly, when they are negative and statistically significant, they suggest that
offshoring decreases the wage bill share of the age-skill group (a,s), or equivalently, shifts this
group’s relative demand schedule inwards.
Linear price homogeneity and symmetry imply the following constraints on the parameters:
X
a∈A
X
s∈S
βa,s = 1;
X
a∈A
X
s∈S
βa,s,g,v =
X
g∈A
X
v∈S
βg,v,a,s = 0;
X
a∈A
X
s∈S
βa,s,Y =
X
a∈A
X
s∈S
βa,s,K =
X
a∈A
X
s∈S
βa,s,z = 0;
βa,s,g,v=βg,v,a,s;βq,z =βz,q
(3)
In order for the cost function to be well behaved, economic theory requires that is concave
in the wages of the nine age-skill groups of workers. This is satisfied if and only if the
matrix of wage elasticities is negative semi-definite. The necessary condition for negative
semi-definiteness is that the own-wage elasticities which are on the diagonal of this matrix
are non-positive, while the sufficient condition is that all odd-numbered and even-numbered
principal minors are non-positive and non-negative, respectively. Due to the fact that the
the literature is to test whether the necessary condition is satisfied on average (Hijzen et al.,
2005;Crin`o,2012). To this purpose, I compute the own-wage elasticity of the age-skill group
of workers (a,s) as the difference of unity from the ratio of the coefficient estimate of the
corresponding relative wage to the sample mean of the corresponding wage bill share:
a,s,a,s= β¯a,s,a,s
W sha,s −1,∀a∈A,∀s∈S. (4)
4.2 Estimation strategy
For the estimation of the system in (2), I add to it the vector of error termsua,s,∀a∈A,∀s∈
S, for which I assume that u ∼= N(0,Σ) , where Σ = E(u0u). Given that the right-hand
side of the nine equations is identical and, as shown in equation (3), there are cross-equation
constraints stemming from linear price homogeneity and symmetry, it is very likely that the
error terms of the system are correlated (Berndt, 1991). When all explanatory variables
are treated as exogenous, the system is estimated by Seemingly Unrelated Regressions (SUR)
which implies the simultaneous estimation of equations and produces more efficient coefficient
estimates. However, the estimation of all nine equations at once is not possible as their
corresponding wage bill shares add up to one, resulting in the variance-covariance matrix Σ
to be singular. The estimation of the system becomes feasible only after one of its equations
is dropped. In my estimations, I choose to drop the equation which corresponds to the oldest
low-skilled workers. As the estimates produced are not invariant to the equation dropped,
SUR estimations must be iterated (ISUR). ISUR guarantees that the parameter estimates
and the residual covariance matrix converge (Berndt & Wood,1975;Hijzen et al.,2005).
In order to control for any unobserved heterogeneity across country-industry pairs, I
de-viate all variables of the estimating model from their mean values at the country-industry
level, rather than taking their first difference.15 I also control for any time-varying factors
common to all country-industry pairs (e.g. global demand shock) by adding to the system
time-specific fixed effects. Using the constraints in equation (3), I obtain estimates for the
parameters excluded from the estimated equations, as well as for all parameters of the
equa-tion that is dropped from the system. Then, I apply the delta method in order to retrieve
their asymptotic standard errors.
15
First-differencing may exacerbate the bias due to measurement error in the data (Griliches & Hausman,
As the representative firm is likely to make simultaneously decisions over offshoring and
optimal labour utilisation, simultaneity bias may be a crucial issue in the estimating model. I
deal with it by implementing a very similar instrumentation strategy to that of other pertinent
empirical studies. As instruments for material and service offshoring to high-income and
low/middle-income countries, I use their first and second lags, which are expected to be
strongly correlated with the instrumented variables and uncorrelated with the error terms
(Crin`o, 2012). I also use the first two lags of material and service offshoring to the two
types of destinations of three developed countries that are not included in the benchmark
sample as they do not provide information on labour variables by age and skill (Autor et al.,
2013). The three selected countries are France, Ireland and Sweden, whose levels and trends
of offshoring are very similar to those of the 12 countries of the benchmark sample.16 Hence,
these instruments are also expected to be strongly correlated with the four instrumented
measures of material and service offshoring.
Although a demand shock to an industry in France, Ireland or Sweden can be transmitted
to the same or another closely-linked industry of at least one of the 12 countries in the
benchmark sample due to business-cycle synchronisation, it is unlikely that such a demand
shock can be transmitted to all country-industry pairs. Even if such a possibility exists, this
is tackled with the use of the first and second lags of the offshoring measures of the three
selected countries. In addition, the labour markets of the 12 countries of the benchmark
sample are likely to be impacted by their trade with France, Ireland and Sweden. In order
to ensure that the first- and second-lagged measures of material and service offshoring of
the three selected countries to high-income destinations are exogenous instruments, I exclude
the imports of the three countries from the 12 countries of the benchmark sample. For these
reasons, the second set of instruments is also expected to be uncorrelated with the error terms.
Similar to offshoring, the decision of the representative firm over investment in Information
and Communication Technologies is likely to be made simultaneously with its decision over
optimal labour utilisation. Hence, another source of endogeneity in the estimating model is
the proxy for technological change. I deal with this issue by instrumenting this variable with
its first and second lags.
An important implication of the industry-level analysis is that the assumption that labour
supply is perfectly inelastic may no longer be applicable (Hijzen, 2005). An increase in
16
industry-level labour demand may increase industry-level wages sufficiently so that there
will be an increase in labour supply, as workers will be more willing to work in an industry
which pays higher wages. In addition, although the labour demand approach assumes that
wages and output are fixed, the specific-factors demand approach considers wages and output
to adjust to labour demand shocks (Egger & Egger, 2005;Hijzen,2005). Capital utilisation
may also be correlated with unobserved factors that affect the wage bill shares (Strauss-Kahn,
2004). For these reasons, relative wages, gross output and capital should also be considered
as endogenous. Following the extant literature, I instrument each of these variables with its
first and second lags.
Since endogeneity is a crucial issue in the estimating model, the main results are based
on estimations that treat all explanatory variables as endogenous. In this case, system 2 is
estimated by Iterated Three-Stages Least Squares, I3SLS (Crin`o,2012). The missing
observa-tions of lagged variables which serve as instruments in these estimaobserva-tions are filled with zeros
(Arellano & Bond,1991).
5
Empirical results
Table4displays the results from I3SLS estimations of the system of wage bill share equations
corresponding to the nine age-skill groups of workers. In Panel A, all explanatory variables
are treated as endogenous. The positive and statistically significant coefficient estimates of
MOFF HI in columns 2, 3 and 6 indicate that material offshoring to high-income destination
countries impacts positively the wage bill shares of the youngest medium-skilled and
low-skilled workers and of the middle-aged low-low-skilled. By contrast, it impacts negatively the
wage bill shares of the middle-aged and oldest medium-skilled, as indicated by the negative
and statistically significant coefficient estimates of this explanatory variable in columns 5 and
8. The coefficient estimates of MOFF LMI indicate that material offshoring to
low/middle-income destination countries impacts negatively the wage bill shares of the youngest workers
of all three skill levels and of the oldest high-skilled and medium-skilled (columns 1–3, 7 and
8), while it impacts positively the wage bill share of the middle-aged workers of all three skill
levels and of the oldest low-skilled (columns 4–6 and 9).
In addition, service offshoring to high-income destination countries (SOFF HI) impacts
middle-aged low-skilled (columns 1, 4, 6 and 7). It, instead, impacts positively the wage bill
share of the youngest medium-skilled workers (column 2). Service offshoring to
low/middle-income destination countries (SOFF LMI) impacts negatively the wage bill shares of the
youngest medium-skilled and the middle-aged low-skilled workers (columns 2 and 6), while
it impacts positively the wage bill share of the oldest high-skilled (column 7). The proxy for
technological change (ICT) impacts positively the wage bill shares of the high-skilled workers
of all three age profiles, the youngest low-skilled and the oldest medium-skilled (columns 1, 3,
4, 7 and 8), while it impacts negatively the wage bill shares of the youngest and middle-aged
medium-skilled and those of the middle-aged and oldest low-skilled (columns 2, 5, 6 and 9).
<< Table4about here >>
In line with economic theory, the own-wage elasticities are negative in all nine columns.
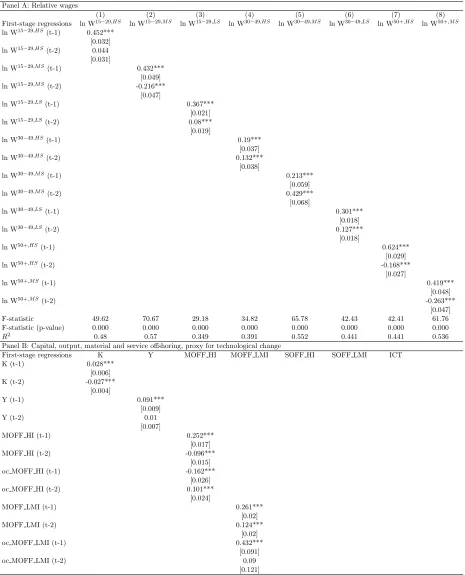
The first-stage results are shown in TableB1of the Online Appendix. The coefficient estimates
of most of the selected instruments are statistically significant. The F-statistic is above 10 and
its p-value is lower than 10% in all first-stage regressions. The R-squared of these regressions
ranges from 18.4% to 57%. Hence, I conclude that the selected instruments are correlated
with the instrumented variables. Some caution is only required for the test for over-identifying
restrictions, as the Hansen J statistic (976.3), shown in Panel A of Table 4, is greater than
the degrees of freedom of the system (361).17
In Panels B and C, I re-estimate the system while treating as endogenous only the four
offshoring measures and the proxy for technological change. The set of instruments for these
labour demand shifters in the estimations of Panel B is identical to that of Panel A. By
contrast, the set of instruments for the same labour demand shifters in the estimations of
Panel C includes only the first-lagged variables that are used as instruments in the estimations
of Panel A. In both panels, the results bear a very close resemblance to those of Panel A and
all own-wage elasticities are negative, in line with economic theory. The Hansen J statistic of
Panel B regressions (458) is almost half of the Hansen J statistic in Panel A, but is still greater
than the degrees of freedom of the system (291).18 However, in Panel C regressions, where
there is a further reduction in the number of instruments used, the Hansen J statistic (193.4) is
17Degrees of freedom = G * m - k, where G: number of simultaneous regressions (8), m: number of instruments (48), k: number of endogenous variables (23).
smaller than the degrees of freedom of the system (219),19 indicating that the over-identifying
restrictions are satisfied. In addition, the first-stage results of the I3SLS estimations of Panels
B and C are satisfactory, suggesting that the selected instruments are correlated with the
instrumented variables (TablesB2and B3).
In sum, I find that material and service offshoring to high-income countries decrease the
relative demands for older more skilled workers, while they increase the relative demands
for the youngest less skilled. As discussed in the theoretical background, these findings are
explained by the relative abundance of high-income offshoring destination countries in older
workers of relatively high education who acquire exceptional know-how, expertise and work
experience that are highly valued by their own employers and other firms as well. Also, I find
that material and service offshoring to low/middle-income countries decrease the relative
de-mands for the youngest workers of all skills, while they mostly increase the relative dede-mands
for older workers.20 According to the theoretical background, these findings are explained
by the relative abundance of low/middle-income offshoring destination countries in relatively
young low- and high-educated workers with common know-how and expertise, implying that
their wages are lower than those of workers with similar education levels, know-how and
ex-pertise in high-income countries. Technological change favours mainly more skilled workers,
validating empirically the term “skill-biased technological change” (SBTC), even when
con-trolling for the worker’s age profile. In particular, it increases the relative demands for the
high-skilled of all age profiles and the oldest medium-skilled, while it decreases the relative
demands for the younger medium-skilled and the older low-skilled.
Robustness checks
In the remainder of this section, I discuss the robustness of the main results. In relatively
rigid labour markets, changes in wage bill shares are mostly explained by adjustments in
employment rather than in wages. For this reason, in Panel A of Table 5, I estimate the
benchmark system of equations with employment shares as the dependent variables in lieu of
19
Degrees of freedom = G * m - k, where G: number of simultaneous regressions (8), m: number of instruments (29), k: number of endogenous variables (13).
20
wage bill shares.21 Two more ways of controlling for labour market rigidities are shown in
Panels B and C of the same table. In Panel B, I add to the system the index of employment
protection legislation strictness (EPL), developed by the OECD, capturing the limitations
imposed on firms to hire and fire workers.22 The index ranges between 1 and 6, with higher
values indicating a more rigid labour market in the country. As the strength of collective
representation of workers determining the wage setting process can be indicative of the degree
of labour market rigidities, in Panel C, I add to the system union density (UD), also developed
by the OECD. Union density is computed as the share of members in labour unions in total
employment. The additional controls in the regressions of Panel B and C are treated as
endogenous and are instrumented with their first and second lags. In all three cases, the main
results remain largely unchanged, indicating their robustness to cross-country labour market
heterogeneity.
In additional robustness checks, shown in Table 6, I control for factors which may be
correlated with material and service offshoring. As higher economic integration implies an
increase in imports of both intermediates and final output, I control in the regressions of Panel
A for import penetration (MPEN), that is, for the share of imports of consumption goods in
domestic consumption.23 For the construction of this variable, I use data from the OECD
Bilateral Trade Database by Industry and End-Use Category. In the regressions of Panel B, I
control for material input intensity (IIM EMP) and service input intensity (IIS EMP). These
are computed as the ratios of purchases of material and service inputs to total employment,
respectively. The intuition for this check is that when intermediate input intensity of a firm’s
production increases, the engagement of the firm in material and service offshoring is likely
to increase as well. Material and service offshoring is also likely to increase in an industry
which experiences a positive productivity shock. I control for this possibility in the regressions
of Panel C to which I add labour productivity (LPROD). This is measured as the share of
value added in total hours worked. Data on material and service input intensity, as well as
on labour productivity are collected from EU KLEMS. Same as in the previous table, the
additional controls in the regressions of all panels of Table 6 are treated as endogenous and
are instrumented with their first and second lags. Controlling for these concomitant factors
21For a similar approach, seeStrauss-Kahn(2004), Egger & Egger(2005), Hansson (2005), Helg & Tajoli (2005), andMinondo & Rubert(2006).
22
This index comprises 18 items which are gathered in three main areas: 1) employment protection of regular workers against individual dismissal, 2) specific requirements for collective dismissals, 3) information on temporary forms of employment.
23Import penetration is calculated as M
does not alter quantitatively and qualitatively the benchmark results.
In the final group of robustness checks, shown in Table 7, I ensure that the main results
are insensitive to the use of alternative measures of material and service offshoring. The
measures of material and service offshoring in the regressions of Panel A are computed as the
shares of imported material and service inputs, respectively, in gross output.24 The measures
of material and service offshoring in the regressions of Panel B are constructed according to
the World Bank’s classification of high-income and low/middle-income countries in 1995.
6
Conclusion
By providing novel empirical evidence on the impact of offshoring on the age-skill composition
of labour demand, this paper firmly supports the argument that the age profile of a worker is at
least as crucial a criterion as the skill to be taken into account by firms while they make optimal
labour utilisation adjustments through offshoring. The analysis is conducted on a sample of
manufacturing and service industries in 12 developed countries for the period 1995–2005. Its
main findings are that material and service offshoring to high-income countries decrease the
relative demands for older more skilled workers, while they increase the relative demands for
the youngest less skilled. In addition, material and service offshoring to low/middle-income
countries decrease the relative demands for the youngest workers of all skills, while they mostly
increase the relative demands for older workers. These findings are explained by the relative
abundance of offshoring destinations in skills and in aspects of employment associated with
workers’ age profiles, such as the level of human capital and expertise, the returns to training
and the level of employment protection.
Despite the novelty of the aforementioned findings, further research with the use of
matched employer-employee data could account for the role of offshoring in inducing workers
to become unemployed, to exit permanently the labour market (e.g. early retirement of older
workers), or to switch to another employer operating in the same industry or another industry.
In addition, offshoring may impact the terms and conditions under which workers of different
age and skill profiles are employed, such as their levels of job insecurity and earnings
volatil-ity, their bargaining power vis-`a-vis their employers, and the levels of their contribution to
24
non-wage costs (e.g. health insurance and social security costs). As changes in labour demand
elasticities can capture changes in employment terms and conditions (Rodrik, 1997), future
research could study the effects of offshoring on the elasticities of demand for heterogeneous
References
Amiti, M., & Wei, S.-J. (2005). Fear of Service Outsourcing: Is It Justified? Economic
Policy,20(42), 308–347.
Anderton, B., & Brenton, P. (1999). Outsourcing and Low-skilled Workers in the UK.Bulletin
of Economic Research,51(4), 267–286.
Anderton, R., Brenton, P., & Oscarsson, E. (2002). What’s Trade Got to Do with It?
Relative Demand for Skills within Swedish Manufacturing. Review of World Economics
(Weltwirtschaftliches Archiv),138(4), 629–651.
Arellano, M., & Bond, S. (1991). Some Tests of Specification for Panel Data: Monte Carlo
Evidence and an Application to Employment Equations. Review of Economic Studies,
58(2), 277–297.
Autor, D. H., Dorn, D., & Hanson, G. H. (2013). The China Syndrome: Local Labor Market
Effects of Import Competition in the United States. American Economic Review,103(6),
2121–2168.
Berman, E., Bound, J., & Griliches, Z. (1994). Changes in the Demand for Skilled Labor within
U.S. Manufacturing: Evidence from the Annual Survey of Manufactures. The Quarterly
Journal of Economics,109(2), 367–397.
Berndt, E. R. (1991). The Practice of Econometrics, Classic and Contemporary. Reading,
MA: Addison-Wesley.
Berndt, E. R., & Wood, D. O. (1975). Technology, Prices, and the Derived Demand for
Energy. The Review of Economics and Statistics,57(3), 259–268.
Blossfeld, H.-P., Buchholz, S., Bukodi, E., & Kurz, K. (2009). Young Workers, Globalization
and the Labor Market - Comparing Early Working Life in Eleven Countries. Cheltenham (UK) and Northampton (MA, USA): Edward Elgar.
Blossfeld, H.-P., Buchholz, S., & Hof¨acker, D. (2006). Globalization, Uncertainty and Late
Careers in Society. London & New York: Routledge.
Blossfeld, H.-P., Hof¨acker, D., & Bertolini, S. (2011). Youth on Globalised Labour
Blossfeld, H.-P., Klijzing, E., Mills, M., & Kurz, K. (2005). Globalization, Uncertainty and Youth in Society. London et al.: Routledge.
Buchholz, S., Hof¨acker, D., Mills, M., Blossfeld, H.-P., Kurz, K., & Hofmeister, H. (2009). Life
Courses in the Globalization Process: The Development of Social Inequalities in Modern
Societies. European Sociological Review,25(1), 53–71.
Crin`o, R. (2010). Service Offshoring and White-Collar Employment. Review of Economic
Studies,77(2), 595–632.
Crin`o, R. (2012). Service Offshoring and the Skill Composition of Labour Demand. Oxford
Bulletin of Economics and Statistics,74(1), 20–57.
Dalen, H. P. V., & Henkens, K. (2005). The Double Standard in Attitudes Toward Retirement
– The Case of the Netherlands. The Geneva Papers on Risk and Insurance - Issues and
Practice,30(4), 693–710.
Daniel, K., & Heywood, J. S. (2007). The Determinants of Hiring Older Workers: UK
Evidence. Labour Economics,14(1), 35–51.
Dorn, D., & Sousa-Poza, A. (2010). “Voluntary” and “Involuntary” Early Retirement: an
International Analysis. Applied Economics,42(4), 427–438.
Egger, H., & Egger, P. (2005). Labor Market Effects of Outsourcing under Industrial
Inter-dependence. International Review of Economics & Finance,14(3), 349–363.
Ekholm, K., & Hakkala, K. (2005). The Effect of Offshoring on Labor Demand: Evidence
from Sweden (Working Paper Series No. 654). Research Institute of Industrial Economics.
European Policy Committee. (2001). Budgetary Challenges Posed by Ageing Populations:
The Impact on Public Spending on Pensions, Health and Long-Term Care for the Elderly
and Possible Indicators of the Long-Term Sustainability of Public Finances. European
Commission (ECFIN), Brussels.
European Policy Committee. (2003). The Impact of Ageing Populations on Public Finances:
Overview of Analysis Carried Out at EU Level and Proposals for a Future Work Programme.
European Policy Committee. (2006). The Impact of Ageing on Public Expenditure:
Projec-tions for the EU25 Member States on Pensions, Health Care, Long-Term Care, Education
and Unemployment Transfers (2004-2050). European Commission (ECFIN), Brussels.
Feenstra, R. C., & Hanson, G. H. (1996). Globalization, Outsourcing, and Wage Inequality.
American Economic Review,86(2), 240–245.
Feenstra, R. C., & Hanson, G. H. (1999). The Impact of Outsourcing and High-Technology
Capital on Wages: Estimates For the United States, 1979–1990. The Quarterly Journal of
Economics,114(3), 907–940.
Geishecker, I. (2006). Does Outsourcing to Central and Eastern Europe Really Threaten
Manual Workers’ Jobs in Germany? The World Economy,29(5), 559–583.
Geishecker, I., & G¨org, H. (2011). Services Offshoring and Wages: Evidence from Micro Data.
Oxford Economic Papers.
Griliches, Z., & Hausman, J. A. (1986). Errors in Variables in Panel Data. Journal of
Econometrics,31(1), 93–118.
Grossman, G. M., & Rossi-Hansberg, E. (2008). Trading Tasks: A Simple Theory of
Off-shoring. American Economic Review,98(5), 1978–1997.
Hansson, P. (2005). Skill Upgrading and Production Transfer within Swedish Multinationals.
Scandinavian Journal of Economics,107(4), 673–692.
Heckman, J. (2000). Policies to Foster Human Capital.Research in Economics,54(1), 3–56.
Helg, R., & Tajoli, L. (2005). Patterns of International Fragmentation of Production and
the Relative Demand for Labor. The North American Journal of Economics and Finance,
16(2), 233–254.
Hellerstein, J. K., & Neumark, D. (1995). Are Earnings Profiles Steeper Than Productivity
Profiles? Evidence from Israeli Firm-Level Data. The Journal of Human Resources,30(1),
89–112.
Hellerstein, J. K., Neumark, D., & Troske, K. R. (1999). Wages, Productivity, and Worker
Characteristics: Evidence from Plant? Level Production Functions and Wage Equations.
Hijzen, A. (2005). A Bird’s Eye View of International Outsourcing: Data, Measurement and
Labour Demand Effects. Economie Internationale(104), 45–63.
Hijzen, A., G¨org, H., & Hine, R. C. (2005). International Outsourcing and the Skill Structure
of Labour Demand in the United Kingdom. Economic Journal,115(506), 860–878.
Hof¨acker, D. (2012). Globalisation and the Labour Market Situation of Older Workers:
Ex-ploring Trends, Challenges and Strategies for Adaptation (Tech. Rep.). Thematic Review Seminar on “Employment Policies to Promote Active Ageing”.
Hsieh, C.-T., & Woo, K. T. (2005). The Impact of Outsourcing to China on Hong Kong’s
Labor Market. American Economic Review,95(5), 1673–1687.
Hutchens, R. M. (1988). Do Job Opportunities Decline with Age? Industrial and Labor
Relations Review,42(1), 89–99.
Lanciano, E., & Nitta, M. (2010). How Do Japanese and French Firms in Steel Industry
Address the Institutional Change and the Globalization? Employment Adjustment and Age
Management in a Downsizing Context. In International Sociology Association. Goteborg,
Sweden.
Lazear, E. P. (1981). Agency, Earnings Profiles, Productivity, and Hours Restrictions.
Amer-ican Economic Review,71(4), 606–620.
Mahlberg, B., Freund, I., Cuaresma, J. C., & Prskawetz, A. (2013). Ageing, Productivity and
Wages in Austria. Labour Economics,22(Supplement C), 5–15. (Supplement: Ageing and
Productivity)
Mayhew, K., & Rijkers, B. (2004). How to Improve Human Capital of Older Workers or
the Sad Tale of the Magic Bullet (Tech. Rep.). EC-OECD Seminar on Human Capital and Labour Market Performance.
Minondo, A., & Rubert, G. (2006). The Effect of Outsourcing on the Demand for Skills in
the Spanish Manufacturing Industry. Applied Economics Letters,13(9), 599–604.
Neumark, D. (2009). The Age Discrimination in Employment Act and the Challenge of
Population Aging. Research on Aging,31(1), 41–68.
OECD. (2006a). Live longer, work longer. Paris: OECD Publishing.
OECD. (2006b). OECD Employment Outlook. Paris: OECD Publishing.
OECD. (2011). Pensions at a Glance 2011: Retirement-Income Systems in OECD and G20
countries. Paris: OECD Publishing.
O’Mahony, M., & Peng, F. (2009). Skill bias, age and organizational change (MPRA Paper
No. 38767). University Library of Munich, Germany.
Rodrik, D. (1997).Has Globalization Gone Too Far? (Tech. Rep.). Washington, DC: Institute
for International Economics.
Schr¨oder, H., Hof¨acker, D., & Muller-Camen, M. (2009). HRM and the Employment of Older
Workers: Germany and Britain Compared. International Journal of Human Resources
Development and Management,9, 162–179.
Strauss-Kahn, V. (2004). The Role of Globalization in the Within-Industry Shift Away from
Unskilled Workers in France. InChallenges to Globalization: Analyzing the Economics (pp.
209–234). National Bureau of Economic Research, Inc.
Timmer, M. (2012). The World Input-Output Database (WIOD): Contents, Sources and
Methods (Tech. Rep. No. Version 0.9). European Commission Research Directorate Gen-eral.
Vandenberghe, V., Waltenberg, F., & Rigo, M. (2013). Ageing and Employability. Evidence
from Belgian Firm-Level Data. Journal of Productivity Analysis,40(1), 111–136.
Yan, B. (2006). Demand for Skills in Canada: The Role of Foreign Outsourcing and
Information-Communication Technology. The Canadian Journal of Economics,39(1), 53–
Tables with main descriptive statistics
Table 1: Countries and industries
Panel A: Countries
No. Country Name No. Country Name
1 Australia 7 Italy
2 Austria 8 Japan
3 Belgium 9 Netherlands
4 Denmark 10 Spain
5 Finland 11 United Kingdom
6 Germany 12 United States of America
Panel B: Industries
NACE Rev 1.1 Industry Name NACE Rev 1.1 Industry Name
15–16 Food products, Beverages and Tobacco 30–33 Electrical and Optical Equipment 17–19 Textiles, Textile Products, Leather and Footwear 34–35 Transport Equipment
20 Wood and Products of Wood and Cork 36–37 Manufacturing n.e.c.; Recycling 21–22 Pulp, Paper, Paper Products, Printing and Publishing 50 Wholesale and Retail; motor vehicles
23 Coke, Refined Petroleum Products and Nuclear Fuel 51 Wholesale, expect motor vehicles 24 Chemicals and Chemical Products 52 Retail, except motor vehicles 25 Rubber and Plastics Products 60–63 Transportation and storage 26 Other Non-Metallic Mineral Products 64 Post and Telecommunications 27–28 Basic Metals and Fabricated Metal Products 70 Real Estate
29 Machinery and Equipment, n.e.c. 71–74 Other business activities
[image:29.612.85.553.116.324.2]Table 2: Offshoring for the whole sample and by country
Panel A: Mean values, percentage point and percentage changes of material offshoring during 1995–2005
Country Mean Percentage point change Percentage change Overall HI LMI Overall HI LMI Overall HI LMI Whole sample 0.093 0.066 0.014 0.022 0.002 0.013 26.18 3.70 142.57 Australia 0.073 0.048 0.010 0.005 -0.010 0.005 7.31 -19.92 81.66 Austria 0.213 0.176 0.023 0.064 0.036 0.021 36.98 23.59 177.97 Belgium 0.250 0.219 0.017 -0.022 -0.038 0.012 -8.51 -16.09 105.92 Denmark 0.169 0.140 0.014 -0.004 -0.019 0.008 -2.07 -12.95 73.40 Finland 0.147 0.112 0.020 0.036 -0.001 0.030 25.79 -1.12 256.56 Germany 0.150 0.107 0.026 0.054 0.018 0.027 43.24 18.25 192.94 Italy 0.103 0.076 0.011 -0.007 -0.015 0.004 -5.91 -17.81 40.27 Japan 0.034 0.019 0.007 0.017 0.005 0.006 62.77 29.33 110.11 Netherlands 0.184 0.150 0.015 -0.029 -0.038 0.003 -14.27 -21.77 25.53 Spain 0.135 0.114 0.010 0.019 0.002 0.008 15.80 1.52 129.92 United Kingdom 0.133 0.107 0.011 -0.031 -0.035 0.005 -20.98 -28.39 51.93 United States 0.080 0.050 0.016 0.024 -0.000 0.018 32.26 -0.68 166.18 Panel B: Mean values, percentage point and percentage changes of service offshoring during 1995–2005
Country Mean Percentage point change Percentage change Overall HI LMI Overall HI LMI Overall HI LMI Whole sample 0.027 0.019 0.004 0.010 0.005 0.003 43.68 31.85 79.48 Australia 0.036 0.021 0.006 0.000 -0.005 0.004 1.42 -20.11 74.51 Austria 0.086 0.043 0.023 0.004 0.004 0.012 4.19 7.92 57.73 Belgium 0.098 0.081 0.007 0.005 -0.004 0.004 5.36 -4.78 82.09 Denmark 0.095 0.070 0.021 0.075 0.066 0.004 115.64 144.57 21.22 Finland 0.070 0.047 0.017 0.024 0.017 0.006 39.56 42.42 38.41 Germany 0.035 0.021 0.009 0.015 0.008 0.003 59.05 52.58 44.37 Italy 0.032 0.021 0.007 0.005 0.004 -0.000 17.83 19.78 -1.44 Japan 0.012 0.008 0.002 0.003 0.002 0.001 37.39 25.84 122.20 Netherlands 0.111 0.074 0.007 0.023 0.009 0.010 23.46 13.02 214.14 Spain 0.036 0.023 0.006 0.021 0.017 0.003 90.38 121.83 64.23 United Kingdom 0.035 0.028 0.004 0.017 0.007 0.003 59.28 28.41 130.36 United States 0.017 0.012 0.002 0.005 0.001 0.002 29.46 6.65 181.59
Notes: Overall: offshoring to all countries available; HI (LMI): offshoring to countries classified as high-income (upper-middle-income, lower-middle-income and low-income) for at least half of the period 1995–2005 by the World Bank’s Historical Country Classification By Income.
[image:30.612.97.506.99.445.2]Table 3: Wage bill shares, employment shares, and hourly wages for the whole sample
Panel A: Mean values, percentage point and percentage changes of wage bill shares during 1995–2005
15–29 30–49 50+
HS MS LS HS MS LS HS MS LS
Mean 0.048 0.150 0.026 0.151 0.355 0.069 0.043 0.111 0.048 Percentage point change -0.001 -0.067 -0.014 0.063 0.007 -0.037 0.026 0.044 -0.019 Percentage change -1.65 -35.64 -43.64 53.17 1.98 -42.64 86.72 51.36 -33.23 Panel B: Mean values, percentage point and percentage changes of employment shares during 1995–2005
15–29 30–49 50+
HS MS LS HS MS LS HS MS LS
Mean 0.046 0.197 0.046 0.094 0.344 0.087 0.023 0.104 0.059 Percentage point change 0.001 -0.069 -0.015 0.039 0.034 -0.035 0.017 0.047 -0.019 Percentage change 2.19 -29.04 -29.03 51.46 10.56 -33.85 114.61 60.64 -28.22 Panel C: Mean values, percentage point and percentage changes of real hourly wages during 1995–2005
15–29 30–49 50+
HS MS LS HS MS LS HS MS LS
Mean 21.011 15.308 11.443 32.326 20.791 15.959 37.305 21.543 16.492 Percentage point change 1.543 0.217 -1.414 3.903 0.650 -0.495 -1.039 1.122 0.636 Percentage change 7.62 1.43 -11.20 13.09 3.14 -3.04 -2.71 5.36 4.02