© 2019, IRJET | Impact Factor value: 7.211 | ISO 9001:2008 Certified Journal
| Page 5462
Traffic Analysis and Alternative Solution
Pavankumar P N
1, Vinaykumar S N
2, Basavaraj Chandrashekar Reddy
3, A Brahma Prakash Sah
41,2
Asst.prof, Dept of Civil Engineering, City Engineering College, Bangalore, Karnataka, India
3,4Student, City Engineering College, Bangalore, Karnataka, India
---***---Abstract -
Road junctions are designed at place wherevehicular traffic can move in different direction in a systematic way. The traffic at road junction is controlled and resumed in a systematic way to produce further in their respective direction with the help of traffic signals. Study on Road junction is a crucial subject and is very important so as to propose a suitable road junction design and it involves understanding the nature of traffic, kind of area, density of population, rectifying the present problems, finding alternatives, etc. so we have taken initiation to study and analysis the traffic and provide solution i.e. study area is near Konanakunte junction which is located about 8.5km away from Banashankari, bengaluru. It is four legged intersection with arms leading towards Banashankari road side, kanakaupra road side, Electronic city side, kengeri road side and it has a lot of delay and queue length during office hours.
Keywords: Traffic, Junction, Density, Population, Intersection.
1. INTRODUCTION
Bangalore is the capital city of Karnataka and is the fifth largest city in the country and it is growing at a higher rate than other cities. Due to the growth in economic activities, it is attracting more migrants and it requires developed roads, grade separators, subways, mass transit system etc. In Bangalore on an average, 2 major and 2 minor junctions are there per kilometer of road length, due to which increase in travel time and frequent bottlenecks and break downs occur and also delay and congestion beyond tolerable limits.
A traffic study is a detailed examination and analysis of a transportation system supported by data collection. Transportation studies serve to quantify the extent of a transportation problem or to provide an analysis of a proposed transportation solution.
2. OBJECTIVE
To identify the various proposals to reduce travel time and queue length.
To conduct speed studies.
To conduct the classified volume studies and turning movements.
To provide best proposal at reduced land acquisition.
To arrive with a best proposal to reduce traffic congestion, delay and queue length.
To provide higher level of service.
3. BACKGROUND
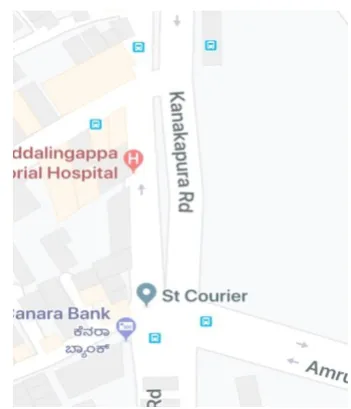
[image:1.595.344.520.326.531.2]3.1 STUDY AREA MAP:
Figure 1 Study area map ( Konanakunte cross)
3.2 PCU Equivalents as Per IRC
Vehicle Type PCU Equivalency
Factor Passenger Car 1.00
Motor Cycle or Scooter 0.50
Tractor, Light
Commercial Vehicles 1.50 Truck or Bus 3.00
Truck Trailer,
© 2019, IRJET | Impact Factor value: 7.211 | ISO 9001:2008 Certified Journal
| Page 5463
Cycle 0.50
Cycle Rickshaw 2.00
Horse Drawn Vehicle 4.00
Bullock Cart 8.00
4. PROBLEM STATEMENT
[image:2.595.222.532.51.595.2]4.1 STUDY AREA
Figure 2 Problem statement of the study area
Konanakunte is a main junction in which traffic flows here from four sides, two sides of hundred feet ring road and two sides of Kanakapura road. Every time the signal halts a stop, vehicles pile up within seconds for few 100m long.
The major problems at konanakunte junctions are as follows,
High traffic volume during peak time
Increased vehicle loads on road network
[image:2.595.43.284.181.671.2] No proper measure on pedestrian safety
[image:2.595.324.534.345.520.2]Figure 3 Traffic congestion at konankunte junction
Figure 4 No Zebra Crossing at konankunte Junction
5. METHODOLOGY
5.1 TRAFFIC DATA COLLECTION
Traffic data collection and projection thereof traffic volumes are basic requirements for planning of road development and management schemes. Traffic data forms an integral part in the science of descriptive national economics and such knowledge is essential in drawing up a rotational transport policy for movement of passenger and goods by both government and the private sector.
© 2019, IRJET | Impact Factor value: 7.211 | ISO 9001:2008 Certified Journal
| Page 5464
5.2 TRAFFIC DATA ANALYSIS
Traffic engineering studies are carried out to analyse the
traffic characteristic and their movements along the
identified roads. The results of these studies are used for the design of geometric features and traffic controls measures for safe and efficient traffic movements. The analyses of results of these studies are also useful for assessing the need of the proposed road project.
5.3 PASSENGER CAR UNITS (PCU)
Capacity is expressed in ‘Passenger Car Units (PCU) per hour. If the addition of one vehicle per hour in a traffic stream reduces the average speed of the vehicles by the same amount as the addition of ‘x’ cars per hr, then the vehicle of that type is considered to be equivalent to x PCUs.
6. DATA COLLECTION
6.1 TRAFFIC VOLUME COUNT
6.1.1 TOWARDS ELECTRONIC CITY
6.1.2 TOWARDS KENGRI
[image:3.595.311.559.120.258.2]6.1.3 TOWARDS BANASHANKRI
Figure 9 Pie Chart for Vehicular Count in Peak Hours towards Banashankari (Morning)
TWO WHEELER 31% CAR 27% LCV 3% AUTO 13% BUS 5% TRACTOR 1% CYCLE 0% 2%
13% 5% 0%
[image:3.595.310.559.311.455.2]TWO WHEELER 39% CAR 27% LCV 4% AUTO 23% BUS 6% TRACTOR 1% CYCLE 0% TWO WHEELER 29% PASSENGE R CAR 28% LCV 22% AUTO 16% BUS 4% TRACTOR 1% CYCLE 0% TWO WHEELER 41% CAR 33% LCV 3% AUTO 16% BUS 6% TRACTOR 1% CYCLE 0%
Figure 5 Pie Chart for Vehicular Count in Peak Hours towards Electronic city (Morning)
[image:3.595.33.279.400.524.2]Figure 6 Pie Chart for Vehicular Count in Peak Hours towards Electronic city (Evening)
Figure 7 Pie Chart for Vehicular Count in Peak Hours towards Kengri (Morning)
Figure 8 Pie Chart for Vehicular Count in Peak Hours towards Kengri (Evening)
[image:3.595.334.564.535.659.2]© 2019, IRJET | Impact Factor value: 7.211 | ISO 9001:2008 Certified Journal
| Page 5465
Figure 10 Pie Chart for Vehicular Count in Peak Hourstowards Banashankari (Evening)
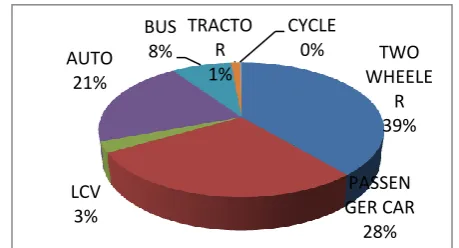
[image:4.595.304.563.56.511.2]6.1.4 TOWARDS KANAKAPURA ROAD
Figure 12 Pie Chart for Vehicular Count in Peak Hours towards Kanakapura (Evening)
7. DATA ANALYSIS
7.1 DATA ANALYSIS ON HOURLY BASIS
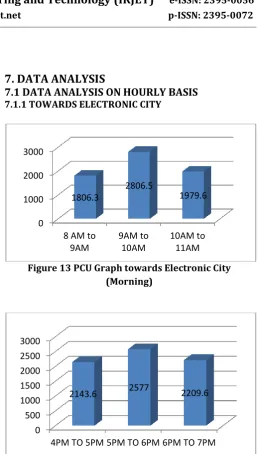
7.1.1 TOWARDS ELECTRONIC CITY
[image:4.595.44.283.354.505.2]Figure 13 PCU Graph towards Electronic City (Morning)
Figure 14 PCU Graph towards Electronic city (Evening)
7.1.2 TOWARDS KENGERI
TWOWHEELER 43%
CAR 21% LCV
3%
AUTO 23% BUS
9%
TRACTOR 1%
CYCLE 0%
TWO WHEELER
36%
CAR 32% LCV
3%
AUTO 21%
BUS 7%
TRACTOR 1%
CYCLE 0%
0 1000 2000 3000
8 AM to 9AM
9AM to 10AM
10AM to 11AM 1806.3
2806.5
1979.6
0 500 1000 1500 2000 2500 3000
4PM TO 5PM 5PM TO 6PM 6PM TO 7PM
2143.6 2577 2209.6
TWO WHEELER
34%
PASSENG ER CAR
35% LCV
4% AUTO
15%
BUS 11%
TRACTOR 1%
CYCLE 0%
0 1000 2000 3000 4000 5000
8AM to 9AM
9AM to 10AM
10AM to 11AM
3422.8 4814.3
[image:4.595.321.548.541.673.2]2506.1
Figure 11 Pie Chart for Vehicular Count in Peak Hours towards Kanakapura road (Morning)
[image:4.595.41.281.544.726.2]© 2019, IRJET | Impact Factor value: 7.211 | ISO 9001:2008 Certified Journal
| Page 5466
Figure 16 PCU Graph Towards Kengeri (Evening) [image:5.595.53.269.305.486.2]7.1.3 TOWARDS BANSHANKARI
Figure 17 PCU Graph Towards Banashankari (Morning)
Figure 18 PCU Graph towards Banashankari (Evening)
[image:5.595.310.537.329.488.2]7.1.4 TOWARDS KANAKAPURA
Figure 20 PCU Graph Towards Kanakapura (Evening)
8. DEVELOPMENT SUGGESTION
SL.
NO.
Type of carriageway
Total design services volume
Arterial
Sub-arterial
Collector
1 2-Lane
One-Way
2400 1900 1400
2 2-Lane
Two-Way
1500 1200 900
3 3-Lane
One-Way
3600 2900 2200
4 4-Lane
Undivided
3000 2400 1800
0 500 1000 1500 2000 2500
4PM TO 5PM
5PM TO 6PM
6PM TO 7PM
2065.2 2499.1 2174.5
0 500 1000 1500 2000 2500 3000 3500
8AM to 9AM
9AM to 10AM
10AM to 11AM 2518.6
3275.9
2145
0 500 1000 1500 2000 2500 3000
4PM TO 5PM
5PM TO 6PM
6PM TO 7PM 2120.7
2859.9
2203.7
0 1000 2000 3000 4000 5000
4PM TO 5PM
5PM TO 6PM
6PM TO 7PM 2138.7
4183.9
3005.7 0
1000 2000 3000 4000
8AM to 9AM
9AM to 10AM
10AM to 11AM
2677.6 3557.5 2410.5
[image:5.595.52.270.523.683.2]© 2019, IRJET | Impact Factor value: 7.211 | ISO 9001:2008 Certified Journal
| Page 5467
5 4-Lane
Divided
3600 2900 -
6 6-Lane
Undivided
4800 3800 -
7 6-Lane
Divided
5400 4300 -
8 8-Lane
Divided
7200 - -
- - - - -
According to IS-106-1990 code the recommended design service volume of 2-lane two-way should be 1200 for sub-arterial,4-lane divided is 2900 for sub-arterial and 6-lane divided is 5400 for arterial.
But when we see the data collected for the selected junction, we have 1 road of 2-lane two-way sub-arterial, another road 4-lane divided sub-arterial and 2 roads of 6-lane divided arterial.
The volume towards the electronic city road in the morning peak hours the data is obtained as 2806.5 and in the evening peak hour it is 2577.Which is almost to the recommended design service volume of 2900.
Even for other road of 2-lane two-way kengeri road, the volume is 4814.3 in the morning peak hour and 2499.1 in the evening peak hour which is again exceeding the service volume of 1200.
Then for other 2 roads of 6-lane divided the recommended design service volume should be 5400 for arterial.
For both the roads of kanakapura and banashankari as the collected data volume is not crossing above the recommended service volume, there is no problem from these two roads
9. CONCLUSION
Electronic city road has to be widened in future.
Kengeri road has to be widened as it is exceeding twice the volume of recommended traffic volume.
Road widening at the critical part of the junction.
Proper road marking has to be done.
By providing rotary, the accidents and collision can be reduced.
Proper sign boards and zebra crossing.
Proper footpaths has to be given for the drainage and easy accessibility of pedestrians.
Bus stop has to be provided 75 meters after the junction.
Turning lane for kengeri road as to be provided.
ACKNOWLEDGEMENT
We extend our sincerest gratitude to our guides Prof. Pavankumar P N, Prof. Vinaykumar S N and our well wishers who had constantly encouraged us and helped us in all situations whenever needed.
REFERENCES
[1] Guideline for capacity of urban roads by IRC:
106:1990.
[2] Bharath H Aithal, Vinay S and Ramachandra T V, 2103.
Modeling and simulation of urbanization in greater bangalore, India, Proc. Of national spatial data infrastructure 2013 conference, IIT Bombay, November 29-30,2013
[3] Manuj Darbari Sanjay Medhavi and Abhay Kumar
Srivastava.“Development of effective Urban Road Traffic Management using workflow techniques for upcoming metro cities(India)”,International Journal of Hybrid Information Technology, Vol.1, NO. 3, pp. 99-108, July, 2008.
[4] HIGHWAY CAPACITY MANUAL-2000
[5] Dr.L.R.Kadiyali.”TRAFFIC ENGINEERING AND
TRANSPORT PLANNING”, Hanna publishers.Edition-2010,2011
[6] Khanna and Justo.”Highway Engineering”,New Chand
and Bros,Civil lines,Roorkee. Edition-2010
[7] Indian Roads Congress, “Manual for survey,
investigation and preparation of roads”
[8] PCU equivalents in India Prof S L Dhingra at
civil.iitb.ernet.in sun
BIOGRAPHIES
PAVANKUMAR P N, Asst.Professor Dept of Civil engineering in City Engineering College, B’lore.
© 2019, IRJET | Impact Factor value: 7.211 | ISO 9001:2008 Certified Journal
| Page 5468
BASAVARAJ CHANDRASHEKARREDDY, Final year Student, BE Civil Engineering ,
City Engineering College, B’lore.
A BRAHMA PRAKASH SAH, Final year Student,