© 2019, IRJET | Impact Factor value: 7.211 | ISO 9001:2008 Certified Journal
| Page 5185
Analysis of Effects of Side Daylight and Building Orientation on
Annual Electricity Consumption of an Office Building Model Using
eQUEST Software
Animesh Pandey
1, Ashish Nim
21
M.Tech, Student,
Department of Civil Engineering, Institute of Engineering & Science, IPS Academy,
Indore, Madhya Pradesh, India
2
Assistant Professor
,
Department of Civil Engineering, Institute of Engineering & Science, IPS
Academy, Indore, Madhya Pradesh, India
---***---Abstract - The present work makes an attempt to design and create an imaginary office building model on eQUEST software, version 3.65, and simulate it on the basis of weather data of Indore for analyzing the effects of side daylight and building orientation on its annual electricity consumption. On the basis of analysis of simulation results, it is obtained that: 1) If side daylight is not utilized in the model, then the value of annual electricity consumption may or may not vary with change in building orientation. 2) If side daylight is utilized in the model, then the value of annual electricity consumption varies with change in building orientation. 3) For the model oriented in a particular direction, the value of annual electricity consumption of the model utilizing side daylight is lower than the value of annual electricity consumption of the model not utilizing side daylight. 4) The lowest annual electricity consumption by the office building model when side daylight is not utilized is when it is oriented towards “North” direction; and when side daylight is utilized, then the lowest annual energy consumption by the office building model is when it is oriented towards “South East” direction. Further, it is concluded that side daylight and building orientation do have effects on annual electricity consumption; and proper orientation of building and proper utilization of side daylight can make a building energy efficient.
Key Words: Daylight, Orientation, Electricity, Office, Building, eQUEST, Simulation, Indore.
1. INTRODUCTION
A building is anything that is built with walls and a roof. A “Green Building” or “Sustainable Building” is a building which depletes the natural resources to the minimum during its construction and operation. “Building Envelope” means the roof, exterior walls and floor of a structure, which separates the interior of the building from the outdoor environment. The term “Daylight” means the illumination of buildings by natural lights. Daylight can be classified as “Side Daylight” and “Top Daylight”. “Side Daylight” means daylight obtained from windows, that is, vertical glass, and “Top
Daylight” means daylight obtained from skylights. “Skylight” is a window placed in a roof or ceiling to admit daylight.
Natural lighting in building provides a pleasant and attractive indoor environment that can foster higher productivity and performance of the building. Several studies have indicated that daylighting is a cost - effective alternative to electrical lighting for commercial and institutional buildings. Through sensors and controllers, daylighting can reduce and even eliminate the use of electrical lighting which is required to provide sufficient
illuminance levels inside office spaces. The cost - effectiveness of daylighting controls depends on
building architectural features and building location [ 1 ].
“Building Orientation” means alignment or positioning of building relative to the points of a compass or other specified directions.
Fig. 1 shows four cardinal directions ( that are “North”, “East”, “South”, “West” ); four intercardinal directions ( that are “North East”, “South East”, “South West”, “North West” ); and eight secondary intercardinal directions ( that are “ North North West” , “West North West”, “West South West”, “South South West”, “South South East”, “East South East”, “East North East”, “North North East” ).
© 2019, IRJET | Impact Factor value: 7.211 | ISO 9001:2008 Certified Journal
| Page 5186
A “Simulation” is an approximate imitation of the operation of a process or system. For performing simulation, the first requirement is to develop a model. The model is a well defined description of the simulated subject, and represents its key characteristics, such as its behaviour, functions and abstract or physical properties. The model represents the system itself, whereas the simulation represents its operation over time.
“eQUEST” software is a quick energy simulation tool. It was originally developed by Department of Energy of United States Of America. This software is freely available on internet. eQUEST software essentially consists of three things: a) Building Creation Wizard; b) Energy Efficiency Wizard; and c) Graphical Reporting System. ( In computer technology, the term “Wizard” means a help feature of a software that automates complex tasks by asking the user a series of easy-to-answer questions. ) eQUEST software uses simulation engine called DOE - 2.2. The term “DOE” means department of energy ( United States Of America ).
Indore is a city in the state of Madhya Pradesh in India. The latitude and longitude of Indore is 22.7196° N, 75.8577° E.
2. OBJECTIVE
The objective of present work is to design and create a model of an imaginary double storey office building, assumed to be located in Indore, using eQUEST software, version 3.65, and to analyse the effects of side daylight and building orientation on its annual electricity consumption, through simulation.
3. LITERATURE REVIEW
Soni et al. ( 2016 ) used eQUEST software to analyse the electricity consumption of an institutional building, which is located in Indore, Madhya Pradesh, India. The analysis was carried out to suggest measures so as to reduce the electricity consumption of the building. It was concluded that electricity consumption can be reduced by efficiently designing: 1) Building envelope; 2) Glazing; 3) Shading; 4) Lighting. Further, the institutional building
was rated as “Two Star Building” using “GRIHA” ( “Green Rating for Integrated Habitat Assessment” ),
which is an Indian rating system for green buildings [ 3 ].
Kim et al. ( 2016 ) used Autodesk Revit software and Autodesk Green Building Studio software to analyse the mutual impact of “Size of window”, “Position of window and “Orientation of window” on the annual heating and cooling load of a two storey single family house, located in Vancouver, Canada. It is to be noted that, here: a) “Window Size” meant window - to - wall ratio, which is the measure of the percentage area determined by
dividing the building’s glazed area by its wall area. b) “Window Orientation” meant the facing directions of the windows, which were, north, east, south and west. c) “Window Position” meant the height of the window from the floor; window position was categorized into “High”, “Middle” and “Low” position. “High” position meant that the top of the window is aligned with the top of the wall; the “Middle” position meant that the midpoint of the window is positioned in the middle of the wall; and the “Low” position meant that the bottom of the window is placed at the bottom of the wall. The conclusions of the analysis were: 1) The annual heating and cooling load increased as the window size got bigger, regardless of the window position. 2) The change in position of the window had the biggest influence on annual heating and cooling load when window - to - wall ratio was 20 percent. 3) When the window - to - wall ratio was kept 20 percent, then, the lowest annual heating and cooling load was obtained when the windows in all directions were located in “Middle” position. 4) When the window - to - wall ratio was kept 20 percent and when the position of windows in north, west and south directions were kept same, then, the variation in position of east facing window had the biggest influence on variation in annual heating and cooling load [ 4 ].
Kale ( 2016 ) described the features of “Intelligent Building” which are summarized in the following way: 1) An intelligent building is adaptable to changes in use of the building space and technology. 2) It is well equipped with energy saving controls, which minimizes energy consumption and operation costs of HVAC systems, electrical lights; and utilizes solar energy. 3) It consists of different infrastructural and security services, such as, closed - circuit television, card access control system, smoke detection system and fire alarms, emergency power supply system, telecommunication systems like Wi - Fi. 4) It incorporates automation, which, in most general sense means that the building can sense and automatically adjust some aspect of the interior or exterior environment in response to a change in some other aspect of that environment. 5) An intelligent building is eco- friendly, productive and cost effective [ 5 ].
© 2019, IRJET | Impact Factor value: 7.211 | ISO 9001:2008 Certified Journal
| Page 5187
pumps with variable pumps, including pumps for chilled water, cooled water, and domestic hot water. After formulating retrofitting measures, the retrofitting measures were calibrated into the model of the hotel, built on eQUEST software, with some reasonable simplifications. Then, the model was once again simulated for energy consumption. After this, the retrofitting measures were actually implemented in the hotel and actual energy consumption was determined. In the end, the actual energy consumption of the hotel after retrofitting was compared with the energy consumption that was obtained from simulation of the model of retrofitted hotel. The conclusions of the analysis were: 1) The schedules of “Internal Loads” have the most significant impact on the accuracy of the model for hotel buildings, followed by occupancy rate, and the coefficient of performance of chillers. It is to be noted that the term “Internal Loads” here means occupancy density, lighting loads and equipment loads ; 2) Lighting system and equipment inventory must be surveyed for those hotel buildings whose internal loads are not available from mechanical, electrical and plumbing drawings; 3) The retrofitting measures that were proposed for the hotel were highly efficient, economically feasible; 4) In general, the proposed retrofitting measures are more beneficial for hotel buildings which are located in areas with extensive and abundant geothermal resources. 5) On comparing the actual energy consumption of the hotel after retrofitting with the energy consumption that was obtained from simulation of the model of retrofitted hotel, it was found that the simulated results of eQUEST software were highly accurate [ 6 ].
Song et al. ( 2015 ) used eQUEST software to analyse the electricity consumption of a library building of Tianjin Polytechnic University, which is, located in North China. The analysis was carried out to know the individual effect of variables, namely: 1) Lighting power density; 2) Indoor personnel density; 3) Summer indoor design temperature; 4) Summer air supply temperature; on electricity consumption of the building. The conclusion of the analysis were: 1) Increase in lighting power density resulted in increase in annual electricity consumption of the building. 2) In summer season, increase in indoor personnel density caused increase in air conditioning load of the building which resulted in increase in monthly electricity consumption of the building; whereas, in winter season, increase in indoor personnel density caused decrease in air conditioning load of the building which resulted decrease in monthly electricity consumption of the building. 3) Increase in summer indoor design temperature results in decrease in annual electricity consumption of the building. 4) Increase in summer air supply temperature results in decrease in annual electricity consumption of the building [ 7 ].
Zerroug and Dzelzitis ( 2015 ) compared the features of two popular software for building energy simulation, namely, “eQUEST” and “EnergyPlus”, and analysed the actual monthly electricity consumption and actual monthly gas consumption of an office building with the simulation results obtained from “ eQUEST’ and “EnergyPlus”. It was noted that the simulation results obtained from eQUEST were relatively more closer to the actual values of electricity consumption and gas consumption than the simulation results obtained from EnergyPlus. It was concluded that the eQUEST software is the easiest to use, quickest to produce simulation results and relatively more accurate than EnergyPlus [ 8 ].
Zuo and Zhao ( 2014 ) reviewed existing studies related to green building and concluded following things: a) A building is defined “Green Building” on the basis of green building assessment tools. Different countries have different green building assessment tools, which are similar but not same. These green building assessment tools are not same because different countries have different climatic conditions, economic conditions and geographic conditions. Hence, the definition of green building may or may not be same for different regions or countries. b) Most of the studies related to green building focuses more on environmental aspects of sustainability such as energy consumption, water efficiency and greenhouse gas emission together with technical solutions, rather than, socio - economic aspect of sustainability, though, both type of aspects are equally important. c) Different issues related to green building, that require future study and research, should be: 1) Effects of climatic conditions on the effectiveness of green building assessment tools; 2) Validation of real performance of green buildings; 3) Unique demands of specific population such as aged people, students and teachers that need to be addressed during planning and construction of green building [ 9 ].
© 2019, IRJET | Impact Factor value: 7.211 | ISO 9001:2008 Certified Journal
| Page 5188
impact of leaf area index on the reduction of indoor air temperature and energy demand was not proportional. ( It is to be noted that here leaf area index means one - sided green leaf area per unit roof surface area. ) d) The effect of a green roof on reducing the summer indoor air temperature, the cooling demand and the heating demand, strongly depends on the roof insulation level. e) The effectiveness of green roofs depends greatly on the climate. f) Green roofs improve building’s energy efficiency [ 10 ].
Hwang et al. ( 2012 ) used eQUEST software and PV - DesignPro software to analyse two buildings constructed by Samsung C & T Corporation, located in Korea. The analysis was carried out to know the maximum amount of electricity that can be generated by different photovoltaic systems integrated with the building envelope, and the effects of orientation, installation angles of photovoltaic system and density of photovoltaic cells on electricity generated by photovoltaic system. It was stated that the optimal solution for integrating photovoltaic systems with building is a function of: a) Façade surface area ( Façade means the principal front of a building, that faces on to a street or open space. ) b) Inclination, and ratio of distance between photovoltaic panels to the length of photovoltaic panel. c) Types of photovoltaic cells and their efficiency. d) Cost of photovoltaic cells. e) Restrictions related to building functionality and aerostatic of a building. For both buildings, it was concluded that when proper combinations of factors, such as, 1) Inclination of photovoltaic system, 2) Type of photovoltaic system, 3) Ratio of distance between photovoltaic panels to the length of photovoltaic panel, 4) Direction, was done, then, the maximum electricity generated by photovoltaic system was approximately about 4.7 % of the annual electricity consumption of the building [ 11 ].
Al - Tamimi et al. ( 2011 ) used BABUC/M, a comprehensive data logger, to study the influences of orientation, natural ventilation and varied window to wall ratio ( that is net glazing area to gross exterior wall area ) on the indoor environmental performance of two residential rooms of a four - storey building called Fajar Harapan, located in the campus of University Science Malaysia, Penang. One room was east facing and the other room was west facing, and both rooms were located at the topmost floor of the building. The conclusions were: 1) East facing room was always hotter than west facing room. 2) The average difference of in / out door air temperature of east room was higher than west room, even when natural ventilation was applied and window to wall ratio was kept same or changed. 3) As compared to the west room, the room temperature of east room was below 28 OC for shorter period of time. But when the window to wall ratio was 25 %, the room temperature of east room and west
room were below 28 OC for same period of time. 4) Rooms needed mechanical ventilation to improve the thermal comfort of occupiers. 5) In general, thermal comfort can be improved by applying natural ventilation and keeping window to wall ratio equal to 25 % [ 12 ].
Sadineni et al. ( 2011 ) stated that the building energy efficiency can be improved by implementing active and passive energy efficient strategies. Active energy efficient strategies meant improvements made in heating, ventilation and air conditioning systems, electrical lighting etc., while passive energy efficient strategies meant improvements made in building envelope components. Besides this, a review of advancements in construction of building envelope components that can make a building energy efficient were described. These advancements were: 1) Passive solar walls ( Examples: Trombe wall, Composite Trombe - Michell Wall, Transwall ); 2) Lightweight concrete walls ( Example: Autoclaved aerated concrete ); 3) Ventilated or double skin walls or
cavity walls; 4) Walls with latent heat storage; 5) Aerogel glazing; 6) Vacuum glazing; 7) Switchable
reflective glazing; 8) Lamination of suspended particle devices film between two glass panes; 9) Sandwiching of holographic optical elements ( or film ) between two glass panes; 10) Lightweight aluminium standing seam roofing systems ( LASRS ); 11) Ventilated roof systems; 12) Vaulted and domed roofs; 13) Solar - reflective / cool roofs; 14) Green roofs; 15) Photovoltaic roofs; 16) Thermal roof insulation systems; 17) Evaporative
roof cooling; 18) Vacuum insulation panels; 19) Structurally insulated panels. In addition to this, it
© 2019, IRJET | Impact Factor value: 7.211 | ISO 9001:2008 Certified Journal
| Page 5189
while, some were still in research and development phase for future applicability [ 13 ].
Patle et al. ( 2011 ) proposed a design of a green building, located in campus of Visvesvaraya National Institute of Technology, Nagpur, India. The design was based on the guidelines of SP: 41 - 1987, that is, “Handbook on Functional Requirements Of Buildings ( Other Than Industrial Buildings )”. The description of the design were: a) The dimensions of the building were 13.50 metres x 7.50 metres x 3 metres; b) The long walls of the building were in North - South direction, whereas short walls were in East - West direction; c) The thickness of all walls were 230 mm; d) West façade walls and South facade walls were insulated with expanded polystyrene; e) The area of openings in building were 15 percent of the wall area; f) Windows were placed on longer walls of building; g) Pitched roof was proposed to the building. Besides this, for selecting appropriate construction materials and electrical appliances for the proposed green building, comparisons of different construction materials and electrical appliances were carried out on the basis of following
three criteria: 1) Cost; 2) Energy Consumption; 3) Carbon dioxide emission. In addition to this, an
estimate of rainwater, that can be harvested by the building, and utilized for landscaping and flushing, was described. Further, TRNSYS software was used to carry out simulation and analyse the thermal performance of the building. The conclusions were: a) Planning, design and construction materials had great impact on energy efficiency of building. b) Appropriate construction materials and electrical appliances for proposed green building were: Fly ash brick, Pozzolana Portland cement, Recycled steel, CFL lights and evaporating coolers, as they were cost effective, energy efficient and emitted lesser amount of carbon dioxide. c) Rainwater harvesting system was recommended. d) The simulation results of TRNSYS software indicated thermal comfort in the proposed green building [ 14 ].
Ling et al. ( 2007 ) selected two common geometric shapes of high rise buildings of Kuala Lumpur, Malaysia, that were, square shape and circular shape, and used computer simulation program ECOTECT V5.2, to analyse the effects of geometric shape and building orientation on solar insolation received by high rise building. Here, the term “Solar Insolation” was defined as the total amount of cumulative incident solar radiation on a point or surface over a specified period. All simulations were based on the available hourly direct and diffuse horizontal solar irradiance data from ECOTECT Weather Tool for Kuala Lumpur, Malaysia ( 3.7 ON, 101.7 OE ). The simulation procedure was divided in two parts. In the first part, two basic geometric shapes ( that is, square shape and circular shape ) with variations in “Width / Length Ratio” and variations in building
orientation, were simulated so as to determine that particular square shape type, and that particular circular shape type, which had the least annual total solar insolation. It is to be noted that the values of “Base Floor Area”, “Height Of Building”, “Volume Of Building”, “Floor To Floor Height”, “Average Tenants Efficiency” of all shape types were kept same. In the second part, the square shape type with least annual total solar insolation, and the circular shape type with least annual total solar insolation, were selected, in order to investigate the relationship of insolation level on different orientated wall. It was found that: a) Out of all different square shape types, the square shape type with “Width / Length Ratio” equal to one, had the lowest annual total solar insolation. b) Out of all different circular shape types, the circular shape type with “Width / Length Ratio” equal to one, had the least annual total solar insolation. c) Out of all different circular shape types and square shape types, the circular shape type with “Width / Length Ratio” equal to one, had the least annual total solar insolation. d) The circular shape type with “Width / Length Ratio” equal to one, received the highest amount of solar insolation on the east - orientated wall, followed by the south - orientated wall, west - orientated wall and north - orientated wall respectively. The results indicated that: a) Building orientation contributes greater impact to geometric shape with lower “Width / Length Ratio” than higher “Width / Length Ratio”, especially for east - west elongated building shape. b) Different geometric shapes have different capacity to receive solar energy under the same conditions. c) High rise buildings receive most of the annual total solar insolation through its vertical wall surfaces [ 15 ].
© 2019, IRJET | Impact Factor value: 7.211 | ISO 9001:2008 Certified Journal
| Page 5190
a) Number of panes: Double; b) Thickness of exterior glass pane: 3.9 mm and thickness of interior glass pane: 3.8 mm; c) Low - emissivity coating position: Surface 3 ( The coating position is indicated by numbering the pane surfaces from exterior facing to interior facing. ); d) Low - emissivity coating with solar gain of 0.066; e) The gap between glass panes is 12.7 mm and is filled with air. It was recommended that the first type of window should be used in southern, eastern and western directions, whereas second type of window should be used in northern direction. Further, the recommendations obtained from the analysis were actually tested on a single family dwelling located in Bilbao, and it was found that the actual case confirmed the trends observed with the building envelope model. It was indicated that the extent of savings depends on the specific characteristics of the building, particularly, the relative area of glazing surface, and the inertia and insulation of the enclosure [ 16 ].
Cole and Kernan ( 1996 ) examined the total life - cycle energy use of a three storey, generic office building of area 4620 square metres, for alternative wood, steel and concrete structural systems, with and without underground parking. For carrying out the analysis, the building’s life - cycle energy use was classified in four categories, these categories were: a) Initial embodied energy, that is, the energy initially required to produce the building. b) Recurring embodied energy, that is, the energy required to maintain and refurbish the building over its effective life. c) Operating energy, that is, the energy required to condition ( heat, cool and ventilate ), and light the interior spaces and to power equipment and other services. d) Demolition energy, that is, energy required to demolish and dispose of the building at the end of its effective life. It was observed, that, on comparing the initial embodied energy of wood, steel and concrete systems, the lowest initial embodied energy was of wood system, and highest initial embodied energy was of steel system. Further, it was observed that the difference between operating energy for wood, steel and concrete systems was negligible. It is to be noted that the operating energy was determined by using energy simulation program. It was concluded that the largest component of total life cycle energy was operating energy, and it was suggested that for reducing life cycle energy of building, progress should made in introducing those design considerations which significantly reduce building’s operating energy [ 17 ].
4. METHODOLOGY
The methodology of the work is divided into three parts. These parts are Part - A, Part - B and Part - C.
Part - A is the description of the things which are considered as independent variables and dependent variable in this work. It also includes the design of “Side
Daylight Control”. It is to be noted that the various things described and assumed in the design of “Side Daylight Control” are “Intelligent Dynamic Defaults” that are offered by eQUEST software for office building. These “Defaults” are largely based on California’s Title - 24 energy code.
Part - B is the description of the design of the imaginary office building model. In this work, the design of the imaginary office building model is considered as control variable. It is to be noted that the various things described and assumed in the design of imaginary office building model are “Intelligent Dynamic Defaults” that are offered by eQUEST software for office building. These “Defaults” are largely based on California’s Title - 24 energy code.
Part - C is the explanation of step by step procedure for work to be done to achieve the objective.
4.1. Part - A
A “Variable” is any factor, trait or condition that can exist in differing amounts or types. “Independent Variable” is a variable which is changed by scientist in an experiment. In this work, independent variables are “Building Orientation” and “Side Daylight”.
Various directions in which the imaginary double storey office building model will be oriented are: “North”, “North North West”, “North West” , “West North West” , “West”, “West South West”, “South West”, “South South West”, “South”, “South South East”, “South East”, “East South East”, “East”, “East North East”, “North East”, “North North East”.
The description of design of “Side Daylight Control” that will be used in the imaginary office building model is as follows:
1) Daylight Area Method: Simplified ( Wizard Only )
It means that the “Schematic Design Wizard” of eQUEST software will calculate the inside area of the building which is covered by side daylight, when description of following five things will be given: a) The number of photosensors in ground floor as well as in top floor; b) Percentage of lights controlled by each photosensor in ground floor as well as in top floor; c) Design light level; d) Height of photosensor from floor; e) Percentage of zone depth.
It is assumed that that one photosensor is provided in ground floor as well as top floor of the building.
© 2019, IRJET | Impact Factor value: 7.211 | ISO 9001:2008 Certified Journal
| Page 5191
It is assumed that design light level in ground floor as well as in top floor 538.196 lux, as it is most commonly used light level.
It is assumed that daylight illuminanace levels will be calculated at a height of 0.762 metres above floor. This does not represent the mounting height of a daylight photosensor.
It is assumed that on ground floor as well as top floor the percentage of zone depth is 9 %. It is to be noted that daylighting reference points are locations within daylight zones at which daylight levels are determined. “Percent Of Zone Depth” is used to help locate up to two daylighting reference points in each daylight space.
It is to be noted that eQUEST software centers the photosensor along the length of first “window “ in zone, avoiding skylights. This “window” is located on that “Wall” which faces towards the direction in which the whole building is oriented. Zone depth is measured from zone’s “window wall” to the wall opposite to it.
It is assumed that lighting control method utilized by photosensor, located on ground floor as well as top floor, is “ON/OFF”. In “ON/OFF” lighting control system, the photosensor “OFF” the artificial lights of zone, if design light level is achieved by daylight; and “ON” the artificial lights of zone, if design light level is not achieved by daylight.
Dependent variable is a variable whose value depends on independent variable.
The present work considers annual electricity consumption of the imaginary office building model as dependent variable. Its value is obtained by designing the office building model using schematic design wizard of eQUEST software and then carrying out simulation.
4.2. Part - B
Control variables are those factors, conditions, or traits that are intentionally kept same or constant throughout a scientific investigation, so as to analyse the relationship between independent variable and dependent variable.
In this present work, the design of imaginary office building model is considered as control variable, and its description is as follows:
It is assumed that the office building has two floors, namely, ground floor and top floor; and no floor or basement is provided below ground level.
It is assumed that the office building is located in Indore. The weather file of Indore was obtained by
downloading the weather data of Indore from the website of “EnergyPlus” software; then downloading “eQUEST Weather Processor” from the website of “DOE2”; and then using the “eQUEST Weather Processor” to convert the format of “EnergyPlus’s Weather File Of Indore” into a format which is supported by the eQUEST software.
It is assumed that area of ground floor and top floor are same; and their sum is 2322.576 square metres.
It is assumed that the shape of building footprint is rectangle. “Building Footprint” is the area on a project site that is used by the building structure. Parking lots, landscapes, and other non-building facilities are not included in the building footprint.
It is assumed that the length and breadth of building footprint are same, and kept equal to 34.076 metres.
It is assumed that the office building has two zones. Ground floor is considered as one zone, and top floor is considered as other zone. It is to be noted that the term a “Zone” is particularly that area of the building which is continuously subjected to variation in thermal load.
It is assumed that “Floor To Floor Height” is 3.65 metres; and “Floor To Ceiling Height” is 2.74 metres.
It is assumed that office building is not provided with pitched roof ( A roof with a sloping surface or surfaces is called pitched roof ).
It is assumed that roof surface is a finished reinforced cement concrete slab of thickness 0.152 metres, whose absorptance is equal to 0.6 ( Absorptance is the ratio of the radiant energy absorbed by a body to that incident upon it ).
It is assumed that the exterior walls above finished ground level made up of hollow medium weight concrete masonry units of thickness 0.203 metres, with no exterior finish, such that its absorptance is 0.6.
The term “Infiltration” or “Shell Tightness” means the tightness of the building envelope to prevent air infiltration. It is assumed that the infiltration through perimeter of building is 0.00019304 cubic metres per second per square metres area of exterior wall. It is assumed that the infiltration in “Core” of the building is 5.08 x 10⁻⁶ cubic metres per second per square metres area of floor. Here, the the term “Core” means the central part or interior part of the building.
It is assumed that the ceilings are finished with “Lay-In Acoustic Tile”.
© 2019, IRJET | Impact Factor value: 7.211 | ISO 9001:2008 Certified Journal
| Page 5192
It is assumed that the floors of the building are made up of reinforced cement concrete slab of thickness 0.152 metres. It is assumed that the floor slab edges are finished with concrete. It is assumed that the floor slab penetrates the wall plane. It is assumed that the floor slabs are finished with ceramic / stone tile.
It is assumed that floors, exterior walls, ceilings and roof surface are not provided with any kind of insulation.
It is assumed that the imaginary office building model is provided with two exterior doors. Both doors are made of glass. One exterior door is provided at the center of the wall which faces towards the direction in which the building is oriented. The other exterior door is provided at the center of the wall which faces towards the direction opposite to the direction in which the building is oriented. The dimensions of both exterior doors are kept same. The height of exterior door kept is 2.13 metres, and width kept is 1.82 metres. For exterior doors, the glass category and glass type used is “Single Clear 1/4 inch ( 1001 )”. The properties of this glass are as obtained from eQUEST glass library are as follows: a) The glass used for the door is single clear; b) The thickness of glass used is 0.00635 metres; c) Only single pane of glass is used in the door; d) The center glass U - Value is 1.09; e) The solar heat gain coefficient of glass is 0.81; f) The shading coefficient of glass is 0.95; g) The visible transmittance of glass is 0.88; h) The solar transmittance of glass is 0.77; i) The visible reflectance of glass is 0.08; j) The solar reflectance of glass is 0.07. The frame used for exterior door is aluminium frame without break. The width of frame kept is 0.0762 metres. The NFRC U-Value of “Glass + Frame” , as obtained from eQUEST glass library, is 1.18. It is to be noted that “NFRC” is abbreviation for National Fenestration Rating Council.
It is assumed that the eQUEST software will calculate the area occupied by the windows by “Percent of Net Wall Area ( Floor to Ceiling )” method. In this method, the area occupied by windows and its frame on exterior wall is defined as a certain percentage of area of exterior wall. It is to be noted that the area of exterior wall means product of length of exterior wall and height of exterior wall. It is further to be noted that the height of exterior wall is measured from floor to ceiling.
It is assumed that the area occupied by windows and its frame on every exterior wall is 10 percent of area of exterior wall.
It is assumed that the dimensions of all the windows of the building are same. The height of each window as well as its width is kept 1.219 metres.
It is assumed that the sill height is 0.914 metres.
It is assumed that the frame for windows is fixed aluminium frame without break, and its width is kept 0.330 metres.
It is also assumed that the type of glass used in windows is “Double Clear 1/4 inch, 1/2 inch Air ( 2004 )”. The properties of this glass are as follows: a) The glass used in windows is double clear glass; b) The number of glass panes used in each window is two; c) The thickness of glass used is 0.00635 metres; d) The gap between two panes is filled with air, and the gap thickness is 0.0127 metres; e) The center glass U-Value is 0.70; f) The solar heat gain coefficient of glass is 0.81; g) The shading coefficient of glass is 0.95;
h) The visible transmittance of glass is 0.78; i) The solar transmittance of glass is 0.60; j) The visible
reflectance of glass is 0.14; k) The solar reflectance of glass is 0.11; l) The NFRC U-Value of “Glass + Frame” is 0.64.
It is assumed that window overhang, window fins and roof skylights are not provided in the office building.
In eQUEST software, schedules are used to modulate building loads such as occupancy, lighting, internal equipment. “Simplified Schedules” are simple on/off “step-type” schedules that allow users to specify a) Building loads when the building is occupied, and b) Building loads when the building is unoccupied.
Table 1 gives the description of assumption of: a) Various types of area in the office building; b) Design
maximum occupant density in each activity area; c) Design ventilation in each activity area.
Table 1: Activity Area Allocation
In Table 1, it is to be noted that:
© 2019, IRJET | Impact Factor value: 7.211 | ISO 9001:2008 Certified Journal
| Page 5193
b) Design maximum occupant density means the maximum number of people occupying a space during the simulation. Its unit is square metres per person.
c) Design ventilation means the minimum allowable flow rate of outside ventilation air per person. Its unit is cubic metres per second per person.
Table 2 gives the description of the assumption of: a) Ambient lighting power density for each activity area when the office is occupied; b) Plug load power density for each activity area when the office building is occupied.
Table 2: Occupied Loads In Activity Areas
In Table 2, it is to be noted that the assumed values of “Ambient Lighting Power Density” and “Plug Load Power Density” are defined for the hours when the office is occupied.
Ambient lighting power density indicates the average peak connected power density of the ambient lighting for all zones throughout the existing or proposed building. It includes ballasts where applicable and represent the peak installed ambient lighting load, even if scheduled usage never assumes 100 % of the lights “ON” at one time. It is to be noted that ambient lighting power density does not include task lighting. In eQUEST software, the ambient lighting can be controlled by providing daylight controllers in zones which have window or skylights.
Plug load power density indicates the average peak connected power density of the electrical equipment for all zones throughout the existing or proposed building. It represents the peak installed plug load, even if scheduled usage never assumes 100% of the equipment “ON” at one time.
It is to be noted that the “ Task Lighting Power Density” for each activity area is intentionally assumed to be zero because in eQUEST software task lighting cannot be controlled by daylight controllers.
Table 3 gives the description of assumption of: a) Ambient lighting power loads in each activity areas in
the building during unoccupied hours; b) Plug load power density for each activity area when the office building is unoccupied.
In Table 3, the ambient lighting power loads for each activity area are expressed as a certain percentage of the ambient lighting power density of that corresponding activity area when it is occupied. Similarly, in Table 3, the plug loads for each activity area are expressed as a certain percentage of the plug load power density of that corresponding activity area when it is occupied.
It is to be noted that the ambient lighting power density for each activity area when it is occupied, and the plug load power density for each activity area when it is occupied, are described in Table 2.
Table 3: Unoccupied Loads In Activity Areas
For Table 3, it is assumed that during unoccupied hours, the office building is completely vacant or unoccupied.
It is assumed that the office building model will be analysed for the year 2019, therefore, the starting date of analysis is January 01, 2019, and closing date of analysis is to December 31, 2019.
It is assumed that the working days for the office are Monday, Tuesday, Wednesday, Thursday, Friday and Saturday.
It is assumed that the pattern of usage of building on working days is same.
It is assumed that on working days, the office opens at 9 A.M. and closes at 5 P.M.
It is assumed that the occupancy level during occupied hours is 90 % of design maximum occupant density as described in Table 1.
It is assumed that the ambient lighting power level during occupied hours is 90 % of ambient lighting power density as described in Table 2.
© 2019, IRJET | Impact Factor value: 7.211 | ISO 9001:2008 Certified Journal
| Page 5194
It is assumed that the office remains closed and unoccupied only on Sunday. It is assumed that on special days like Christmas, New Year Day, Independence Day, Republic Day, Diwali Festival etc. the office remains open and functions like normal working days, if that special day or festival day does not lie on Sunday.
Besides this, it is chosen that the “Schematic Design Wizard” of eQUEST software take into account the “Cooling Design Day”, during simulation, so that, the so that wizard can size the “HVAC” equipment. “Cooling Design Day” means the “Worst Case” day for air conditioning loads for the building. The “worst case” hour of this day determines equipment capacity, fan sizes, and subsequently duct sizes.
“HVAC System” means heating, ventilation, air - conditioning system.
It is assumed that the HVAC system used for the imaginary office building model is “Packaged Single Zone DX ( no heating )” with return air path ducted.
“Packaged DX System” is an air conditioning system which uses direct expansion coils ( DX Coils ) for cooling; and where the components of the air conditioning system, that are, evaporator, compressor and condenser, are packaged in a single unit and located outside the building. The air conditioning unit pumps cooled air into the building through ducts.
This simply means that on ground floor as well as on first floor “Packaged DX air conditioning system” is provided, such that, the return air travels back to the HVAC system via return ducts.
( Here, the term “Duct” means a long, hollow cylinder of metal, plastic, glass etc. which is used to deliver and remove air. )
It is assumed that one thermostat is located within ground floor and one thermostat is located within first floor.
It is assumed that when the building is occupied, then the thermostat’s cooling setpoint and heating setpoint are 297.594 Kelvin and 294.261 Kelvin respectively.
It is assumed that when the building is unoccupied then the thermostat’s cooling setpoint and heating setpoint are 300.928 Kelvin and 290.928 Kelvin respectively.
( It is to be noted that “Thermostat” is a piece of equipment that controls the temperature in a building. A “Setpoint” is a particular temperature value at which a thermostat has been set. Thermostat can have two types of setpoints - “Heating Setpoint” and “Cooling Setpoint”. For a heating setpoint, the HVAC system will heat the room to the setpoint temperature and try to maintain
that temperature. For a cooling setpoint, the HVAC system will cool the room to the setpoint temperature and try to maintain that temperature. If the room temperature is within the two setpoints, the HVAC system will not heat or cool the space, although it may continue to provide ventilation to the room. Setpoints work relative to the room temperature. The HVAC system works to bring the room temperature to the setpoint temperature. )
It is assumed that the indoor cooling temperature is 297.039 Kelvin and the temperature of conditioned air entering ground floor and first floor from HVAC units is 285.928 Kelvin.
It is assumed that the minimum air flow rate from HVAC unit is 0.00254 cubic metres per second per square metres.
It is assumed that the size of HVAC unit is such that the power consumed by the unit for cooling is between 39.564 kilowatt to 70.337 kilowatt.
It is assumed that the HVAC unit has air - cooled condenser.
It is assumed that the energy efficiency ratio of HVAC unit is 8.5 . ( “Energy Efficiency Ratio of HVAC unit” is the ratio of net cooling capacity in kilowatt to total rate of electric input in watt under design operating conditions. )
It is assumed that crankcase heating is enabled in HVAC unit. ( In crankcase heating, electric power ranging between 50 watt to 100 watt is used to heat the crankcase of air conditioner and heat pump compressors. The crankcase heater is assumed to be “ON” only when the compressor is “OFF”. It is assumed that it can operate only below 283. 15 Kelvin. )
It is assumed that the HVAC unit’s supply fans consume power that can provide air flow pressure of 311.35 Pascal.
It is assumed that the efficiency of motor of HVAC unit’s supply fans is high.
It is assumed that the fans of HVAC units operate from 9 A.M to 5 P.M. on all working days, including cooling design day, throughout the year.
It is assumed that the HVAC units have dry bulb type economizer that can pull cool air of temperature not higher than 291.483 Kelvin from outdoors and circulate in the building.
© 2019, IRJET | Impact Factor value: 7.211 | ISO 9001:2008 Certified Journal
| Page 5195
free cooling technique as the building does not rely on the HVAC equipment to provide cool temperatures. A “Dry Bulb Type Economizer” is an economizer which senses the temperature of the outside air only and does not consider humidity. It is to be noted that humidity means amount of water vapour in air. )
It is assumed that the compressor of HVAC unit cannot run with the economizer.
4.3. Part - C
The work to be done on eQUEST software to achieve the objective can be explained through following steps:
Step - 1: In this step, the model of an imaginary office building will be designed and created using “Schematic Design Wizard” of eQUEST software. The model will be designed in such a way that the model will be oriented towards “NORTH” direction, and it will not utilize side daylight. After creating the model, simulation will be performed so as to know the annual electricity consumption of the building model.
Step - 2: In this step, a new model of same imaginary office building will be designed and created using “Schematic Design Wizard” of eQUEST software. The model will be designed in such a way that the model will be oriented towards “NORTH” direction, and it will utilize side daylight. After creating the model, simulation will be performed so as to know the annual electricity consumption of the building.
Step - 3: In this step, the difference in the values of annual electricity consumption obtained from Step - 1 and Step - 2 will be calculated; and expressed as a percentage.
Step - 4: In this step, the above mentioned steps, that is, “Step - 1”, “Step - 2” and “Step - 3”, will be repeated in similar manner but for following different directions: “North North West”, “North West” , “West North West” , “West”, “West South West”, “South West”, “South South West”, “South”, “South South East”, “South East”, “East South East”, “East”, “East North East”, “North East”, “North North East”.
Step - 5: In this final step, all the simulation results obtained for different directions, with and without side daylight utilization, will be summarized in tabular form as well as in graphical form.
5. RESULT AND ITS ANALYSIS
5.1. Results
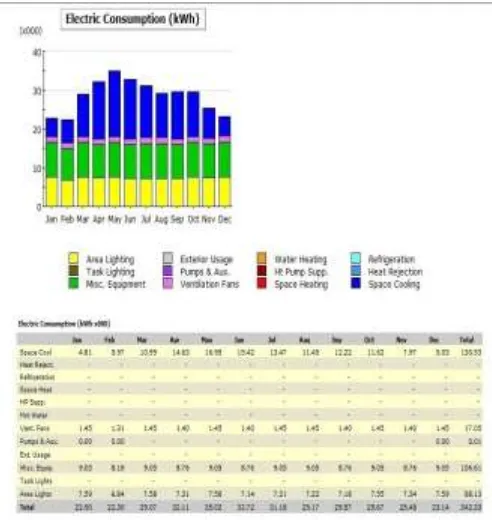
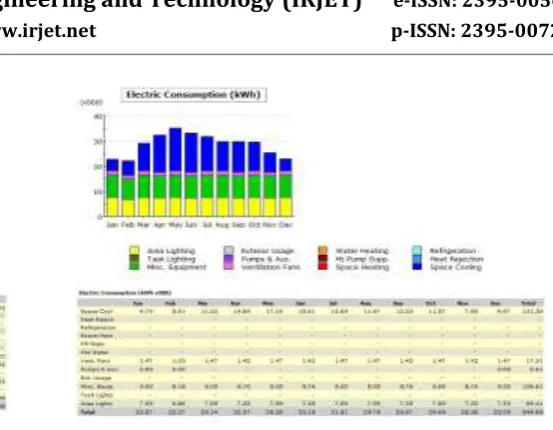
This section shows the results obtained from the implementation of methodology. It includes screenshots of simulation results for annual electricity consumption
[image:11.595.313.558.157.415.2]of imaginary double storey office building model oriented in different directions, with and without side daylight utilization. Further, it also includes a table and a bar chart that summarizes the simulation results.
Fig. 2: Annual electricity consumption when building orientation is “North” and side daylight is not utilized.
[image:11.595.309.555.460.720.2]© 2019, IRJET | Impact Factor value: 7.211 | ISO 9001:2008 Certified Journal
| Page 5196
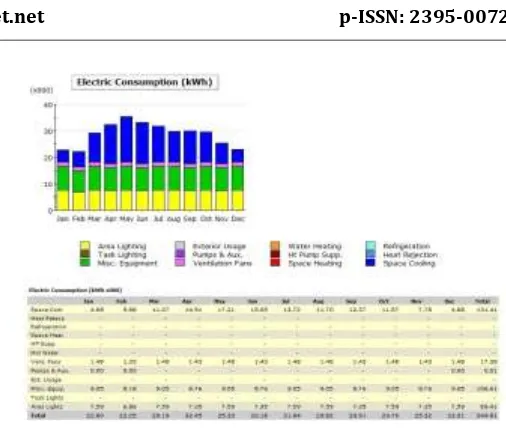
Fig. 4: Annual electricity consumption when building orientation is “North North West” and side daylight is
not utilized.
Fig. 5: Annual electricity consumption when building orientation is “North North West” and side daylight is
[image:12.595.302.559.54.271.2]utilized.
Fig. 6: Annual electricity consumption when building orientation is “North West” and side daylight is not
[image:12.595.316.548.319.494.2]utilized.
Fig. 7: Annual electricity consumption when building orientation is “North West” and side daylight is
utilized.
Fig. 8: Annual electricity consumption when building orientation is “West North West” and side daylight is
[image:12.595.49.283.423.714.2] [image:12.595.312.555.541.725.2]© 2019, IRJET | Impact Factor value: 7.211 | ISO 9001:2008 Certified Journal
| Page 5197
Fig. 9: Annual electricity consumption when building orientation is “West North West” and side daylight is
[image:13.595.47.276.326.495.2]utilized.
Fig. 10: Annual electricity consumption when building orientation is “West” and side daylight is not utilized.
Fig. 11: Annual electricity consumption when building orientation is “West” and side daylight is utilized.
Fig. 12: Annual electricity consumption when building orientation is “West South West” and side daylight is
[image:13.595.321.552.327.489.2]not utilized.
Fig. 13: Annual electricity consumption when building orientation is “West South West” and side daylight is
utilized.
[image:13.595.42.282.543.726.2] [image:13.595.314.552.543.732.2]© 2019, IRJET | Impact Factor value: 7.211 | ISO 9001:2008 Certified Journal
| Page 5198
[image:14.595.284.553.56.271.2]Fig. 15: Annual electricity consumption when building orientation is South West and side daylight is utilized.
Fig. 16: Annual electricity consumption when building orientation is “South South West” and side daylight is
not utilized.
Fig. 17: Annual electricity consumption when building orientation is “South South West” and side daylight is
[image:14.595.44.281.305.467.2]utilized.
Fig. 18: Annual electricity consumption when building orientation is “South” and side daylight is not utilized.
Fig. 19: Annual electricity consumption when building orientation is “South” and side daylight is utilized.
Fig. 20: Annual electricity consumption when building orientation is “South South East” and side daylight is
[image:14.595.315.552.311.493.2] [image:14.595.44.282.521.709.2] [image:14.595.316.548.540.723.2]© 2019, IRJET | Impact Factor value: 7.211 | ISO 9001:2008 Certified Journal
| Page 5199
Fig. 21: Annual electricity consumption when building orientation is “South South East” and side daylight is
[image:15.595.314.551.319.508.2]utilized.
Fig. 22: Annual electricity consumption when building orientation is “South East” and side daylight is not
[image:15.595.45.277.320.474.2]utilized.
Fig. 23: Annual electricity consumption when building orientation is “South East” and side daylight is utilized.
Fig. 24: Annual electricity consumption when building orientation is “East South East” and side daylight is
[image:15.595.41.278.527.714.2]not utilized.
Fig. 25: Annual electricity consumption when building orientation is “East South East” and side daylight is
utilized.
[image:15.595.313.551.563.737.2]© 2019, IRJET | Impact Factor value: 7.211 | ISO 9001:2008 Certified Journal
| Page 5200
[image:16.595.41.283.311.478.2]Fig. 27: Annual electricity consumption when building orientation is East and side daylight is utilized.
Fig. 28: Annual electricity consumption when building orientation is “East North East” and side daylight is
[image:16.595.311.554.326.503.2]not utilized.
Fig. 29: Annual electricity consumption when building orientation is “East North East” and side daylight
utilized.
Fig. 30: Annual electricity consumption when building orientation is “North East” and side daylight is not
utilized.
Fig. 31: Annual electricity consumption when building orientation is “North East” and side daylight is
utilized.
Fig. 32: Annual Electricity Consumption when building orientation is “North North East” and side daylight is
[image:16.595.41.281.537.722.2] [image:16.595.316.554.552.727.2]© 2019, IRJET | Impact Factor value: 7.211 | ISO 9001:2008 Certified Journal
| Page 5201
Fig. 33: Annual electricity consumption when building orientation is “North North East” and side daylight is
utilized.
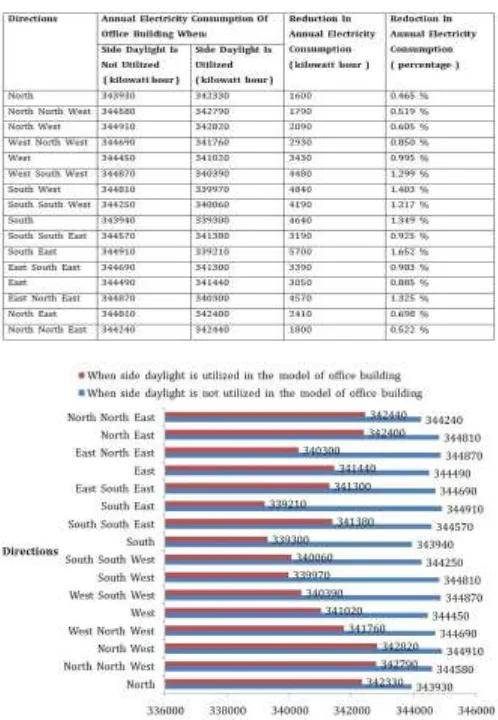
Table 4: Summary Of Simulation Results
Chart 1: Bar Chart Showing Summary Of Simulation Results
5.2. Analysis of results
The analysis of simulation results is as follows:
1) When side daylight is not utilized in the model of office building then following things are observed:
a) The highest value of annual electricity consumption is 344910 kilowatt hour. This value is obtained when the building is oriented either towards North West direction or towards South East direction.
b) The value of annual electricity consumption is same when the building is oriented either towards West South West direction or towards East North East direction, which is 344870 kilowatt hour.
c) The value of annual electricity consumption is same when the building is oriented either towards South West direction or towards North East direction, which is 344810 kilowatt hour.
d) The value of annual electricity consumption is same when the building is oriented either towards West North West direction or towards East South East direction, which is 344690 kilowatt hour.
e) The lowest value of annual electricity consumption is 343930 kilowatt hour. This value is obtained when the building is oriented towards North direction.
2) When side daylight is utilized in the model of office building then following things are observed:
a) The highest value of annual electricity consumption is 342820 kilowatt hour. This value is obtained when the building is oriented towards North West direction.
b) The values of annual electricity consumption is different for different directions in which the building is oriented.
c) The lowest value of annual electricity consumption is 339210 kilowatt hour. This value is obtained when the building is oriented towards South East direction.
d) Utilization of side daylight results in reduction in annual electricity consumption of the office building model, no matter in which direction the building is oriented, though the amount of reduction is different for different directions.
[image:17.595.37.286.344.704.2]