Sclerosis: Correlation with Clinical Classification
Yukio Miki, Robert I. Grossman, Jayaram K. Udupa, Supun Samarasekera, Mark A. van Buchem, Brian S. Cooney, Stuart N. Pollack, Dennis L. Kolson, Christian Constantinescu, Marcia Polansky, and Lois J. Mannon
PURPOSE: To study the utility of a computer-assisted method of quantitating enhancing multiple sclerosis (MS) lesions and to correlate this quantitation with the type and duration of disease. METHODS: Forty untreated patients with MS were studied. The patients had been classified clinically as having either relapsing-remitting (n527) or chronic-progressive (n513) disease. Postcontrast contiguous 3-mm-thick MR images of the brain were obtained for up to 3 years. The computer program selected potential lesion sites automatically on the basis of the theory of “fuzzy connectedness,” which was incorporated into 3DVIEWNIX software. True lesions were selected from these previously detected potential lesions by means of yes/no responses to the program query. The number of enhancing lesions and the enhancing lesion volume were subsequently computed. RESULTS: The enhancing lesion volume in patients with relapsing-remitting disease was statistically significantly higher than that of patients with chronic-progressive disease. There was a strong positive correlation between the number of enhancing lesions and the enhancing lesion volume. No significant correlation was noted between the change in score on the expanded disability status scale (EDSS) and the change in the number of enhancing lesions, or between the change in EDSS score and the change in enhancing lesion volume. A negative correlation was found between enhancing lesion volume and duration of disease, and between the number of enhancing lesions and duration of disease in the patients who had enhancing lesions. CONCLU-SIONS: Our data suggest that enhancing lesion volume reflects differences in the classification of clinical MS and in the disease activity over time. Computer-assisted quantitation of enhancing lesion volume is a robust, practical, and objective measure of MS activity.
Index terms: Sclerosis, multiple; Brain, magnetic resonance; Brain, measurements; Computers
AJNR Am J Neuroradiol18:705–710, April 1997
Magnetic resonance (MR) imaging has been established as the imaging method of choice for monitoring multiple sclerosis (MS) lesions (1– 4). A pathologic hallmark of an active MS lesion is the presence of perivenous inflammatory changes. Concomitant with some of these
changes are transient abnormalities in the blood-brain barrier that are thought to be re-sponsible for contrast enhancement in MR im-aging. Contrast-enhanced MR images are more sensitive in showing lesion activity than are im-ages obtained with a long repetition time (TR) (3, 5). Computer-assisted volumetry is needed to develop a method that objectively quantitates enhancement and determines efficacy in clini-cal therapeutic trials, because manual mea-surement is time consuming and can produce unacceptably high intraobserver and interob-server variability. In most of the previous stud-ies, investigators have monitored enhancement by manually counting lesions or manually mea-suring the diameter of enhancing lesions (6 – 13), although there have been many attempts to measure the volume of MS lesions on T2-weighted MR images (14 –21). A few studies
Received May 24, 1996; accepted after revision November 27. Supported in part by grants R01 NS2 9029 – 01A1, CA 56071, and M01-RR00040 from the National Institutes of Health.
From the Departments of Radiology (Y.M., R.I.G., J.K.U., S.S., M.A.V.B., B.S.C., S.N.P, L.J.M.) and Neurology (D.L.K., C.C.), Hospital of the University of Pennsylvania, Philadelphia; and the Department of Bio-metrics and Computing, Hahnemann University, Philadelphia (M.P.).
Address reprint requests to Robert I. Grossman, Department of Radiol-ogy, Hospital of the University of Pennsylvania, Ground Floor, Founders, 3400 Spruce St, Philadelphia, PA 19104.
AJNR 18:705–710, Apr 1997 0195-6108/97/1804 –0705
©American Society of Neuroradiology
have investigated enhancing lesion volume (ELV) (22, 23). Smith et al (22) and Frank et al (23) measured ELV by means of a computer software application; however, they did not de-scribe the technique they used in that software. In this study, we used a newly developed com-puterized method to analyze lesion enhance-ment in the brain quantitatively and studied the utility of this method for quantitating enhancing MS lesions and for correlating this quantitation with the type and duration of disease.
Materials and Methods
Forty patients, 29 women and 11 men, 20 to 62 years old, with clinically definite MS as defined by Poser criteria (24), were entered into a prospective study. Among these, 28 patients were recruited from the Comprehensive Multi-ple Sclerosis Center of the Hospital of the University of Pennsylvania and were under the care of a neurologist specializing in MS. These patients were not enrolled in other clinical studies and were receiving only symptomatic treatment, such as antispasticity agents, analgesics, and bowel/bladder management when necessary. None were receiving immunomodulating therapy or chronic steroid therapy. Acute exacerbations were treated with brief courses (,15 days) of corticosteroids. An additional 12 patients with relapsing-remitting disease were recruited from an ongoing randomized double-blind placebo-con-trolled study of relapsing-remitting MS. Similar to the orig-inal 28 patients, these “placebo” patients received no im-munomodulating therapy or chronic steroids and were treated for acute exacerbations with brief courses of corti-costeroids when considered appropriate by their treating neurologist. The extent of disability was graded according to the Expanded Disability Status Scale (EDSS) (25). The patients had been classified clinically into either relapsing-remitting (n527) or chronic-progressive (n513) groups as follows: relapsing-remitting patients had at least two relapses over the preceding 2 years, with relapses defined as a new neurologic deficit or exacerbation of a previous deficit occurring in a previously stable patient confirmed by examination and developing over a period of 1 to 5 days and lasting at least 48 hours; chronic-progressive patients had an increase in their EDSS score of at least 1.0 over the preceding year without an acute exacerbation. Clinical examinations were carried out in a nonblinded manner by neurologists who specialize in the care of pa-tients with MS. Written informed consent was obtained from each patient. All MR studies (129 for relapsing-remit-ting patients, 36 for chronic-progressive patients) were performed with a 1.5-T imager and with a quadrature transmitter/receiver head coil. These patients were im-aged immediately after administration of 0.1 mmol/kg gadopentetate dimeglumine with a T1-weighted spin-echo sequence (600/27/1 [repetition time/echo time/excita-tion]), a 256 3 192 matrix, a 22-cm field of view, and
interleaved, contiguous 3-mm-thick sections. In the period of more than 3 years, six patients were scanned once, four patients twice, six patients three times, eight patients four times, four patients five times, seven patients six times, two patients seven times, two patients eight times, and one patient nine times.
All raw image data were transferred from the scanner directly to a Sun Sparc 20 (Sun Microsystems, Mountain View, Calif) workstation (one processor, 256 MB RAM) via the picture archiving and communications system of our department. Our software running on the workstation se-lected and delineated potential lesion sites automatically using a method based on a new theory of “fuzzy connect-edness” (26). The algorithms, described in a separate article (27), were implemented on this workstation with an internal version of a software system called 3DVIEWNIX developed in our department. A neuroradiologist then in-dicated which were the true lesions among these comput-er-detected potential lesions by clicking a mouse button (Fig 1). The total ELV and number of enhancing lesions (NEL) from each study were subsequently computed. It took about 5 minutes for the software to select and delin-eate potential lesion sites in one postcontrast MR exami-nation comprising 48 sections. It took approximately 5 minutes to learn to use the software and approximately 1 minute of operator time per MR examination. The software had been tested by four examiners (seven patients, 336 sections), with 0% intraobserver and interobserver vari-ability (27). The software had also been shown to have 1.3% false-negative volume fraction (27) (that is, the vol-ume of the false-negative lesions as a percentage of the total true lesion volume).
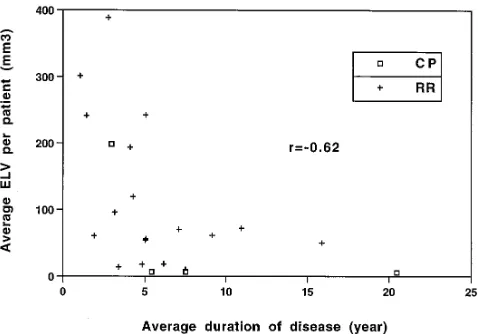
To correlate NEL with ELV, data from the first studies of patients who had at least one enhancing lesion were used and Spearman’s test was applied for analysis. To correlate change in EDSS score with change in NEL/ELV, data from the first and second studies of each patient who was scanned more than once were used and Spearman’s test was applied. To analyze the change in ELV over the dura-tion of the study, the ELV of the first and the last studies of each patient who was scanned more than once were used and Student’s t test was applied. To correlate ELV with duration of disease, the average ELV per patient (ELV of all studies/number of studies for the patient) and average duration of disease among patients who had at least one enhancing lesion were used and Spearman’s test was ap-plied. Wilcoxon’s rank sum test was used to compare ELV of the relapsing-remitting group with that of the chronic-progressive group and to compare NEL and ELV of the natural history group with those of the placebo group.
Results
enhancing lesion. The average NEL over all studies was 0.92. The average NEL for the re-lapsing-remitting group was 1.01 (maximum, 15); the average NEL for the chronic-progres-sive group was 0.36 (maximum, 4). The aver-age ELV over all studies was 62.7 mm3. The average ELV for the relapsing-remitting group
was 74.9 mm3 (maximum, 1140 mm3); the
average ELV for the chronic-progressive group was 18.9 mm3(maximum, 281 mm3).
We found a strong positive correlation be-tween NEL and ELV (r 5 .69,P 5 .0004) (Fig 2), but no correlation between NEL and average
ELV per lesion (ELV/NEL for each study) (r 5
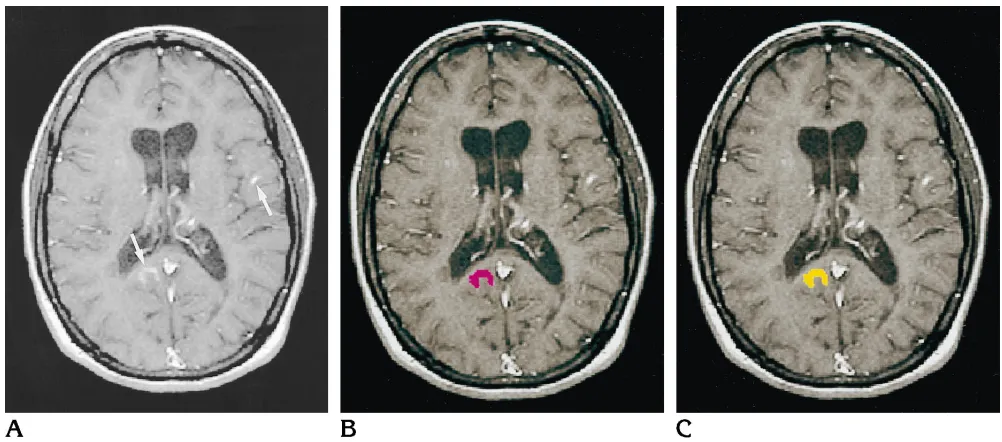
.18,P 5.42) (Fig 3). No significant correlation was noted between the change in EDSS score and the change in NEL (r5 2.28,P 5.11), or between the change in EDSS score and the change in ELV (r 5 2.31, P 5 .07) (Fig 4). A significant negative correlation was found be-tween the average ELV per patient and average duration of disease (r5 2.62,P5.002) (Fig 5) and between the average NEL per patient and average duration of disease (r5 2.44,P5.04) for the patients who had at least one enhancing lesion. No relationship was found between du-Fig 1.A, Contrast-enhanced T1-weighted MR image shows enhancing MS lesions (arrows).
B, During the verification step, the software shows potential lesions one by one (in red) to the operator.
[image:3.587.47.548.82.303.2]C, After a “yes” response from the operator, the software changes the color of the lesion display (to yellow) to confirm acceptance of the potential lesion as a true lesion.
Fig 2. ELV is plotted versus NEL for the first study of each patient who had at least one enhancing lesion. The correlation coefficient is indicated (r). A strong positive correlation was noted between the NEL and the total ELV of each study.
[image:3.587.53.548.353.522.2]ration of disease and proportion of patients with enhancing lesions. The ELV for the relapsing-remitting group was statistically significantly larger than that for the chronic-progressive group (P5.04). No significant differences were observed in ELV changes over the duration of the study between the two groups (P5.83). No significant difference of ELV or NEL was noted between the natural history study group and the placebo group (P 5 .47 and P 5 .50, respec-tively).
Discussion
MS lesions enhance after injection of contrast media because of a transient abnormality in the blood-brain barrier produced by a perivenous inflammatory process. Histopathologically, ac-tive lesions have been correlated with contrast enhancement (3, 28). Clearly, then, as a poten-tial marker for histopathologic changes as well as for possible clinical changes in patients, it is important to quantitate enhancement to know the effect of therapeutic trials on disease activ-ity. In this regard, both NEL and ELV are useful
parameters to follow, since independent
changes in either NEL or ELV have already been reported (22).
Many investigators have reported the findings in serial enhanced studies of MS (5, 6, 8 –13, 22, 23, 29 – 41). In the two studies that investigated ELV with computer methodology, Smith et al (22) and Frank et al (23) used the computer software program Analyze (5.0.1) to measure ELV; they did not describe what technique they used on that software. Our study is based on the notion that computer algorithms are superior to humans in the delineation of objects and that humans are superior to computer algorithms in most recognition tasks. In our study, the func-tions of detecting potential lesion sites and de-termining their extent were fully automated on the basis of the theory of fuzzy connectedness in conjunction with fuzzy topological concepts (26), which enabled the suppression of intraob-server and interobintraob-server variability of lesion de-lineation. Images are by nature fuzzy. Objects in the images, such as lesions, have two important characteristics: they have a graded constitution (ie, they are not binary) and the elements form-ing the object hang together in a fuzzy way. Both these characteristics are handled effec-tively by the fuzzy connectedness method.
[image:4.587.50.290.83.254.2]In our method, an operator selects true le-sions and discards false lele-sions from the com-puter-detected lesions. Thus, operator variabil-ity comes from the recognition task and not from the process of delineation. All computer-selected false lesion sites in this study were hyperintensities from vessels, fat, choroid plexus, or phase artifacts derived from blood flow, and were clearly differentiated from le-sions by an experienced neuroradiologist (27). Our software was tested in seven patients (336 sections) by four examiners, with no intraob-server and interobintraob-server variability (27). We Fig 4. Change in ELV is plotted versus the change in EDSS
score (unit changes of 0.5 U) between the first and second studies of each patient. The correlation coefficient is indicated (r). No correlation was noted between the change in the EDSS score and the change in ELV.
[image:4.587.50.289.347.514.2]also used 3-mm-thick images to minimize problems with volume averaging that could have resulted in erroneous conclusions about lesions disappearing, decreasing, or increasing in size (42). More important, erroneous conclu-sions were minimized by the three-dimensional nature of the method, which detects each 3-D lesion as a 3-D fuzzy connected object, and by the fuzzy nature of delineation. We emphasize that lesion delineation in all 165 studies was determined to be accurate by visual examina-tion by the neuroradiologist who participated in the verification step. We note that establishing the true accuracy of delineation in tasks in which true delineation cannot be established is still an open problem in image processing.
We found a statistically significant strong positive correlation between NEL and ELV (Fig 2), which is consistent with the findings by Smith et al (22), who reported that the ELV fluctuated in parallel with the NEL. There was no correlation between NEL and average ELV per lesion (Fig 3), suggesting that the volume of each lesion is independent of NEL. No correla-tion was noted between change in EDSS score and change in NEL/ELV (Fig 4), which is in contrast to the reports by Frank et al (23) and Khoury et al (43). This is not surprising, be-cause enhancement per se does not necessarily equate with symptomatic lesions (6, 8), be-cause some lesions may be located in areas in which they cannot cause physical disability, and because spinal cord lesions, which occa-sionally do cause severe disabilities, were not measured in this study. A negative correlation was found between average disease duration and average ELV/average NEL for each patient who had enhancing lesions, although there was no relationship between duration of disease and proportion of patients with enhancing lesions. This suggests that inflammation becomes less prominent as time goes on. This is also consis-tent with the notion that some relapsing-remit-ting diseases progress to chronic-progressive disease (44), which may have implications for therapeutic protocols. Although the relationship between blood-brain barrier disruption (en-hancement) and long-term disability has not been established (23), it may be useful to have a long-term follow-up study of patients who have significant ELV in the early stage of their isease to understand the nature and variety of MS. In our study, the ELV for the relapsing-remit-ting group was statistically significantly larger
than that for the chronic-progressive group, which should be kept in mind in therapeutic protocols.
In conclusion, our data suggest that ELV re-flects differences in the clinical MS classification and in the disease activity over time. Computer-assisted ELV quantitation is a robust, practical, and objective measure of activity of MS, which can be used to examine the efficacy of any existing or future therapeutic trials.
References
1. Grossman RI, Gonzalez SF, Atlas SW, Galetta S, Silberberg DH. Multiple sclerosis: gadolinium enhancement in MR imaging. Radi-ology1986;161:721–725
2. Horowitz AL, Kaplan RD, Grewe G, White RT, Salberg LM. The ovoid lesion: a new MR observation in patients with multiple scle-rosis.AJNR Am J Neuroradiol1989;10:303–305
3. Nesbit GM, Forbes GS, Scheithauer BW, Okazaki H, Rodriguez M. Multiple sclerosis: histopathologic and MR and/or CT correlation in 37 cases at biopsy and three cases at autopsy.Radiology 1991;180:467– 474
4. Gean MA, Vezina LG, Marton KI, et al. Abnormal corpus callosum: a sensitive and specific indicator of multiple sclerosis.Radiology 1991;180:215–221
5. Miller DH, Barkhof F, Nauta JJ. Gadolinium enhancement in-creases the sensitivity of MRI in detecting disease activity in mul-tiple sclerosis.Brain1993;116:1077–1094
6. Harris JO, Frank JA, Patronas N, McFarlin DE, McFarland HF. Serial gadolinium-enhanced magnetic resonance imaging scans in patients with early, relapsing-remitting multiple sclerosis: im-plications for clinical trials and natural history.Ann Neurol1991; 29:548 –555
7. Barkhof F, Hommes OR, Scheltens P, Valk J. Quantitative MRI changes in gadolinium-DTPA enhancement after high-dose intra-venous methylprednisolone in multiple sclerosis.Neurology1991; 41:1219 –1222
8. Capra R, Marciano N, Vignolo LA, Chiesa A, Gasparotti R. Gado-linium-pentetic acid magnetic resonance imaging in patients with relapsing remitting multiple sclerosis.Arch Neurol1992;49:687– 689
9. Wiebe S, Lee DH, Karlik SJ, et al. Serial cranial and spinal cord magnetic resonance imaging in multiple sclerosis.Ann Neurol 1992;32:643– 650
10. Thompson AJ, Miller D, Youl B, et al. Serial gadolinium-enhanced MRI in relapsing/remitting multiple sclerosis of varying disease duration.Neurology1992;42:60 – 63
11. McFarland HF, Frank JA, Albert PS, et al. Using gadolinium-enhanced magnetic resonance imaging lesions to monitor disease activity in multiple sclerosis.Ann Neurol1992;32:758 –766 12. Barkhof F, Scheltens P, Frequin ST, et al. Relapsing-remitting
multiple sclerosis: sequential enhanced MR imaging vs clinical findings in determining disease activity.AJR Am J Roentgenol 1992;159:1041–1047
13. Nauta JJ, Thompson AJ, Barkhof F, Miller DH. Magnetic reso-nance imaging in monitoring the treatment of multiple sclerosis patients: statistical power of parallel-groups and crossover de-signs.J Neurol Sci1994;122:6 –14
15. Cline HE, Lorensen WE, Kikinis R, Jolesz F. Three-dimensional segmentation of MR images of the head using probability and connectivity.J Comput Assist Tomogr1990;14:1037–1045 16. Wicks DA, Tofts PS, Miller DH, et al. Volume measurement of
multiple sclerosis lesions with magnetic resonance images: a preliminary study.Neuroradiology1992;34:475– 479
17. Filippi M, Horsfield MA, Tofts PS, Barkhof F, Thompson AJ, Miller DH. Quantitative assessment of MRI lesion load in monitoring the evolution of multiple sclerosis.Brain1995;118:1601–1612 18. Kamber M, Shinghal R. Model-based 3-D segmentation of
multi-ple sclerosis lesions in magnetic resonance brain images.IEEE Trans Med Imaging1995;14:442– 453
19. Broderick JP, Narayan S, Gaskill M, Dhawan AP, Khoury J. Volu-metric measurement of multifocal brain lesions: implications for treatment trials of vascular dementia and multiple sclerosis. J Neuroimaging1996;6:36 – 43
20. Johnston B, Atkins MS, Mackiewich B, Anderson M. Segmenta-tion of multiple sclerosis lesions in intensity corrected multispec-tral MRI.IEEE Trans Med Imaging1996;15:154 –169
21. Udupa JK, Wei L, Samarasekera S, Miki Y, van Buchem MA, Grossman RI. Multiple sclerosis lesion quantification using fuzzy connectedness principles.IEEE Trans Med Imaging(in press) 22. Smith ME, Stone LA, Albert PS, et al. Clinical worsening in
mul-tiple sclerosis is associated with increased frequency and area of gadopentetate dimeglumine-enhancing magnetic resonance im-aging lesions.Ann Neurol1993;33:480 – 489
23. Frank JA, Stone LA, Smith ME, Albert PS, Maloni H, McFarland HF. Serial contrast-enhanced magnetic resonance imaging in pa-tients with early relapsing-remitting multiple sclerosis: implica-tions for treatment trials.Ann Neurol1994;36:S86 –S90 24. Poser CM, Paty DW, Scheinberg L, et al. New diagnostic criteria
for multiple sclerosis: guidelines for research protocols.Ann Neu-rol1983;13:227–231
25. Kurtzke JF. Rating neurological impairment in multiple sclerosis: an expanded disability status scale (EDSS).Neurology1983;33: 1444 –1452
26. Udupa JK, Samarasekera S. Fuzzy connectedness and object definition: theory, algorithms and applications in image segmen-tation.Graph Models Image Processing1996;58:246 –261 27. Samarasekera S, Udupa JK, Miki Y, Wei L, Grossman RI. A new
computer-assisted method for the quantification of enhancing lesions in multiple sclerosis.J Comput Assist Tomogr1997;21: 145–151
28. Katz D, Taubenberger JK, Cannella B, McFarlin DE, Raine CS, McFarland HF. Correlation between magnetic resonance imaging findings and lesion development in chronic, active multiple scle-rosis.Ann Neurol1993;34:661– 669
29. Grossman RI, Braffman BH, Brorson JR, Goldberg HI, Silberberg DH, Gonzalez SF. Multiple sclerosis: serial study of gadolinium-enhanced MR imaging.Radiology1988;169:117–122
30. Miller DH, Rudge P, Johnson G, et al. Serial gadolinium enhanced magnetic resonance imaging in multiple sclerosis.Brain1988; 111:927–939
31. Kermode AG, Thompson AJ, Tofts P, et al. Breakdown of the blood-brain barrier precedes symptoms and other MRI signs of new lesions in multiple sclerosis: pathogenetic and clinical impli-cations.Brain1990;113:1477–1489
32. Bastianello S, Pozzilli C, Bernardi S, et al. Serial study of gadolin-ium-DTPA MRI enhancement in multiple sclerosis. Neurology 1990;40:591–595
33. Thompson AJ, Kermode AG, Wicks D, et al. Major differences in the dynamics of primary and secondary progressive multiple scle-rosis.Ann Neurol1991;29:53– 62
34. Capra R, Marciano N, Cotti CV, et al. Immunological and gado-linium-DTPA MRI evaluation of relapsing remitting multiple scle-rosis.Acta Neurol Scand1992;86:342–345
35. Miller DH, Thompson AJ, Morrissey SP, et al. High dose steroids in acute relapses of multiple sclerosis: MRI evidence for a possible mechanism of therapeutic effect.J Neurol Neurosurg Psychiatry 1992;55:450 – 453
36. Goodkin DE, Ross JS, Medendorp SV, Konecsni J, Rudick RA. Magnetic resonance imaging lesion enlargement in multiple scle-rosis: disease-related activity, chance occurrence, or measure-ment artifact?Arch Neurol1992;49:261–263
37. Mattioli F, Cappa SF, Cominelli C, Capra R, Marcianoc N, Gaspa-rotti R. Serial study of neuropsychological performance and gad-olinium-enhanced MRI in MS.Acta Neurol Scand1993;87:465– 468
38. Bastianello S, Pozzilli C, D’Andrea F, et al. A controlled trial of mitoxantrone in multiple sclerosis: serial MRI evaluation at one year.Can J Neurol Sci1994;21:266 –270
39. Barkhof F, Tas MW, Frequin ST, et al. Limited duration of the effect of methylprednisolone on changes on MRI in multiple scle-rosis.Neuroradiology1994;36:382–387
40. Kidd D, Thompson AJ, Kendall BE, Miller DH, McDonald WI. Benign form of multiple sclerosis: MRI evidence for less frequent and less inflammatory disease activity.J Neurol Neurosurg Psy-chiatry1994;57:1070 –1072
41. Guttmann CRG, Ahn SS, Hsu L, Kikinis R, Jolesz FA. The evolu-tion of multiple sclerosis lesions on serial MR.AJNR Am J Neu-roradiol1995;16:1481–1491
42. Grossman RI, Yousem DM. White matter diseases. In: Thrall JH, ed.Neuroradiology: The Requisites.St Louis, Mo: Mosby; 1994: 201–224
43. Khoury SJ, Guttmann CR, Orav EJ, et al. Longitudinal MRI in multiple sclerosis: correlation between disability and lesion bur-den.Neurology1994;44:2120 –2124