Leo F. Czervionke 1 David L. Daniels Peter S. P. Ho Shiwei Yu Peter Pech2 Julie A. Strandt Alan L. Williams Victor M. Haughton
Received May 15. 1987; accepted after revision October 19,1987.
, All authors: Department of Radiology, Medical College of Wisconsin, Froedtert Memorial Lutheran Hospital, 9200 W. Wisconsin Ave., Milwaukee, WI 53226. Address reprint requests to L. F. Czer-vionke.
2 Present address: Department of Radiology,
University Hospital, S-750 14 Uppsala, Sweden.
AJNR 9:557-562, May/June 1988 0195-6108/88/0903-0557
© American Society of Neuroradiology
557
The MR Appearance of Gray and
White Matter in the Cervical Spinal
Cord
Artifacts that can distort the appearance of the cervical spinal cord are caused by data truncation during MR image reconstruction. We used a phantom and then correlated anatomic sections with MR images in cadavers and normal volunteers to evaluate the effect of truncation artifacts on the MR appearance of the spinal cord. When truncation artifacts are minimized, the gray matter and major white-matter columns in the cervical cord can be recognized. T2-weighted gradient-echo MR techniques can best differen
-tiate gray from white matter.
Artifacts that can alter the MR appearance of cervical spine images include those produced by data truncation, patient motion, vascular and CSF pulsation, chemical shift, even-echo rephasing, and magnetic field distortions [1-4]. The concept of the truncation artifact (Gibb phenomenon) in MR is not new, but the effect of truncation artifacts on the appearance of the cervical spinal cord has not been analyzed [5-7]. Our purpose is to describe the MR appearance of the cervical cord gray and white matter and to demonstrate the effect of truncation artifacts on the MR appearance.
Materials and Methods
A phantom containing test tubes was designed to simulate the shape of the spinal cord.
Three test tubes with diameters of 10, 13, and 16 mm were filled with a saline solution. A fourth test tube measuring 13 mm in diameter was filled with corn oil. The fifth tube contained air and measured 13 mm in diameter. All test tubes were suspended in a gelatin-containing saline solution. Spin- and gradient-echo MR images of the phantom were obtained. With the phase-encoding axis set perpendicular to the long axis of the test tubes, the following parameters were used: TR = 2000, TE = 20, one excitation, 128 x 256 and 256 x 256 matrix, 5-mm slice thickness, and 20- and 24-cm field of view.
Seven normal volunteers and three fresh cadavers were examined on a 1.5-T MR scanner' with a combination of spin-echo and gradient-echo pulse sequences. The MR images were compared with sagittal and axial MR scans obtained in the three cadavers. Anatomic sections in the cadavers were obtained by cryomicrotome techniques previously described [8] and were compared with the MR images. A 3-in. butterfly surface coil was used to examine the cadavers and volunteers.
T1- and T2-weighted MR images were obtained. Image parameters used to obtain T1-weighted spin-echo (SE) images included TR
= 800
, TE=
20, two or four excitations, 128 x 256 or 256 x 256 matrix, 3- or 5-mm slice thickness, and 16-, 20-, or 24-cm field of view. Proton-density and T2-weighted SE images were obtained in conjunction with ECG or peripheral gating with TR = 2000-2500, TE = 20 and 80, one excitation, 128 x 256 or 256 x 256 matrix, 5-mm slice thickness, and 20- or 24-cm field of view.Two types of gradient-echo MR techniques were used. (1) GRE is a sequential single-slice
technique that was used in conjunction with gradient moment-nulling flow compensation. T2-weighted GRE were acquired with the following parameters: TR
=
200, TE=
13, four excitations, 128 x 128 or 256 x 256 matrix, 24-cm field of view, and 10° flip angle. T1558 CZERVIONKE ET AL. AJNR:9, May/June 1988
weighted GRE pulse sequences were not obtained. (2) PSI is a true multislice gradient-echo technique. Cardiac gating was not used with the PSI pulse sequences. T1-weighted PSI images were acquired with TR = 300-500, TE = 8-10, one or two excitations, 128 x 256 or 256 x 256 matrix, 3- or 5-mm slice thickness, 20- or 24-cm field of view, and 1200 flip angle. Proton-density and T2-weighted PSI
images were obtained with TR = 750, TE = 8-10 and 18-20, two
excitations, 256 x 256 matrix, 3- or 5-mm slice thickness, 20- or
24-cm field of view, and 100 flip angle.
Results
The test tube phantom study characterized truncation
ar-tifacts. In the axial or sagittal plane these artifacts were seen
as alternating bands of low and high signal intensity parallel
to the wall of each test tube. These bands are propagated
along the phase-encoding axis, but they are oriented perpen-dicular to this axis. They were more conspicuous in the phase-encoding direction when a 128
x 256 matrix was used. They
were less evident when a 256x
256 matrix was used (Fig. 1). In axial images, these bands had a slightly oval shape withthe long axis of the artifact perpendicular to the
phase-encoding axis. The number of truncation bands within the
tubes increased with increasing tube diameter. The 10-mm-diameter test tube (which most closely corresponds to the normal spinal cord diameter) contained a prominent, centrally located band in both the axial and sagittal planes.
Fig. 1.- Test tube phantom showing effects of truncation artifacts at 24-cm field of view. Test tubes 1, 3, and 5 contain saline. Test tubes 2 and 4 contain air and oil, respectively. In row A, 128 x 256 matrix was used; in row B, 256 x 256 matrix was used (phase-encoding axis right-left).
Trun-~ation. artifacts are seen as alternating bands of low and high signal Intensity parallel to test tube walls. Truncation artifacts are negligible in row B but are not eliminated, even with a 256 x 256 matrix. Note that there are more truncation bands in tube 1 (16-mm diameter) than in tube 5 (10-mm diameter). Tube 5 contains a single truncation band and more closely approximates normal spinal cord diameter.
On sagittal proton-density and T2-weighted spin- or gra-dient-echo MR images obtained in cadavers with a 256
x
256 matrix, the prominent structure observed within the cord is a thin band of high signal intensity located in the cord anterior to midline. This band corresponds in location and width to central gray matter seen on sagittal anatomic sections (Fig. 2). This band of gray matter extended into the posterior aspect of the medulla and terminated at the obex.Another type of band was seen in sagittal MR images with a 128
x
256 matrix. It was broader than the true central gray-matter band and located midline in the cord. With both spin-and gradient-echo techniques, this bspin-and had low signal inten-sity on T1-weighted images and high signal inteninten-sity on proton-density-weighted and T2-weighted images. When ma-trix size was changed to 256x
256, this midline band was no longer obvious: In the T1-weighted images, the cord appeared homogeneous (Fig. 3); in the T2-weighted images, the thin band of bright signal corresponding to central gray matter became apparent, located anterior to the midline of the cord (Fig. 4).On axial T2- and proton-density-weighted MR images ob-tained with a 256
x 256 matrix in cadavers
, the cervical gray matter had higher signal intensity than the white matter. The configuration of gray and white matter correlated with ana-tomic sections (Fig. 5). This same appearance was also observed in axial proton-density-weighted and T2-weightedspin-echo and gradient-echo MR images obtained in normal volunteers (Fig. 6). In T1-weighted axial images, a pattern was seen that correlated less exactly with the gray and white matter distribution seen on T2-weighted images. In the mid-line, a hypointense, triangular-shaped structure was noted posteriorly and this was flanked by small, round, hypointense structures in the lateral aspect of the cord (Fig. 6A). Portions of the cord white matter were isointense with gray matter.
Discussion
Without the artifacts caused by pulsatile CSF, flowing blood, and patient motion, the MR images from cadavers demonstrated the gray and white matter in the cervical spinal cord effectively. Because of postmortem changes, MR images
in cadavers were not anticipated to be identical to those in live humans. Nevertheless, the images were qualitatively similar.
The phantom is not an ideal model for studying the interface between cord and CSF because the test tube walls have thickness. However, the phantom study did predict the trun-cation effects observed in MR images of normal volunteers and how the artifact may be minimized to reveal normal gray matter within the cord.
Data truncation artifacts (Gibb phenomenon) occur at high contrast interfaces (e.g., between cord and CSF) when
Four-ier transforms are used to reconstruct images from acquired
MR data [1-3]. Because only a finite amount of phase and
frequency information is obtained and stored in the data
matrix, the Fourier series used to transform these data into
images is finite-that is, "truncated."
[image:2.612.55.299.396.644.2]AJNR:9. May/June 1988 MR OF SPINAL CORD GRAY jWHITE MA TIER 559
Fig. 2.-Sagittal cervical spine.
A, Anatomic section shows that most of the gray matter (arrows) is located anterior to cord midline.
B, Anatomic section at cervicomedullary junc-tion shows that central gray matter (arrows) is positioned posterior to decussating pyramidal tracts (P) extending toward obex (0). G = gracilis tubercle.
C, Proton-densily-weighted MR image in ca-daver shows central gray matter in cord located slightly anterior to midline (arrows) (27-min ac-quisition time).
D, Proton-densily-weighted gradient-echo im-age in normal volunteer shows same position of central gray matter (arrows) (3-min acquisition time). Note that a thin, faint, white truncation band still occurs in cord posterior to midline
(arrowheads), even with a 256 x 256 matrix.
c
results in imprecise depiction of boundaries or interfaces where there is an abrupt transition between zones of high and low signal intensity. In MR images, this impression is represented by truncation artifacts that appear as alternating bands of high and low signal intensity, which parallel high-contrast interfaces and become less conspicuous with in-creasing distance from the interface. Mathematically, trunca-tion artifacts are represented by an oscillating functrunca-tion that resembles a sine wave, except its peaks and valleys (maxima and minima) diminish in amplitude with increasing distance from the interface [9].
The peaks and valleys of this oscillating "sinc" function alternately "overshoot" and "undershoot" the true signal in
-tenSity of tissue on both sides of the interface and correspond to the truncation bands seen on MR images.
B
o
When two high-contrast interfaces are in proximity (e.g., anterior and posterior cordjCSF boundary), truncation arti-facts produced at each interface will cancel or reinforce one another depending on the distance between the interfaces (Czervionke L, unpublished data). Therefore, the number and intensity of truncation bands seen between two interfaces depend on the distance between the interfaces (Fig. 1).
560
A
B
A
B
A
B
CZERVIONKE ET AL. AJNR:9, May/June 1988
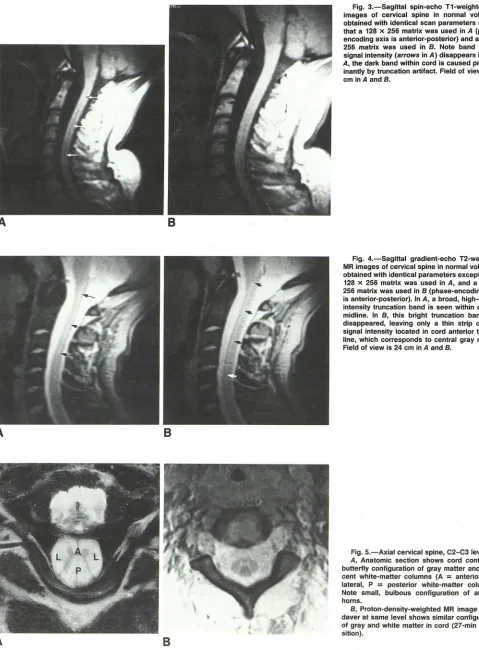
Fig, 3,-Sagittal spin-echo T1-weighted MR
images of cervical spine in normal volunteer obtained with identical scan parameters except that a 128 x 256 matrix was used in A (phase-encoding axis is anterior-posterior) and a 256 x 256 matrix was used in B. Note band of low signal intensity (arrows in A) disappears in B. In
A, the dark band within cord is caused
predom-inantly by truncation artifact. Field of view is 24 cm inA and B.
Fig. 4.-Sagittal gradient-echo T2-weighted
MR images of cervical spine in normal volunteer
obtained with identical parameters except that a 128 x 256 matrix was used in A, and a 256 x 256 matrix was used in B (phase-encoding axis is anterior-posterior). In A, a broad, high-signal-intensity truncation band is seen within cord in midline. In B, this bright truncation band has disappeared, leaving only a thin strip of high signal intensity located in cord anterior to mid-line, which corresponds to central gray matter.
Field of view is 24 cm in A and B.
Fig. 5.-Axial cervical spine, C2-C3 level.
A, Anatomic section shows cord containing butterfly configuration of gray matter and adja-cent white-matter columns (A
=
anterior, L=
lateral, P=
posterior white-matter cOlumns).Note small, bulbous configuration of anterior horns.
B, Proton-density-weighted MR image in
ca-daver at same level shows similar configuration
[image:4.612.61.540.79.729.2] [image:4.612.58.394.81.547.2]AJNR:9, May/June 1988 MR OF SPINAL CORD GRAY/WHITE MADER 561
Fig, S.-Axial cervical spine, C5-CS level.
A, Anatomic section shows that posterior col-umn (P) has triangular shape. F = anterior me-dian fissure. Note anterior horns (arrows) are larger at this level.
B, Axial T1-weighted gradient-echo image in normal volunteer. TR
=
450, TE=
8. Note trian-gular region of low intensity (small arrows) in cord corresponds approximately to posterior white-matter columns. Anterior portion of "trian-gle" points toward anterior median fissure. Small round structures in cord laterally (large arrows)correspond to position of lateral corticospinal tracts.
C and D, In same volunteer, proton-density-weighted (C) and T2-proton-density-weighted gradient-echo im-age (D) reveal butterfly configuration of gray matter and adjacent white matter. TR
=
750, TE=
9 and 18.A
c
truncation artifact is minimized by using a 256
x
256 matrix,the thin bright band of central gray matter in the anterior aspect of the cord can be demonstrated (Figs. 48 and 2D).
However, even by increasing the matrix size to 256
x
256,the truncation artifact is not completely eliminated (see Fig.
1). For example, a 256
x
256 matrix was used to obtain Fig.2D. In this figure, a thin, faint white band appears in the cord posterior to midline, which represents a truncation band.
Truncation bands are particularly well seen on sagittal MR images in the cord because the highly contrasting CSF/cord interfaces, anteriorly and posteriorly, remain relatively equidi s-tant throughout the cervical spine.
Gradient-echo MR techniques effectively demonstrate the gray matter and adjacent white-matter columns of the cervical
cord in the clinical setting where relatively short acquisition times are preferable. Gradient-echo images provide greater
tissue contrast than do spin-echo images for a given acqui-sition time [10]. With long acquisition times, similar contrast
between gray and white matter can be achieved with spin
-echo pulse sequences (Figs. 2C and 58).
The majority of the cervical cord gray matter is located in
B
D
the anterior aspect of the cord on either side of the central
canal, and this gray matter can be demonstrated on axial and sagittal MR. More cephalad, the bulk of the gray matter
accompanies the central canal into the posterior medulla toward the obex.
On axial anatomic sections, the anterior and posterior horns are thin structures in the upper cervical cord, but the anterior
horns widen and progress caudally toward the cervical en -largement (Figs. 5 and 6). The butterfly configuration of the
cord gray matter can be seen on axial MR images.
Relative to white matter, gray matter in the cord or brain
has longer T2 and therefore displays higher signal intensity
than white matter on T2-weighted images. The T1 relationship
of gray and white matter in the cord is not the same as that
observed in the brain. In the brain, the T1 of gray matter
exceeds that of white matter; in the cord, some white-matter
tracts clearly have longer T1 than does gray matter, while
portions of the white matter are nearly isointense with gray
matter. This was observed on T1-weighted spin-echo and
562 CZERVIONKE ET AL. AJNR:9, May/June 1988
posteriorly conforms to a large portion of the posterior
col-umns. Similarly, small round areas of low intensity in the
lateral aspects of the cord do not correspond to the full extent
of the lateral white-matter columns. Anatomically, these round
regions correlate with the location of the lateral corticospinal
tracts (11). Further work is needed to determine why some
white-matter tracts have different signal intensity than others
and why some cord white matter appears to have longer T1
than does cord gray matter.
Conclusion
The central gray matter of the spinal cord is best seen on
proton-density and T2-weighted gradient-echo axial or
sagit-tal images when a 256
x
256 matrix is used. The gray mattermay also be seen on T1-or T2-weighted spin-echo images if
long acquisition times are attained. When using a 128
x
256matrix, truncation artifacts produce distortion of the central
gray matter in axial and sagittal images. Truncation artifacts
in the cord are seen best on sagittal images, where they may
be mistaken for syringohydromyelia. Therefore, a 256
x
256matrix is recommended in cervical spine MR imaging. The ability to recognize the central gray matter and adjacent white matter with MR should prove helpful in diagnosing cervical cord disease.
REFERENCES
1. Wood ML, Henkelman RM. Truncation artifacts in magnetic resonance
imaging. Magn Reson Med 1985;2:517-526
2. Lufkin RB, Pusey E, Stark DD, Brown R, Leikind B, Hanafee WN. Boundary artifacts due to truncation errors in MR imaging. AJR 1986;147: 1283
-1287
3. Bellon EM, Haacke EM, Coleman PE, Sacco DC, Steiger DA, Gangarosa RE. MR artifacts: a review. AJR 1986;147:1271-1281
4. Rubin JB, Enzmann DR. Harmonic modulation of proton MR precessional phase by pulsatile motion: origin of spinal CSF flow phenomenon. AJNR 1987;8:307-318
5. Modic MT, Weinstein MA, Pavlicek W, et al. Nuclear magnetic resonance
imaging of the spine. Radiology 1983;148:757-762
6. Modic MT, Weinstein MA, Pavlicek W, et al. Magnetic resonance imaging of the cervical spine: technical and clinical observations. AJNR 1984;5:
15-22
7. Norman D, Mills CM, Brant-Zawadzki M, Yeates A, Crooks LE, Kaufman L. Magnetic resonance imaging of the spinal cord and canal: potentials
and limitations. AJR 1983;141 :1147-1152, AJNR 1984;5:9-14
8. Rauschning W, Bergstrom K, Pech P. Correlative craniospinal anatomy
studies by computed tomography and cryomicrotomy. J Comput Assist Tomogr 1983;7:9-13
9. Schenck JF, Hart HR, Foster TH, Edelstein WA, Hussain MA. High reso-lution magnetic resonance imaging using surface coils. In: Kressel HY, ed.
Magnetic resonance annual. New York: Raven Press, 1986:151-152 10. Hendrick RE, Kneeland JB, Stark BB. Maximizing signal-ta-noise and
contrast-ta-noise ratios in FLASH imaging. Magn Reson Imaging 1987;5:117-127
11. Niewenhuys R, Voogd J, Huijzen C. The human central nervous system. A synopsis and atlas, 2nd rev ed. New York: Springer-Verlag, 1981: