Sensitivity and Interrater Agreement of
CT and Diffusion-Weighted MR Imaging in
Hyperacute Stroke
Dorothee Saur, Thomas Kucinski, Ulrich Grzyska, Bernd Eckert, Christian Eggers, Wolf Niesen, Volker Schoder, Hermann Zeumer, Cornelius Weiller, and Joachim Ro¨ther
BACKGROUND AND PURPOSE: Previous acute stroke studies found diffusion-weighted (DW) imaging superior to CT for detection of early ischemic signs (EIS). However, these findings were confounded by a large time interval in favor of DW imaging. We compared DW images and CT scans obtained with a short time delay in patients with acute stroke to define the sensitivity and interrater agreement of both imaging techniques.
METHODS:CT scans and DW images were obtained within 6 hours of symptom onset in 46 patients with acute stroke. Three neuroradiologists and three neurologists reviewed the images for EIS in five regions of the middle cerebral artery (MCA) territory and estimated the extent of EIS (< or > one-third of the MCA territory).
RESULTS:The mean delay between imaging with both modalities was 24.5 minutes (range, 10 – 41 minutes). Forty-five of 46 patients had an ischemic stroke. EIS were seen on 33 of 45 CT scans (73% sensitivity; 95% confidence interval [CI]: 58 – 85%) and on 42 of 45 DW images (93% sensitivity; 94% CI: 82–99%). Interrater agreement was moderate ( ⴝ 0.57) for CT and excellent ( ⴝ 0.85) for DW imaging. CT studies had a moderate interrater agreement for estimation of EIS greater than one-third of the MCA territory ( ⴝ0.40), whereas DW imaging showed good results ( ⴝ0.68). Sensitivity for detection of greater than one-third of the MCA territory was equally poor (57%, 95% CI: 29 – 82%) for both CT and DW imaging.
CONCLUSION:DW imaging helped identify EIS with higher sensitivity than that of CT. The interrater variability of the one-third rule was high for CT, and thus the clinical applicability of CT is limited. Our results support the application of stroke MR imaging for the treatment of patients with acute stroke.
Diffusion-weighted (DW) and perfusion-weighted imaging examinations are becoming the diagnostic standard for stroke management in academic stroke centers (1, 2). The combination of DW imaging, per-fusion-weighted imaging, and MR angiography en-ables identification of tissue at risk of infarction, which is characterized by the mismatch between an area of restricted diffusion and a larger area with ischemic but still viable tissue on perfusion-weighted images (3, 4). Thus, stroke MR imaging is an imaging
technique that enables identification of ischemic but potentially salvageable tissue in the acute phase. CT, however, is still an established technique because of its accessibility, and, in principle, CT in combination with CT angiography and CT perfusion is able to define tissue at risk of infarction (5, 6).
Early ischemic signs (EIS) on CT scans are well-established subtle changes associated with early cere-bral ischemia within 6 hours of stroke onset (7–9). A widely accepted practice is to exclude those patients from thromobolysis if the extent of EIS exceeds one-third of the middle cerebral artery (MCA) territory, as estimated with CT, because of increased risk of hemorrhage (10–12). This practice is in conflict with a recent study showing that EIS at CT do not predict response to tissue-type plasminogen activator (t-PA) treatment (13).
Earlier studies reported a superiority of DW imag-ing for the identification of EIS (14–17). However, these studies were confounded by the fact that the time interval between symptom onset and time of Received August 6, 2002; accepted after revision November 22 .
From the Departments of Neurology (D.S., C.E., W.N., C.W., J.R.) and Neuroradiology (T.K., U.G., B.E., H.Z.) and the Institute for Mathematics and Data Science in Medicine (V.S.), University Hospital Hamburg-Eppendorf, Germany.
Presented at the 11th European Stroke Conference, Geneva, May 22 to June 1, 2002.
Address reprint requests to Dorothee Saur, MD, University Hospital Hamburg-Eppendorf, Department of Neurology, Martin-istr. 52, 20246 Hamburg, Germany.
©American Society of Neuroradiology
imaging was substantially shorter for CT than for DW imaging, with a long time delay between both modalities.
We compared CT scans and DW images, obtained with a negligible time delay, to assess the sensitivity and interrater agreement for EIS. In this retrospec-tive study, three neuroradiologists and three neurol-ogists blinded and unblinded to clinical information reviewed the images of patients with hyperacute stroke for EIS in five different regions. The extent of EIS was estimated by using the one-third rule (ie, less than or greater than one-third of the MCA territory). The ratings of neuroradiologists and neurologists were compared to determine the influence of expert knowledge on the detection rate of EIS. Finally, the imaging findings were interpreted, taking vessel status on MR or CT angiograms into account.
Methods
Patients
Within a period of 16 months (January 2000–April 2001), 92 patients were imaged with CT and DW imaging within 6 hours of stroke onset. From this cohort, we included the images of 46 patients (15 women, 31 men; mean age, 62.8 years; age range, 35–89 years) for whom imaging with both modalities had been performed with a time interval of less than 45 minutes. The National Institutes of Health Stroke Scale (NIHSS) score (18) was assessed on admission or was retrospectively determined from the neurology records. The final diagnosis of stroke was made by clinical definition and by follow-up MR imaging or CT 1–12 days after the stroke, as described below.
Imaging Techniques and Follow-up
All CT scans were obtained in single-section mode with a thin-section CT scanner (Somatom Plus 4; Siemens Medical Systems, Erlangen, Germany). Since image noise and subse-quent discrimination of CT density resolution depend on the detected photon count (19), tube current was adjusted to 600 mAs for 2-mm (thickness) sections infratentorially and 480 mAs for 6-mm sections supratentorially (field of view, 210⫻ 210 mm; matrix size, 512⫻512). To avoid unnecessary radia-tion exposure in routine CT scanning, these parameters were only used in patients suspected to have hyperacute stroke. Considering a previously suggested narrow window width (20), image analysis was performed on hard copies with a reduced, but standardized, window setting: for 2-mm sections, 30/80 HU (center/width) and 6-mm sections 35/50 HU, respectively. A soft image reconstruction algorithm was applied to further reduce image noise.
MR images were acquired with a 1.5-T unit (Magnetom Symphony; Siemens Medical Systems), equipped with a 20-mT/m gradient system. DW imaging was performed with a spin-echo echo-planar imaging sequence (4800/105.2 [TR/TE]; section thickness, 6 mm with 0.6-mm gap; field of view, 240⫻ 240 mm; and matrix size, 256⫻256). Twenty isotropic recon-structions were acquired with b values of 0, 500, and 1000 s/mm, respectively.
Follow-up imaging 1–12 days after stroke included CT (n⫽ 4), MR imaging with a fluid-attenuated inversion-recovery (FLAIR) sequence (n⫽23), or T2-weighted MR imaging in combination with proton density–weighted MR imaging or DW imaging (n⫽19). Vessel status was examined with time-of-flight MR angiography (n⫽43) or CT angiography (n⫽3).
Rating
Three neuroradiologists (T.K., U.G., B.E.) and three neu-rologists (J.R., C.E., W.N.) independently reviewed the CT scans and DW images. Rating was performed in four sessions. In the first two sessions, CT scans were presented first without and on a second run with brief clinical information. In the third and fourth session, the DW images were judged in the same way as the CT scans but in a different order. The raters were unaware of the number of patients with an ischemic stroke. To compute intrarater reliability, 10 randomly selected images were presented twice.
To assess the evidence of EIS, we used a modified question-naire that was based on the Alteplase Thrombolysis for Acute Noninterventional Therapy in Ischemic Stroke, or ATLANTIS, study form (21). EIS included parenchymal hypoattenuation and cerebral edema and were analyzed in five different regions (frontal, parietal, temporal, insular ribbon, and basal ganglia). Parenchymal hypoattenuation was defined as increased radi-oluceny of cerebral tissue relative to other parts of the affected structure or to its contralateral counterpart. Cerebral edema was defined as a circumscribed effacement of cortical sulci, compression of ventricles, and shift of midline structures (12). The extent of EIS (⬍or⬎one-third of the MCA territory) was estimated on CT and DW images relative to the anticipated size of the entire MCA territory. In addition, the presence of a hyperattenuating MCA sign was determined on CT scans. By using a conventional definition, this sign was defined as the part of the MCA that showed higher attenuation than other parts of the vessel or any other visualized vessel of similar size in which attenuation could not be attributed to calcification (22). The DW images were examined for evidence of parenchymal hy-perintensity by using the same rules as for EIS on the CT scans. As the final step, two authors (T.K., J.R.) analyzed the follow-up images to verify the site and extent of the lesion (hereinafter called “final rating”).
Data Evaluation
Two conditions were required for an image to be considered positive. First, four of the six raters had to agree on the presence of EIS (hereinafter called “consensus rating”). In a separate analysis, accounting for differences in the ratings of neuroradiologists and neurologists, an image was rated positive whenever two of the three raters of each group agreed (here-inafter called “consensus rating of neuroradiologists and neu-rologists”). Second, at least one of the regions identified by the raters had to match the infarct location of the final rating.
Statistics
[image:2.603.307.534.606.726.2]Sensitivity was calculated for CT and DW imaging by using exact 95% confidence intervals (CIs) (23). For assessing the interrater agreement, we usedstatistics for multiple raters
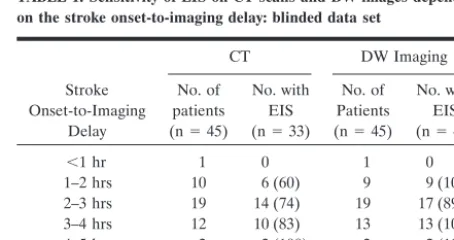
TABLE 1: Sensitivity of EIS on CT scans and DW images depending on the stroke onset-to-imaging delay: blinded data set
Stroke Onset-to-Imaging
Delay
CT DW Imaging
No. of patients (n⫽45)
No. with EIS (n⫽33)
No. of Patients (n⫽45)
No. with EIS (n⫽42)
⬍1 hr 1 0 1 0
1–2 hrs 10 6 (60) 9 9 (100)
2–3 hrs 19 14 (74) 19 17 (89) 3–4 hrs 12 10 (83) 13 13 (100)
4–5 hrs 2 2 (100) 2 2 (100)
5–6 hrs 1 1 (100) 1 1 (100)
(24); for assessing intrarater variability we calculated the mean paired values of all raters. We defined ⫽0.41–0.60 as moderate agreement; ⫽ 0.61–0.80, good agreement; ⬍ 0.40, poor agreement; and⬎0.80, excellent agreement (25). Asymptotic confidence limits forvalues are given as@2
standard errors. For continuous data, we used paired- and two-tailed t tests. For paired categorical data, we used the McNemar test, and for unpaired categorical data, the Fisher’s exact test. All calculatedPvalues are interpreted as descriptive measures in the sense of an explorative data analysis.
Results
The mean delay between obtaining images with both modalities was 24.5 minutes (range, 10 – 41 minutes). DW imaging was performed before CT in 12 patients. The mean time interval between symp-tom onset and imaging was 158 minutes (range, 50– 305 minutes) for CT and 166 minutes (range, 23–319 minutes) for DW imaging (P ⫽ .06, paired t test, two-tailed). Thirty scans were obtained in the first 3 hours after stroke onset (Table 1). Follow-up imaging took place after a mean delay of 5.2 days (range, 1–12 days). The mean NIHSS score at admission was 13.3 (range, 3–23).
A final diagnosis of stroke was made in 45 of the 46 patients on the basis of follow-up imaging results and clinical definition. The remaining patient had a diffu-sion-negative transient ischemic attack with an exten-sive perfusion slowing and spontaneous recanaliza-tion without infarcrecanaliza-tion on follow-up MR images after
6 days. Two of the 45 patients showed lacunar infarc-tions. All other patients displayed embolic infarction. Vessel status examined with MR and CT angiography is shown in Table 2.
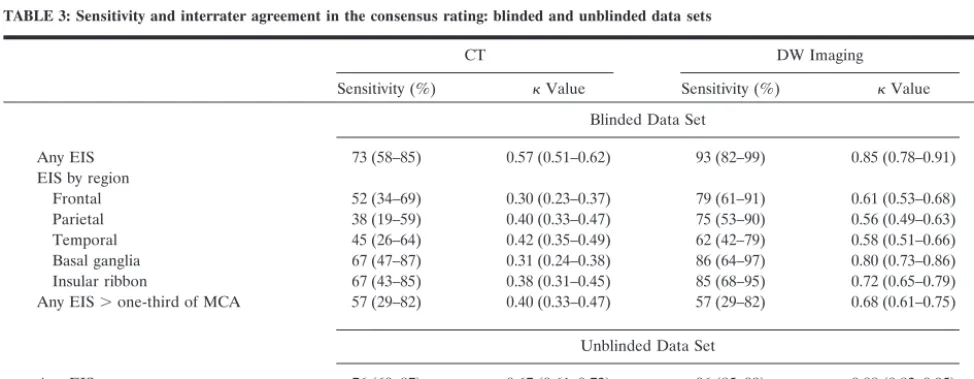
Table 3 summarizes the blinded data of the con-sensus rating. Unblinding to clinical information did not significantly affect the results (Table 3; McNemar
P .99 for CT and DW imaging). Patients with intra-cerebral abnormality other than suspected stroke usu-ally are not studied with DW imaging in our emer-gency setting; therefore, we cannot comment on the specificity of both methods. Overall, consensus on the presence of EIS on CT scans was achieved in 33 of 45 patients (sensitivity, 73%), with a moderatevalue of 0.57. With DW imaging, consensus on the presence of parenchymal hyperintensity was present in 42 of 45 patients (sensitivity, 93%; McNemarP⫽.02) with an excellentvalue of 0.85. Generally, the hyperintense ischemic lesions on DW images were visually more distinct and easier to identify than the EIS on CT scans (Figs 1 and 2), resulting in overall better
values.
When the five regions were considered separately, sensitivity was higher for DW imaging than for CT studies, similar to the overall EIS rating. For both modalities, sensitivity was highest for the basal gan-glia and the insular ribbon.
[image:3.603.55.534.71.163.2]The intrarater agreement of each rater was ⫽ 1 for detection of any EIS with CT and DW imaging,
TABLE 2: Sensitivity of hyperattenuating MCA sign and EIS depending on vessel occlusion: blinded data set
Site of Occlusion
Hyperattenuating
MCA Sign EIS on CT Scan
EIS on DW Image
ICA with MCA embolization (n⫽5) 3 (60) 4 (80) 4 (80)
ICA bifurcation (n⫽6) 5 (83) 6 (100) 6 (100)
MCA trunk (n⫽12) 10 (83) 11 (92) 12 (100)
MCA trifurcation (n⫽3) 0 2 (67) 3 (100)
MCA branch (n⫽17) 4 (24) 10 (59) 16 (94)
No verified occlusion (n⫽2) 0 0 1 (50)
Note.—Data are number of patients. Numbers in parentheses are percentages.
TABLE 3: Sensitivity and interrater agreement in the consensus rating: blinded and unblinded data sets
CT DW Imaging
Sensitivity (%) Value Sensitivity (%) Value Blinded Data Set
Any EIS 73 (58–85) 0.57 (0.51–0.62) 93 (82–99) 0.85 (0.78–0.91)
EIS by region
Frontal 52 (34–69) 0.30 (0.23–0.37) 79 (61–91) 0.61 (0.53–0.68)
Parietal 38 (19–59) 0.40 (0.33–0.47) 75 (53–90) 0.56 (0.49–0.63) Temporal 45 (26–64) 0.42 (0.35–0.49) 62 (42–79) 0.58 (0.51–0.66) Basal ganglia 67 (47–87) 0.31 (0.24–0.38) 86 (64–97) 0.80 (0.73–0.86) Insular ribbon 67 (43–85) 0.38 (0.31–0.45) 85 (68–95) 0.72 (0.65–0.79) Any EIS⬎one-third of MCA 57 (29–82) 0.40 (0.33–0.47) 57 (29–82) 0.68 (0.61–0.75)
Unblinded Data Set
Any EIS 76 (60–87) 0.67 (0.61–0.72) 96 (85–99) 0.88 (0.82–0.95)
Any EIS⬎one-third of MCA 57 (29–82) 0.53 (0.46–0.61) 57 (29–82) 0.68 (0.61–0.75)
[image:3.603.54.541.537.726.2]meaning that no rater changed decision when the same image was presented the second time. For the different regions, intrarater agreement was lower, ranging from 0.67 to 0.90.
The final rating identified 14 patients with lesions exceeding one-third of the MCA territory (major in-farction). In the consensus rating of CT and DW imaging, eight of these 14 patients were identified, resulting in a sensitivity of 57% for both methods, with a poorvalue of 0.40 for CT and a goodvalue of 0.68 for DW imaging.
The hyperattenuating MCA sign was seen on CT scans in 22 patients (44%), with a poorvalue of 0.29 (95% CI: 0.33–0.47). Five of six patients with evi-dence of occlusion of the internal carotid artery (ICA) bifurcation and 10 of 12 patients with occlusion of the MCA trunk on MR angiograms showed the hyperattenuating MCA sign in the consensus rating (Table 2).
Table 4 summarizes the results of the consensus rating of neuroradiologists and neurologists. Neuro-radiologists detected EIS on CT scans in 39 of 45
patients, yielding a sensitivity of 87%. Neurologists recognized EIS in 33 of 45 patients, resulting in a sensitivity of 73% (McNemarP⫽.04). The detection rate of parenchymal hyperintensity on DW images was 44 of 45 patients for neuroradiologists (sensitiv-ity, 98%) and 42 of 45 patients for neurologists (sen-sitivity, 93%; McNemarP⫽.3). The interrater agree-ment for detection of major ischemia on CT scans was poor in the group of neuroradiologists ( ⫽ 0.17) compared with moderate ( ⫽ 0.47) in the group of neurologists.
Finally, we examined the relationship of imaging findings, vessel status, time intervals, and NIHSS score. In patients with occlusion of the ICA bifurca-tion and MCA trunk occlusion, the sensitivity for detection of EIS increased to 100% for both modal-ities (Table 2).
The mean time interval between symptom onset and imaging was 166.3 minutes (range, 80–305 min-utes) for patients with EIS on CT scans and 140.5 minutes (range 50–237 minutes) for patients with normal CT scans (two-samplet test, two-tailed,P ⫽
[image:4.603.56.535.59.417.2].067). In a separate analysis of scans obtained in the first 3 hours, EIS were seen on 20 of 30 CT scans (sensitivity, 66.7%) compared with 13 of 15 CT scans obtained after 3 hours (sensitivity, 86.7%; Fisher’s exact test, two-tailed,P⫽.283). In contrast, detection of hyperintensity on DW images in the first 3 hours occurred in 26 of 29 patients (sensitivity, 90%). The interrater agreement in the first 3 hours decreased to
⫽0.36 (95% CI: 0.29–0.44) for CT, whereas inter-rater agreement for DW imaging remained un-changed (⫽ 0.69; 95% CI: 0.39–0.99).
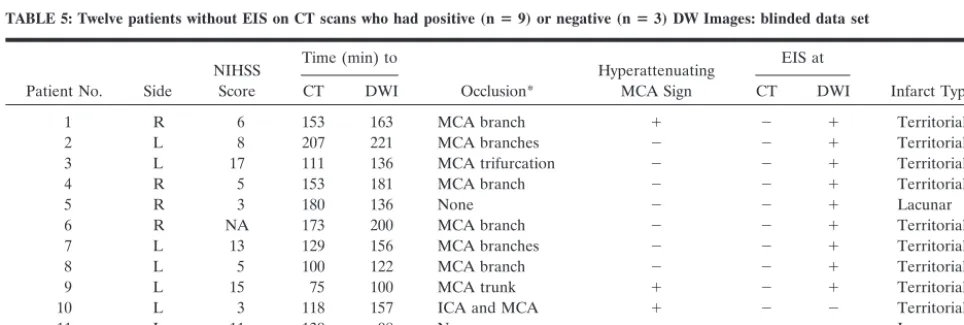
The mean acute NIHSS score was 15.3 (range, 4–23) in patients with EIS on CT scans compared with 8.2 (range, 3–17) in patients without EIS on CT scans (two-samplettest, two-tailed,P⫽.0053). Table 5 shows the data for the 12 patients without EIS on CT scans and the three patients with normal findings on both CT scans and DW images in the consensus rating.
Discussion
Previous studies of CT and DW imaging reported a higher sensitivity for DW imaging for the detection of acute ischemia (14–17). These studies were criticized
because the time delay between symptom onset and imaging was favorable for DW imaging. We therefore acquired images with both modalities within a narrow time window and nevertheless found DW imaging superior to CT for the diagnosis of stroke within the first 6 hours after symptom onset. In our study, sen-sitivity for detection of EIS was 73% for CT and 93% for DW imaging. Previous studies within 6 hours reported sensitivities for detection of EIS ranging from 41% to 92% for CT (7, 10, 14–17, 26–30), whereas the values for DW imaging were consistently above 90% (3, 14, 16, 17, 31, 32). Because of the subtle character of EIS on CT scans, we found a moderate interrater agreement of 0.57 for CT in com-parison to excellent agreement of 0.85 for DW imag-ing. The fact that unblinding to clinical information did not significantly affect the results should not be misinterpreted as implying that clinical data are not important in interpreting CT scans. In our study, the raters were aware of the global suspicion for stroke and, therefore, were attentive to subtle findings on CT scans that may have otherwise been overlooked (33).
greater than one-third of MCA territory. But it should be noted that this computation is flawed, be-cause the infarcts may have progressed and the “true” size of the ischemic lesion at the time of initial CT and MR imaging cannot be known with certainty.
The higher sensitivity of DW imaging is due to the different temporal evolution of EIS on CT scans and signal intensity changes on DW images. Whereas EIS on CT scans are due to a net water uptake in ischemic brain tissue (34), DW imaging is sensitive to extracel-lular to intracelextracel-lular water shifts that occur with isch-emic cell depolarization (35–37). Kucinski et al (38) reported a mean water content of the brain of 77.5% with a 1.5-HU decrease per percentage water in-crease. Their recent comparison between CT and the apparent diffusion coefficient (ADC) revealed a de-crease of only 1.3 HU at 2.5 hours after symptom onset in regions with diffusion restriction (38), ex-plaining well the subtle character of EIS on CT scans. In addition, they showed that the ADC decrease was not time dependent: about 1.5 hours after symptom onset, the ADC decrease was almost complete and showed no substantial further decrease. In contrast, the noticeable decrease of the CT attenuation started later than the ADC decrease and progressed linearly over time.
These findings are in line with our results of in-creasing detection rates for EIS with CT at later time points after symptom onset, whereas the sensitivity of DW imaging was time independent (Table 1).
The temporal development of EIS on CT scans and DW imaging signal intensity changes depends strongly on the severity of the ischemia. Occlusion of the ICA bifurcation and MCA trunk occlusions result in severe focal ischemia mainly in the basal ganglia where perforators are not collateralized. Accordingly, we found the highest rates of EIS on CT scans in patients with ICA bifurcation and MCA trunk occlu-sions, and the basal ganglia and insular ribbon showed the highest sensitivity of all investigated areas (Table 3). This is in line with earlier reports, in pa-tients with MCA trunk occlusion, of CT sensitivities that ranged from 81% to 100% (7, 26, 27, 39) and explains anecdotal reports of EIS as early as 22 min-utes after symptom onset (40). In general, our rela-tively high CT detection rate for EIS, compared with that of other studies (15, 16, 41), is due to our specific patient population, which mostly consisted of patients with large-vessel embolic occlusions.
Apart from duration and severity of ischemia, the sensitivity of CT depends on the size, location, and type of infarct. Small volumes (eg, lacunar infarctions as well as lesions close to the skull base where beam-hardening artifacts impair lesion recognition) often remain unrecognized on CT scans. Also, ischemia confined to the white matter often results in a normal CT study because the increase in net water is almost exclusively visible in gray matter at early time points (40). In our study, two patients with lacunar
infarc-TABLE 4: Sensitivity and interrater agreement for three neuroradiologists and three neurologists separately: blinded data set
Neuroradiologists Neurologists
CT DW Imaging CT DW Imaging
Sensitivity (%)
Any EIS 87 (73–95) 98 (88–100) 73 (58–85) 93 (82–99)
Any EIS⬎one-third of MCA 57 (29–82) 57 (29–82) 57 (29–82) 57 (29–82) Interrater agreement (value)
Any EIS 0.65 (0.59–0.70) 0.84 (0.78–0.90) 0.60 (0.55–0.65) 0.88 (0.82–0.93) Any EIS⬎one-third of MCA 0.17 (0.10–0.24) 0.63 (0.56–0.70) 0.47 (0.40–0.54) 0.70 (0.62–0.77)
[image:6.603.53.534.70.169.2]Note.—Numbers in parentheses are 95% CIs.
TABLE 5: Twelve patients without EIS on CT scans who had positive (nⴝ9) or negative (nⴝ3) DW Images: blinded data set
Patient No. Side
NIHSS Score
Time (min) to
Occlusion*
Hyperattenuating MCA Sign
EIS at
Infarct Type
CT DWI CT DWI
1 R 6 153 163 MCA branch ⫹ ⫺ ⫹ Territorial
2 L 8 207 221 MCA branches ⫺ ⫺ ⫹ Territorial
3 L 17 111 136 MCA trifurcation ⫺ ⫺ ⫹ Territorial
4 R 5 153 181 MCA branch ⫺ ⫺ ⫹ Territorial
5 R 3 180 136 None ⫺ ⫺ ⫹ Lacunar
6 R NA 173 200 MCA branch ⫺ ⫺ ⫹ Territorial
7 L 13 129 156 MCA branches ⫺ ⫺ ⫹ Territorial
8 L 5 100 122 MCA branch ⫺ ⫺ ⫹ Territorial
9 L 15 75 100 MCA trunk ⫹ ⫺ ⫹ Territorial
10 L 3 118 157 ICA and MCA ⫹ ⫺ ⫺ Territorial
11 L 11 139 98 None ⫺ ⫺ ⫺ Lacunar
12 R 4 50 23 MCA branch ⫺ ⫺ ⫺ Territorial
[image:6.603.53.535.554.716.2]tions had a normal CT study, whereas DW imaging revealed the lacunar infarction in one case.
Diffusion-negative stroke studies have been re-ported previously (42–44). In our study, three DW images were rated negative in the consensus rating although follow-up imaging confirmed the final diag-nosis of stroke. None of these cases showed evidence of EIS on CT scans. One patient with ICA occlusion on MR angiograms showed a good collateral blood supply via the anterior communicating artery and leptomeningeal collateral vessels. It is likely that the hypoperfusion detected on perfusion-weighted im-ages 2.5 hours after symptom onset was still above the threshold causing cytotoxic edema (44). Another pa-tient with diffusion-negative stroke was studied as early as 23 minutes after symptom onset. Follow-up imaging after 8 days revealed an infarction of the right insular ribbon due to MCA branch occlusion. The third patient without a vessel occlusion revealed a lacunar infarction of the left basal ganglia on fol-low-up images. Except for these controversial cases, hyperintense ischemic lesions on DW images were easy to identify compared with the subtle character of EIS on CT scans, resulting in an overall better inter-rater agreement for DW imaging.
In line with results of previous studies, we found the sensitivity of the hyperattenuating MCA sign at CT inferior to MR angiography (14, 27). One ICA bifurcation occlusion and two MCA stem occlusions identified on MR angiograms did not show the hy-perattenuating MCA sign on CT scans. In addition, the low interrater agreement indicates that hyperat-tenuating MCA on CT scans is not a reliable predic-tor of MCA occlusion.
Our study presents data on the low sensitivity of CT for the detection of EIS; however, the consequences of our findings for acute stroke management need further discussion. Conflicting data exist regarding the clinical relevance of EIS as a predictor of respon-siveness to thrombolytic therapy. Several studies and guidelines on thrombolytic therapy found EIS involv-ing greater than one-third of the MCA territory as-sociated with increased risk of symptomatic intrace-rebral hemorrhage (ICH) and worse outcome, suggesting that thrombolysis should not be performed in such patients (11, 12, 45). In contrast, Patel et al (13) in a recently published post hoc analysis of the National Institute of Neurological Disorders and Stroke data postulated that EIS in the first 3 hours after symptom onset are not independently associated with increased risk of adverse outcome after t-PA treatment. The Standard Treatment with Alteplase to Reverse Stroke, or STARS, study, the largest pro-spective postapproval trial with t-PA treatment in the first 3 hours, reported a low symptomatic ICH rate with 3.3%, even though no CT exclusion criteria were used (46).
In line with results of previous studies (17, 47), only DW imaging provided reliable information about the extent of the lesion, with good interrater agreement, as opposed to only moderate agreement for CT in the first 6 hours and the even poorer agreement in the
first 3 hours after symptom onset. We therefore con-clude that only DW imaging allows reliable determi-nation of the extent of infarction in the early stage of stroke. The CT one-third rule of the MCA territory is not reliable in the first 3 hours (48). Therefore, ther-apeutic conclusions should only be drawn if EIS ex-ceeded one-third of the MCA territory unequivocally. This conclusion is strengthened by the result that three neuroradiologists, who achieved an exception-ally high sensitivity of 87% for rating EIS on CT scans, did not agree on the extent of these EIS and achieved only a very poor eˆ value of 0.17 in this category. However, it should be emphasized that the cutoff value of DW imaging lesion extension predict-ing hemorrhage after thrombolysis is still unknown and will have to be evaluated in prospective large-scale studies, which have never been performed with CT to establish the one-third rule.
Conclusion
DW imaging enabled identification of early infarc-tion with higher sensitivity and interrater agreement than those of CT. Although neuroradiologists identi-fied EIS on CT cans with a high sensitivity and good interrater agreement, the extent of EIS was not reli-ably rated. Therefore, within the 3-hour window, the one-third rule in CT is not a reliable exclusion crite-rion for thrombolysis. We believe that the combina-tion of DW imaging, perfusion-weighted imaging, and MR angiography will continue to develop toward the diagnostic standard in stroke centers since the reli-able detection of early ischemia with DW imaging is supplemented by information about the perfusion deficit and the vessel status, thereby allowing the determination of tissue at risk for infarction, the tar-get of thrombolysis.
References
1. Ro¨ther J.CT and MRI in the diagnosis of acute stroke and their role in thrombolysis.Thromb Res2001;103(suppl 1):125–133 2. Schellinger PD, Fiebach JB, Jansen O, et al. Stroke magnetic
resonance imaging within 6 hours after onset of hyperacute cere-bral ischemia.Ann Neurol2001;49:460–469
3. Warach S, Dashe JF, Edelman RR.Clinical outcome in ischemic stroke predicted by early diffusion-weighted and perfusion mag-netic resonance imaging: a preliminary analysis.J Cereb Blood Flow Metab1995;16:53–59
4. Sorensen AG, Buonanno FS, Gonzalez RG, et al.Hyperacute stroke: evaluation with combined multisection diffusion-weighted and hemodynamically weighted echo-planar MR imaging. Radiol-ogy1996;199:391–401
5. Koenig M, Klotz E, Luka B, et al.Perfusion CT of the brain: diagnostic approach for early detection of ischemic stroke. Radiol-ogy1998;209:85–93
6. Ro¨ther J, Jonetz-Mentzel L, Fiala A, et al.Hemodynamic assess-ment of acute stroke using dynamic single-slice computed tomo-graphic perfusion imaging.Arch Neurol2000;57:1161–1166 7. Tomura N, Uemura K, Inugami A, et al.Early CT finding in
cerebral infarction: obscuration of the lentiform nucleus.Radiology
1988;168:463–467
8. Truwit CL, Barkovich AJ, Gean-Marton A.Loss of the insular ribbon: another early CT sign of acute middle cerebral artery infarction.Radiology1990;176:801–806
9. von Kummer R, Nolte PN, Schnittger H, et al.Detectability of cerebral hemisphere ischaemic infarcts by CT within 6 h of stroke.
10. Hacke W, Kast M, Fieschi C, et al.Intravenous thrombolysis with recombinant tissue plasminogen activator for acute hemispheric stroke. The European Cooperative Acute Stroke Study (ECASS).
JAMA1995;274:1017–1025
11. Practice advisory: thrombolytic therapy for acute ischemic stroke—summary statement. Report of the Quality Standards Sub-committee of the American Academy of Neurology.Neurology1996; 47:835–839
12. von Kummer R, Allen KL, Holle R, et al.Acute stroke: usefulness of early CT findings before thrombolytic therapy.Radiology1997; 205:327–333
13. Patel SC, Levine SR, Tilley BC, et al.Lack of clinical significance of early ischemic changes on computed tomography in acute stroke.
JAMA2001;286:2830–2838
14. Barber PA, Darby DG, Desmond PM, et al.Identification of major ischemic change: diffusion-weighted imaging versus computed to-mography.Stroke1999;30:2059–2065
15. Lansberg MG, Albers GW, Beaulieu C, et al. Comparison of diffusion-weighted MRI and CT in acute stroke.Neurology2000; 54:1557–1561
16. Urbach H, Flacke S, Keller E, et al.Detectability and detection rate of acute cerebral hemisphere infarcts on CT and diffusion-weighted MRI.Neuroradiology2000;42:722–727
17. Fiebach J, Jansen O, Schellinger P, et al.Comparison of CT with diffusion-weighted MRI in patients with hyperacute stroke. Neuro-radiology2001;43:628–632
18. Bushnell CD, Johnston DC, Goldstein LB.Retrospective assess-ment of initial stroke severity: comparison of the NIH Stroke Scale and the Canadian Neurological Scale.Stroke2001;32:656–660 19. Ommaya AK, Murray G, Ambrose J, et al.Computerized axial
tomography: estimation of spatial and density resolution capabil-ity.Br J Radiol1976;49:604–611
20. Lev MH, Farkas J, Gemmete JJ, et al.Acute stroke: improved nonenhanced CT detection— benefits of soft-copy interpretation by using variable window width and center level settings.Radiology
1999;213:150–155
21. Clark WM, Albers GW, Madden KP, et al.The rtPA (Alteplase) 0-to 6-hour acute stroke trial, part A (A0276g): results of a double-blind, placebo-controlled, multicenter study.Stroke 2000;31:811– 816
22. Gacs G, Fox AJ, Barnett HJ, et al.CT visualization of intracranial arterial thromboembolism.Stroke1983;14:756–762
23. Geigy JR BS.Documenta Geigy—Scientific Tables33rd ed. Basel Switzerland; 1968
24. Fleiss JL.Measuring nominal scale agreement among many raters.
Psychol Bull1971;76:378–382
25. Altman DG. In:Practical Statistics for Medical Research. 1st ed. London, UK: Chapman & Hall; 1991:104
26. Horowitz SH, Zito JL, Donnarumma R.Computed tomographic-angiographic findings within the first five hours of cerebral infarc-tion.Stroke1991;22:1245–1253
27. von Kummer R, Meyding-Lamade U, Forsting M, et al.Sensitivity and prognostic value of early CT in occlusion of the middle cere-bral artery trunk.AJNR Am J Neuroradiol1994;15:9–15 28. Moulin T, Cattin F, Crepin-Leblond T, et al.Early CT signs in
acute middle cerebral artery infarction: predictive value for subse-quent infarct locations and outcome.Neurology1996;47:366–375 29. Bozzao L, Bastianello S, Fantozzi LM, et al.Correlation of
angio-graphic and sequential CT findings in patients with evolving cere-bral infarction.AJNR Am J Neuroradiol1989;10:1215–1222 30. Mohr JP, Biller J, Hilal SK, et al. Magnetic resonance and
co-mouted tomographic imaging in acute stroke.Stroke1995;26:807– 812
31. Lovblad KO, Laubach HJ, Baird AE, et al.Clinical experience with diffusion-weighted MR in patients with acute stroke.AJNR Am J Neuroradiol1998;19:1061–1066
32. Gonzalez RG, Schaefer PW, Buonanno FS, et al. Diffusion-weighted MR imaging: diagnostic accuracy in patients imaged within 6 hours of stroke symptom onset.Radiology1999;210:155– 162
33. Mullins ME, Lev MH, Schellingerhout D, et al.Influence of avail-ability of clinical history on detection of early stroke using unen-hanced CT and diffusion-weighted MR imaging.AJR Am J Roent-genol2002;179:223–228
34. Schuier FJ, Hossmann KA.Experimental brain infarcts in cats, II: ischemic brain edema.Stroke1980;11:593–601
35. Ro¨ther J, de Crespigny AJ, D’Arceuil H, et al.MR detection of cortical spreading depression immediately after focal ischemia in the rat.J Cereb Blood Flow Metab1996;16:214–220
36. Davis D, Ulatowski J, Eleff S, et al.Rapid monitoring of changes in water diffusion coefficients during reversible ischemia in cat and rat brain.Magn Reson Med1994;31:454–460
37. de Crespigny AJ, Rother J, Beaulieu C, et al. Comparison of diffusion, blood oxygenation, and blood volume changes during global ischemia in rats.Magn Reson Med2001;45:10–16 38. Kucinski T, Vaeterlein O, Glauche V, et al.Correlation of ADC and
CT density in acute ischemic stroke.Stroke2002;33:1786–1791 39. Bozzao L, Bastianello J, Fantozzi LM, et al.Correlation of
angio-graphic and sequential CT findings in patients with evolving cere-bral infarction.AJNR Am J Neuroradiol1989;10:1215–1222 40. von Kummer R, Bourquain H, Bastianello S, et al.Early prediction
of irreversible brain damage after ischemic stroke at CT.Radiology
2001;219:95–100
41. Mullins ME, Schaefer PW, Sorensen AG, et al.CT and conven-tional and diffusion-weighted MR imaging in acute stroke: study in 691 patients at presentation to the emergency department. Radiol-ogy2002;224:353–360
42. Neumann-Haefelin T, Wittsack HJ, Wenserski F, et al. Diffusion-and perfusion-weighted MRI in a patient with a prolonged revers-ible ischaemic neurological deficit.Neuroradiology 2000;42:444– 447
43. Neumann-Haefelin T, Kastrup A, de Crespigny A, et al.Serial MRI after transient focal cerebral ischemia in rats: dynamics of tissue injury, blood-brain barrier damage, and edema formation.Stroke
2000;31:1965–1972
44. Lefkowitz D, LaBenz M, Nudo SR, et al. Hyperacute ischemic stroke missed by diffusion-weighted imaging.AJNR Am J Neuro-radiol1999;20:1871–1875
45. Adams HP Jr, Brott TG, Furlan AJ, et al.Guidelines for throm-bolytic therapy for acute stroke: a supplement to the fuidelines for the management of patients with acute ischemic stroke. A state-ment for healthcare professionals from a Special Writing Group of the Stroke Council, American Heart Association.Stroke1996;27: 1711–1718
46. Albers GW, Bates VE, Clark WM, Bell R, Verro P, Hamilton SA.
Intravenous tissue-type plasminogen activator for treatment of acute stroke: the Standard Treatment with Alteplase to Reverse Stroke (STARS) study.JAMA2000;283:1145–1150
47. von Kummer R, Holle R, Grzyska U, et al.Interobserver agree-ment in assessing early CT signs of middle cerebral artery infarc-tion.AJNR Am J Neuroradiol1996;17:1743–1748