Assessment of the Cooperative Intersection Safety System (IRIS) : setting up an evaluation for the IRIS system by modeling it in the MARS simulation environment
55
0
0
Full text
(2) Title page Title:. Assessment of the Cooperative Intersection Safety System (IRIS). Subtitle:. Setting up an evaluation for the IRIS system by modeling it in the MARS simulation environment. Bachelor Thesis for the bachelor program Civil Engineering at the University of Twente. Author:. H.N. (Henk) Barmentlo. Student number:. s0138762. Date:. August 20, 2009. Location:. Amersfoort. Supervisors: Prof. dr. ir. B. van Arem. First supervisor University of Twente. Dr. J. Bie. Second supervisor University of Twente. J. Vreeswijk MSc.. First supervisor Peek Traffic BV. A. de Koning MSc.. Second supervisor Peek Traffic BV. Thesis performed at:. Peek Traffic BV. Visiting address: Basicweg 16 3821 BR Amersfoort. University of Twente Faculty of Engineering Technology Centre for Transport Studies Knowledge centre Applications of Integrated Driver Assistance (AIDA). Mail address: Postbus 2542 3800 GB Amersfoort. P.O. Box 217 7500 AE Enschede. +31 33 454 1777. +31 53 489 3046. Assessment of the Cooperative Intersection Safety System (IRIS) Bachelor Thesis for the University of Twente, Enschede. 1.
(3) Preface This thesis acts as a starting point for the evaluation of the IRIS application. IRIS was under construction by Peek Traffic BV in the SAFESPOT project at the time of this thesis. The thesis was performed as a Bachelor Thesis for the University of Twente and commissioned by Peek Traffic BV. The research has taken place between April and July 2009. While working on this thesis, some setbacks were encountered. The development of the MARS environment provided by TNO was not as far as was expected upfront, so the scope of the thesis had to be shifted from evaluating IRIS to evaluating MARS and setting up the requirements for the evaluation of IRIS. I would like to thank Jaap Vreeswijk and Anne de Koning, who have been my supervisors and colleagues at Peek Traffic BV. They have provided me with everything I needed to do this research and have assisted me in handling the setbacks in the project. This has been of great help to me. Anne, thank you for your extensive feedback on my writing! Jing Bie from the University of Twente has helped me very well by supervising the whole path of the thesis. He has shown me directions for my research that I would not have come up with myself and has reviewed my concept versions of this thesis thoroughly to show me where I was not clear enough yet. I would also like to thank Bart Netten and Harry Wedemeijer from TNO Science & Industry, who have helped me by developing and adding new features to the MARS environment and Paul Mathias, who has been providing assistance in setting up the SAFESPOT applications and connecting them to MARS. Besides that the thesis did not reach the point that was expected in the beginning, the research that has been done will be useful for future use with the evaluation of IRIS and similar ITS projects.. - Henk Barmentlo –. Assessment of the Cooperative Intersection Safety System (IRIS) Bachelor Thesis for the University of Twente, Enschede. 2.
(4) Abstract This thesis describes the set up of an evaluation of the Intelligent Cooperative Intersection Safety (IRIS) system. The prerequisites for evaluation of this system are researched and described. The most important Surrogate Safety Measures that can be acquired are described briefly and those chosen are worked out in detail. After a discussion concerning various simulation models, the simulation model MARS is selected as a generator for intersection data. Using this tool, the evaluation of the Data Fusion Module subsystem of IRIS is initiated, by doing a sensitivity analysis of the operation of this system with biased GPS input measurements. This experiment shows that the system is capable of reducing the disturbing effects of biased GPS input. It also leads to recommendations about the further development of the Data Fusion Module and the future use of MARS in evaluating traffic safety.. List of abbreviations. DFH. Data Fusion Human-machine interface (the graphical interface of the DFM). DFL. Data Fusion Logic (the part of DFM that calculates data). DFM. Data Fusion Module. DR. Deceleration Rate (SSM indicator). IRIS. Intelligent cooperative Intersection Safety system. ITS. Intelligent Transport Systems. LDM. Local Dynamic Map (the internal map server that is used in SAFESPOT). MARS. Multi-Agent Real-time Simulation. PET. Post Encroachment Time (SSM indicator). SSM. Surrogate Safety Measure(s). TET. Time Exposed Time-to-collision (SSM indicator). TIT. Time Integrated Time-to-collision (SSM indicator). TTC. Time To Collision (SSM indicator). TNO. Toegepast. Natuurwetenschappelijk. Onderzoek. (Dutch. organisation for ‘Applied Scientific Research’, which has developed MARS) UDP. User Datagram Protocol (the protocol in which SAFESPOT applications communicate). Assessment of the Cooperative Intersection Safety System (IRIS) Bachelor Thesis for the University of Twente, Enschede. 3.
(5) Table of contents CHAPTER 1: INTRODUCTION ......................................................................... 6 CHAPTER 2: PROBLEM DEFINITION.................................................................. 7 2.1. PROJECT BACKGROUND..............................................................................7 2.2. RELEVANCE OF THE PROJECT ........................................................................7 2.3. TARGETS ............................................................................................7 2.4. RESEARCH QUESTIONS ...............................................................................8 2.5. HYPOTHESIS.........................................................................................9 2.6. RESEARCH STRATEGY ................................................................................9 2.7. READING GUIDE ................................................................................... 10 CHAPTER 3: DESCRIPTION OF IRIS AND THE DATA FUSION MODULE......................... 11 3.1. IRIS............................................................................................... 11 3.2. DATA FUSION MODULE (DFM)..................................................................... 12 CHAPTER 4: SURROGATE SAFETY MEASURES .................................................... 13 4.1. TRAFFIC SAFETY AND THE TRAFFIC CONFLICTS TECHNIQUE ........................................ 13 4.2. SURROGATE SAFETY MEASURES .................................................................... 14 4.3. SAFETY INDICATORS USED BY IRIS ................................................................. 21 4.4. CONCLUSION ...................................................................................... 21 CHAPTER 5: SETTING UP AN EVALUATION FOR IRIS ............................................ 23 5.1. DESCRIPTION OF THE EVALUATION ................................................................. 23 5.2. SELECTION OF A SIMULATION ENVIRONMENT........................................................ 25 CHAPTER 6: EVALUATION OF THE DATA FUSION MODULE IN SIMULATION ENVIRONMENT MARS .................................................................................................... 34 6.1. INTRODUCTION TO MARS ......................................................................... 34 6.2. SCENARIO DEVELOPMENT .......................................................................... 35 6.3. CONNECTION OF MARS TO DATA FUSION MODULE................................................. 37 6.4. SENSITIVITY EXPERIMENT DATA FUSION MODULE ................................................... 38 CHAPTER 7: EVALUATION PLANNING FOR FURTHER EVALUATION .......................... 43 7.1. CONTINUING EVALUATION OF THE DATA FUSION MODULE .......................................... 43 7.2. EVALUATION OF IRIS .............................................................................. 43 7.3. CONCLUSIONS ..................................................................................... 44 CHAPTER 8: CONCLUSIONS AND RECOMMENDATIONS .......................................... 45 8.1. ANSWERS TO RESEARCH QUESTIONS ................................................................ 45 8.2. CONCLUSIONS ..................................................................................... 46 8.3. RECOMMENDATIONS ............................................................................... 47 REFERENCES ........................................................................................... 49 APPENDIX I: FORECASTED TRAJECTORIES WITH VARYING GPS-ERRORS .................... 51. Assessment of the Cooperative Intersection Safety System (IRIS) Bachelor Thesis for the University of Twente, Enschede. 4.
(6) List of Figures Figure 1: The ‘left turning’ and ‘right turning’ scenarios in the IRIS application (Schendzielorz, Vreeswijk, & Mathias, 2008) ........................................ 11 Figure 2: Overview of the processes that take place in the Road Side Unit (Schendzielorz, Vreeswijk, & Mathias, 2008) ........................................ 12 Figure 3: Object refinement in the Data Fusion Module (Schendzielorz, Vreeswijk, & Mathias, 2008) ............................................................................ 12 Figure 4: The safety pyramid (Cunto, 2008) ....................................................... 13 Figure 5: Example of a TTC profile with TET and TIT (Minderhoud & Bovy, 2001) ........... 17 Figure 6: Time-space diagram with PET relations for a left-turning conflict (Cunto, 2008) 19 Figure 7: Schematization of the process of evaluating IRIS ..................................... 25 Figure 8: The MARS modeling concept (Papp & Zoutendijk, 2006) ............................. 34 Figure 9: Vehicle turning left in MARS, with another vehicle passing straight ahead (1) ... 35 Figure 10: Vehicle turning left in MARS, with another vehicle passing straight ahead (2) .. 36 Figure 11: Simplified example of a GPS ‘error ellipse’ (School of Surveying & Spatial Information Systems, UNSW, Sydney, Australia, 1999) ............................. 39 Figure 12: GPS measurements, Map Matched points and Forecasted trajectories ........... 40 Figure 13: Example of Forecasted Trajectory jumping backwards (‘upstream’) ............. 42 Figure 14: Schematization of the closed loop between IRIS, MARS and DFM.................. 43. List of Tables Table 1: Braking levels suggested by Hydén (Cunto, 2008) ...................................... 18 Table 2: Comparison of simulation environments using criteria ................................ 31. Assessment of the Cooperative Intersection Safety System (IRIS) Bachelor Thesis for the University of Twente, Enschede. 5.
(7) Chapter 1: Introduction Peek Traffic BV (company) The company that this Thesis is performed for is Peek Traffic BV (Peek). It is a part of the stock exchange listed company Imtech, but it operates under its own name. Peek has offices in Amersfoort in the Netherlands. Other offices are in Poland and Belgium. The company develops traffic systems (both the physical equipment and the software) that support mobility. Their systems are used in various traffic situations in the Netherlands and the rest of Europe. The main goals of the traffic solutions provided by Peek are efficiency, safety and environment preservation. By managing traffic on different scales, from single vehicles and intersections to a whole network, Peek tries to limit the impact of traffic on the environment and to maximize efficiency and the safety of every road user. Peek is involved in many national and international research projects, like CVIS, SAFESPOT and iTetris. Through cooperation with many partners, innovative systems are developed, which give a preview into the future of mobility solutions. Participating in this development strengthens Peeks competitive position and helps the company to build an innovative image. (Peek Traffic BV, 2009). SAFESPOT (project) The SAFESPOT project was launched in Februari 2006 as a part of the 6th European Framework Program. Its goal is to investigate the influence of cooperative vehicles on traffic safety. New systems and applications are built by the 52 European partners, including new sensing technologies and different kinds of communication between vehicles and roadside equipment. All the applications are based on the same platform and standards, which can be supported through many countries in Europe and set a framework for the future. (SAFESPOT Consortium, 2009) The SAFESPOT project consists of several subprojects. One of them is the subproject “Cooperative Safety Systems Infrastructure Based” (CoSSIB), which investigates cooperative applications that are running in a roadside unit. This subproject is the birthplace of IRIS.. IRIS (application) The Intelligent Cooperative Intersection Safety system (IRIS) is an Intelligent Transport System (ITS) that aims to identify dangerous situations as early as possible, so that severe traffic conflicts and collisions can be prevented. It uses scanners, sensors and beaconing through vehicle-to-infrastructure (V2I) communication to map all the movements made by road users on a signalized urban intersection. When a conflict is detected, one or more road users, usually vehicle drivers, are warned about this conflict and the appropriate action to avoid it. IRIS is still under development by Peek in cooperation with other partners in the SAFESPOT project. (Schendzielorz, Vreeswijk, & Mathias, 2008) Assessment of the Cooperative Intersection Safety System (IRIS) Bachelor Thesis for the University of Twente, Enschede. 6.
(8) Chapter 2: Problem definition 2.1. Project background IRIS has been implemented on an intersection in Helmond (the Netherlands) for testing and displaying purposes. However, it is not fully operational yet and still demands evaluation and validation, both in the field and by simulation. This evaluation will be the aim of this thesis. The recognition of traffic safety is not very easy. The IRIS system is designed to reduce the number of accidents by warning drivers, but also displays a warning message at nearaccidents. These near-accidents have to be schematized making assumptions about their properties. Part of this evaluation concentrates on the question if the techniques for this schematization are chosen well in the development of the IRIS system and which techniques can be used to evaluate safety in this context. Because IRIS and the SAFESPOT platform consist of multiple subsystems that all account for part of the process, these subsystems need to be evaluated separately and as a whole. All parts of the system can have their own errors and inconsistencies, which all have to be accounted for.. 2.2. Relevance of the project Evaluation needs to be done as a procedure to show the usefulness of the IRIS system in reality. It has to be checked if it really improves traffic safety on intersections. This information is required to make a proper judgment of the system and to make visible that its targets are met. For this European research project, this is particularly important because it shows the grant providers (the European Commission) and the other partners in the project that the application works and serves its purpose. The results of the evaluation can also be a guide for further development of the system. If the outcome of the evaluation is that the system significantly improves traffic safety, it is ready to be implemented and used commercially. If this is not the case, decisions can be made to further develop the system or to discard it as a failed project. This makes evaluation a powerful tool that guides the making of decisions for the progress of the project.. 2.3. Targets It is not fully understood yet what factors in traffic really influence traffic safety and which indicators should be used to measure the effects of an Intelligent Transport System (ITS). Various indicators, so called ‘Surrogate safety measures’, describe the relation between vehicles and the probability of conflicts. Different indicators are useful in different situations. The first part of the assignment therefore is to determine indicators from literature and select the most important ones for this assignment. When these guiding indicators for the evaluation of traffic safety have been investigated, we can determine if the right indicators are chosen in the IRIS project and if the project addresses the right traffic safety issues. Using these indicators, the improvement in traffic safety after the implementation of IRIS can be measured objectively. This leads to a conclusion about the usefulness and effect of the IRIS system.. Assessment of the Cooperative Intersection Safety System (IRIS) Bachelor Thesis for the University of Twente, Enschede. 7.
(9) The evaluation of the entire IRIS application will be too time-consuming for this thesis, so only part of the system can be evaluated. In this thesis, a start has been made to evaluate the ‘Data Fusion Module’-part of the SAFESPOT/IRIS system. In addition to that, an evaluation planning is developed which shows the actions that have to be undertaken to evaluate IRIS in the future. The target of this assignment will therefore be: “To set up the requirements for evaluation of the IRIS system, by selecting important indicators to measure traffic safety, selecting a correct evaluation tool and preparing this tool with the correct scenario’s and communication with the IRIS system and its subsystems” This target describes the two parts that are handled in this thesis: The literature review into indicators that determine traffic safety on the one hand and the preparation for the evaluation of the IRIS system using the indicators found in the literature study on the other hand. The target will result in an evaluation planning for evaluation of IRIS and a partial judgment on the safety improvement of part of the subsystems.. 2.4. Research questions In the light of the target listed in the previous paragraph, the following research questions can be raised: 1. “Which indicators are suitable for evaluating traffic safety after the implementation of the IRIS system? 1.1. “Which indicators are used to measure traffic safety on intersections?” 1.2. “How do these indicators work and for what traffic situation are they most suitable?” 1.3. “Which indicators are used by the IRIS system to determine possible conflicts?” This question is the leading factor in the literature review and helps determining the prerequisites for the evaluation. The answer of this research question provides more information and insight into traffic safety issues on intersections and will lead to a better understanding of traffic safety. 2. “Which tool should be used for the evaluation of the IRIS system?” 2.1. “Which tools are available to evaluate Intelligent Transport Systems and what are their properties?” 2.2. “Which tool is suitable to evaluate IRIS and how should it be used?” 2.3. “What development has to be done to evaluate the system using the selected tool?” The answer to this question will give an indication about which path has to be followed to come to an evaluation of IRIS. It will describe several evaluation tools, like field observation or simulation in a model, and their properties to evaluate an Intelligent Transport System, like IRIS. The most suitable tool is selected and worked out in an evaluation planning for IRIS.. Assessment of the Cooperative Intersection Safety System (IRIS) Bachelor Thesis for the University of Twente, Enschede. 8.
(10) 3. “Does the Data Fusion Module subsystem of the SAFESPOT project perform as it should?” 3.1. “How well does the Data Fusion Module interpret the data provided by the simulation tool?” 3.2. “What is the effect of the introduction of bias and errors in data collection on the output of the Data Fusion Module?” 3.3. “Is the output provided by the Data Fusion Module sufficient for further use by IRIS?” This research question gives insight in the level to which the Data Fusion Module (DFM) performs as it was meant to do. The data provided by the simulation tool will have to be interpreted and matched to the internal Local Dynamic Map (LDM) of the system. The DFM then outputs ‘predicted’ or ‘forecasted’ trajectories, which enable IRIS to calculate the likelihood of conflicts. The output can be tested on robustness when errors are introduced in the inputs. If the DFM is able to filter major statistical error in its inputs, there is a good chance that this will work in the real world.. 2.5. Hypothesis A lot of research has already been done by other researchers to define all indicators that are used for evaluating traffic safety. These indicators have to be ordered and specifically focused on this project. It is to be expected that the most commonly accepted indicators, Time To Collision and Post Encroachment Time, will also be applicable to this project, but other indicators could supplement or replace these ‘standard’ indicators. TNO Science and Industry (S&I) have provided their software tool MARS (Multi Agent Realtime Simulator) to the partners in the SAFESPOT project. They claim that it is one of the best tools for validating and evaluating SAFESPOT systems. In this thesis however, the scope is widened a little more, so other simulation methods and models are also mentioned and investigated. If TNO S&I are indeed right, MARS will pass this test as the best simulation model for this project. The DFM is essential for the working of the IRIS system. If the outputs of the DFM are not correct or easily influenced by errors in sensor data, this bias will propagate to the rest of the system, including IRIS. Some field tests have already been done to test the system in the real world. The outcome of these tests is that errors in for example GPS positioning have a big influence on the output of the DFM and, consequently, IRIS. This influence has yet to be measured, but it is to be expected that the system will not deplete these errors completely. To what extent errors in input and DFM affect IRIS outcomes, can be determined as a result of this.. 2.6. Research strategy The first part of this research focuses on literature review concerning Surrogate Safety Measures and the Traffic Conflicts Technique. This Traffic Conflicts Technique is one of the most commonly accepted ways to measure traffic safety (Amundsen & Hydén, 1977). The technique consists of many different measures or indicators, which are all used for different purposes. The most important and most used indicators are addressed, sorted. Assessment of the Cooperative Intersection Safety System (IRIS) Bachelor Thesis for the University of Twente, Enschede. 9.
(11) and judged on their added value for evaluating IRIS. After a thorough assessment of this technique, a conclusion is drawn on what indicators to use for evaluation. After that, an evaluation planning is set up. This can be done in different environments. The provided environment MARS by TNO S&I is already given, but is first compared to various other environments and models. In this investigation, simulation is compared to field testing, resulting in a statement why simulation should be used to evaluate and what properties will be required for this. This list of requirements is compared to the properties of various commonly used simulation environments, including MARS. Using the results of this comparison, it is determined if MARS is the most suitable tool for evaluation and if certain disadvantages have to be worked around. After a simulation environment is chosen, a simulation of a traffic situation (on an intersection) is set up, including different conflict scenarios which communicate with IRIS. The simulation generates data with a semi-random behaviour and error, within certain limits. This behaviour will be engineered similar to real driver- and vehicle behaviour, with differences in age, gender and reaction time of the driver and errors in vehicle positioning (GPS) and radio transmitting. This simulation is linked to the DFM. This subsystem organizes data and estimates expected trajectories of the vehicles. This subsystem is the first to be tested. It is ran several times with the same vehicle simulation, only influenced by predefined error margins. If the DFM outputs trajectories that make sense and are reproducible, the subsystem works correctly. The further evaluation of the IRIS system and the platform as a whole are beyond the scope of this thesis. However, an evaluation planning will be described briefly, to guide the rest of the evaluation.. 2.7. Reading guide Chapter 3 gives an additional description of the IRIS system and the DFM. In Chapter 4, the theory of Surrogate Safety Measures is described, resulting in a conclusion about the suitable measures for evaluating IRIS. Chapter 5 will describe how an evaluation for IRIS can be prepared. To do this, the simulation environment MARS is compared with other similar environments, resulting in a well founded conclusion on which environment should be used. In Chapter 6, the evaluation of the DFM using a sensitivity experiment is described. This experiment is only part of the eventual evaluation, but already gives a view on the functioning of the DFM and its use for IRIS. Chapter 7 provides a conclusion on this thesis, containing answers to the research questions, a conclusion on the various topics and recommendations for further research and evaluation.. Assessment of the Cooperative Intersection Safety System (IRIS) Bachelor Thesis for the University of Twente, Enschede. 10.
(12) Chapter 3: Description of IRIS and the Data Fusion Module 3.1. IRIS The Intelligent Cooperative Intersection Safety (IRIS) system is an application in the CoSSIB subproject of the European research project SAFESPOT. The system is based in a roadside unit and connected to both physical sensors and scanners (to sense the existence of static and dynamic objects on the road) and communication devices to receive beaconing from SAFESPOT equipped vehicles). Using this data, IRIS is able to identify conflicting vehicle paths as possible accident sites. It reacts upon this identification by warning one or multiple vehicles about this threat. The IRIS system focuses on four possible traffic scenario’s: ‘Left turning’ (warns left turning vehicle drivers if there is an approaching vehicle that they have to give right of way), ‘Right turning’ (warns right turning vehicle drivers if there is a danger to collide with a vulnerable road user), ‘Red light violation’ (warns violators of a red traffic light to avoid the violation and warns other road users if the conflict remains) and ‘Emergency vehicle approaching’ (similar to ‘Red light violation’, warns all road users that an emergency vehicle is approaching, to allow quick crossing of this vehicle). The ‘left turning’ and ‘right turning scenarios are shown in Figure 1.. Figure 1: The ‘left turning’ and ‘right turning’ scenarios in the IRIS application (Schendzielorz, Vreeswijk, & Mathias, 2008). Because of the often complex and attention-demanding traffic situation on urban intersections, the attention of drivers has to be divided, resulting in accidents in the above scenarios. These are the scenarios that lead to a significant part of the crashes on intersections (Vreeswijk, Turksma, Schendzielorz, & Mathias, 2008). IRIS tries to reduce the number of accidents by helping the drivers to detect and filter dangerous situations. IRIS is under construction by various partners in the SAFESPOT project, but especially by Peek Traffic BV in Amersfoort (the Netherlands), MAT.TRAFFIC in Aachen (Germany) and the Munich University of Technology in Munich (Germany). It is being tested and demonstrated on two test sites in Helmond (the Netherlands) and Dortmund (Germany). On these test sites, field tests have taken place in the first half of 2009. These field tests will be supplemented with the evaluation of IRIS using a simulation tool.(Schendzielorz, Vreeswijk, & Mathias, 2008; Vreeswijk, Turksma, Schendzielorz, & Mathias, 2008). Assessment of the Cooperative Intersection Safety System (IRIS) Bachelor Thesis for the University of Twente, Enschede. 11.
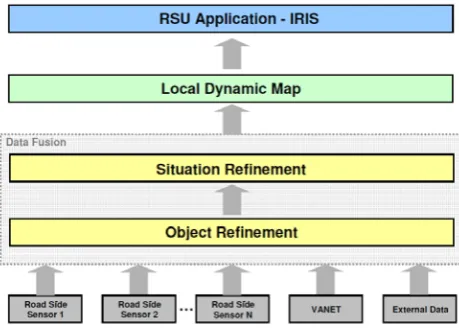
(13) 3.2. Data Fusion Module (DFM) The communication from the roadside sensors and beaconing to IRIS is routed through the DFM. This application consists of three parts: the Data Receiver, the Object Refinement and the Situation Refinement. The structure of the DFM in the system is illustrated in Figure 2. The Data Receiver is not shown in this picture, but is represented by the different sensors giving input to the DFM.. Figure 2: Overview of the processes that take place in the Road Side Unit (Schendzielorz, Vreeswijk, & Mathias, 2008). The Data Receiver receives the input data from the different sources, like scanners, sensors and VANET (Vehicular Ad Hoc Network) beaconing of SAFESPOT vehicles. It is also connected to the traffic light controller. It passes these data on to the Object Refinement. The Object Refinement translates the positional information into real trajectories of objects in the world and uses these trajectories to build ‘fused trajectories’ that are corrected for errors by averaging the trajectory with earlier gathered data and data from other sensors. After this, it checks the received data for errors in positioning by ‘Map Matching’ it to the Local Dynamic Map (LDM). The structure of the Object Refinement is illustrated in Figure 3.. Figure 3: Object refinement in the Data Fusion Module (Schendzielorz, Vreeswijk, & Mathias, 2008). The Situation Refinement of the DFM develops ‘forecasted trajectories’, with which it estimates what the most probable future path of the vehicle will be, according to position, speed, acceleration and other properties. At the end of the ‘fusion process’, the DFM writes the corrected data to the LDM for querying by applications like IRIS. (Schendzielorz, Vreeswijk, & Mathias, 2008) Assessment of the Cooperative Intersection Safety System (IRIS) Bachelor Thesis for the University of Twente, Enschede. 12.
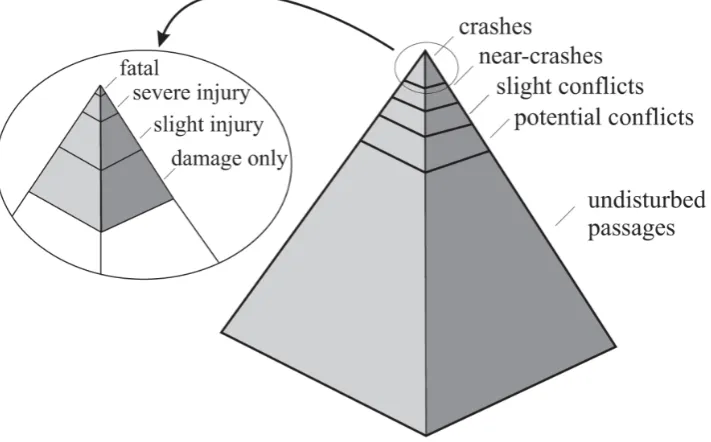
(14) Chapter 4: Surrogate Safety Measures 4.1. Traffic safety and the Traffic Conflicts Technique Traffic safety is a dynamic concept. It is an interaction between the environment, the vehicles and the users of the traffic system (Cunto, 2008). Gettman and Head define traffic safety in the following way: The expected number of crashes, by type, expected to occur at an entity in a certain period, per unit of time. (Gettman & Head, 2003) The number of crashes is the leading measurement for this definition. This number is however difficult to predict or measure, because accidents normally do not take place frequently and occur in a semi-random phase. The amount of accidents measured during a period of time does not always correspond with the actual traffic safety on an intersection. In fact, the amount of accidents is only the “top of the iceberg” of all possible dangerous situations on an intersection. Cunto (2008) quotes Hydén (1987) when he describes the total amount of possible interactions of traffic graphically in Figure 4.. Figure 4: The safety pyramid (Cunto, 2008). The vast amount of incidents that are not ‘undisturbed’ consists of so called ‘conflicts’. These cannot be promptly detected, but have to be measured using a tool. This tool is called the “Traffic Conflicts Technique” (TCT), or more specific the “Swedish Traffic Conflict Technique” (Archer, 2005; Gettman & Head, 2003; Hydén, 1987). It is in use since the late 1960’s and in the past decades a lot of research has been done to determine the validity of TCT and its measurements. In the TCT, conflicts are defined as: An observable situation in which two or more road users approach each other in time and space to such an extent that there is risk of collision if their movements remain unchanged (Amundsen & Hydén, 1977). Assessment of the Cooperative Intersection Safety System (IRIS) Bachelor Thesis for the University of Twente, Enschede. 13.
(15) Conflicts are generally accepted as being correlated to the occurrence of accidents. (Archer, 2005; van der Horst, 1990). This statement is however not proven in detail in the field, because accurate data is lacking and cannot be gathered easily. This disadvantage is less important if the TCT is used to test the improvement in traffic safety before and after the implementation of new systems. Data about the correlation of conflicts with accidents on a specific intersection is not used in this kind of experiment, because the differences in the occurrence of conflicts are measured (Chin & Quek, 1997; van Dijck, 2008). As mentioned above, conflicts are not easily detectable and cannot be ordered properly. The technique makes use of “surrogate safety measures” to represent conflict situations. These are measures that approach the assessment of real traffic safety. A surrogate safety measure tries to predict the increased probability of higher than average crash rates. Safety measures are represented by so-called indicators. There are several indicators that are used for the assessment of traffic safety. These can be categorized as indicators that show conflict in the probability of a collision and indicators that show the severity of conflicts if they would result in a collision. These two kinds of indicators differ in the way that a crash can, for example, be highly probable to occur, but will not result in much damage or casualties because low driving speeds are involved (Archer, 2005; Sayed & Zein, 1999). This study will only concentrate on indicators that assess the probability of a collision, because the IRIS application is built to reduce the number of collisions. It will react on every conflict that will possibly lead to an accident and does not take the severity of this possible accident into account.. 4.2. Surrogate safety measures In this paragraph, the most important surrogate safety measures will be described in detail. As a result of this description of applications, pro’s and con’s of these indicators, the most suitable ones for this project can be selected.. Time To Collision (TTC) The Time To Collision (TTC) measure, one of the most well-known surrogate safety measures, was first defined by Hayward in 1972 as “the time required for two vehicles to collide if they continue at their present speed and on the same path” (Gettman & Head, 2003; Cunto, 2008). The TTC is measured by dividing the distance between two vehicles that are on a collision course by the speed difference between these vehicles at that moment. This value is calculated for every period of time, usually multiple times per second. For angled crashes, the distance is calculated by measuring the distance between one of the vehicles and the projected point of collision (Cunto, 2008). These two vehicles logically have to be on a collision course for a point of collision to exist.. Assessment of the Cooperative Intersection Safety System (IRIS) Bachelor Thesis for the University of Twente, Enschede. 14.
(16) TTC can be measured using the following expressions: (4.1). (4.2) where: t = time interval X = position of the vehicles (i = following vehicle, i-1 = lead vehicle) L =vehicle length V = velocity Di,t = distance between the projected point of collision and vehicle i Source: (Abdoelbasier, 2005) In expression 3.1, the TTC is calculated for two vehicles that are traveling in the same direction. Expression 3.2 describes the calculation TTC at an angled crash. For this calculation, only one of the vehicle paths needs to be calculated. Any two vehicles that are on a collision course have a TTC value, which can however be very large. If the TTC value is small, a crash is more likely to occur than when large TTC values are measured. A conflict is detected if the TTC exceeds a certain value, the threshold value. This threshold is arbitrary and depends on the location. The most frequently mentioned minimum value for TTC in literature is 1,5 seconds (van der Horst, 1990; van der Horst & Hogema, 1993). Van der Horst & Hogema also suggest a minimum TTC for a Collision Avoiding System (CAS) to work properly in its goal to warn a driver. This minimum is 4 seconds, divided in 1,5 seconds reaction time and 2,5 seconds average braking time (van der Horst & Hogema, 1993). Minderhoud & Bovy (2001) describe how a TTC of 4 to 5 seconds can discriminate between a moment in which a driver finds himself in a dangerous situation and a moment in which he is in control. However, these TTC values may result in too many false alarms. This makes that the authors prefer to use a TTC value of 3 seconds (Minderhoud & Bovy, 2001). These values are estimated as a combination of theory and field tests. Usually, only the minimum value of TTC is assessed, but sometimes a continuous measure of TTC for the entire event is done (Cunto, 2008). This gives a more realistic picture of how often which TTC values occur. This is described in more detail for the TET and TIT indicators. TTC is a valuable indicator for measuring traffic safety on an intersection. In situations where a collision course exists, it can be a good estimator for the probability that a collision will take place. It is also a good indicator for the evaluation of a system like IRIS. TTC values can be measured in situations where IRIS does not interfere (the so called “before-measurements”), while these results can be compared to TTC values in a situation that the system does interfere and a driver responds accordingly (the “aftermeasurements”). Assessment of the Cooperative Intersection Safety System (IRIS) Bachelor Thesis for the University of Twente, Enschede. 15.
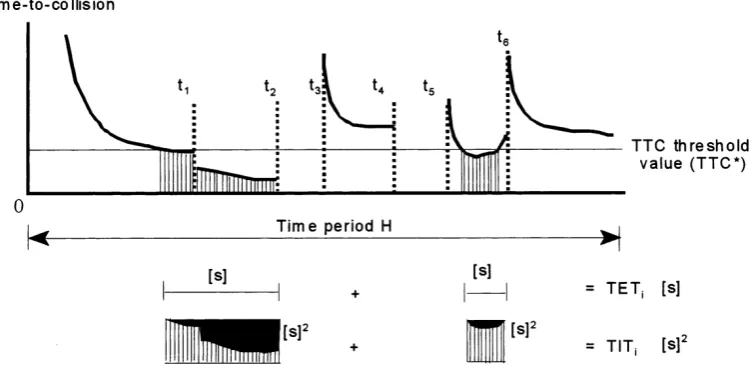
(17) Time Exposed Time-to-collision (TET) and Time Integrated Time-to-collision (TIT) TTC is a surrogate safety measure that can be determined at every time step. It tells something about the likelihood of a crash to occur, but does not return the overall safety of the intersection. Efforts to define an indicator which actually returns the safety of a situation have led to the development of Time Exposed Time-to-collision (TET) and Time Integrated Time-to-collision (TIT). Minderhoud and Bovy (2001) give the following definition of TET: “The duration of exposition to safety-critical time-to-collision values over specified time duration H” (Minderhoud & Bovy, 2001). It is a summation of all moments that a driver approaches another vehicle or a conflict point with a TTC value below the threshold value. This results in a value, expressed in seconds, that assesses the time that a conflict occurs during a time period. TET is calculated using the following expression:. (4.3) where: TETi*= Time Exposed Time-to-collision (s) for vehicle i given threshold TTC* T = H/τsc = total number of observed time intervals H = total time considered in the study (s) τsc = time interval to assume a constant TTC Source: (Minderhoud & Bovy, 2001) TET could be seen as the inverse of the time the intersection is safe, so the lower the TET value, the safer the situation. This could also be accumulated for all vehicles on an intersection in a period of time, resulting in a total number of below-threshold TTC time on the intersection. This can be seen in expression 3.4. (Minderhoud & Bovy, 2001) (4.4) where: TET* = Time Exposed Time-to-collision (s) for all vehicles (i = 1…N) given threshold TTC* Source: (Minderhoud & Bovy, 2001) Because TET only assesses the time a conflict is present, it does not indicate the criticality of this conflict. This is why the Time Integrated Time-to-collision (TIT) is invented. This indicator “uses the integral of the TTC profile of drivers to express the level of safety” (Minderhoud & Bovy, 2001). This is expressed in s2. Because more dangerous situations (with a TTC value further below the threshold TTC value) are weighted stronger in this indicator, the higher the TIT value gets, the more unsafe the intersection is. This could again be accumulated over time, resulting in a total safety number. (Minderhoud & Bovy, 2001). TIT is calculated using the following expressions: (4.5). Assessment of the Cooperative Intersection Safety System (IRIS) Bachelor Thesis for the University of Twente, Enschede. 16.
(18) (4.6) where: TITi* = Time Integrated Time-to-collision (s) for vehicle i given threshold TTC* τsc = time interval to assume a constant TTC TIT* = Time Integrated Time-to-collision (s) for all vehicles (i = 1…N) given threshold TTC* Source: (Minderhoud & Bovy, 2001) A graphical representation of TET and TIT can be seen in Figure 5. As already described under “Time To Collision”, TTC is a good indicator to show the improvement that a system like IRIS has on an intersection, because before- and after-measurements can be taken easily. TET and especially TIT add some more value to this, by giving an absolute number for the safety of an intersection. This can be done for every conflict situation, but can also be summated easily to get a picture of the total traffic safety over a longer period of time. This makes it a valuable addition for testing the value of the IRIS application.. Figure 5: Example of a TTC profile with TET and TIT (Minderhoud & Bovy, 2001). Post-Encroachment Time (PET) The Post-Encroachment Time (PET) is defined as “the time lapse between end of encroachment of turning vehicle and the time that the through vehicle actually arrives at the potential point of collision” (Gettman & Head, 2003). This indicator is measured at one point on the intersection, the conflict point, where the paths of the two vehicles cross each other. The two vehicles do not need to be on a collision course. It is enough if their future or past paths cross. This is valuable in field experiments, where relative speed between two vehicles and their exact location usually cannot be measured unbiased. When using simulation software, this usually is not a problem, but the fact that a collision course is not required makes PET a very valuable tool in real life. The PET describes safety in crossing conflicts very well, because it gives a description on how close the two vehicles have been to crashing. A PET of 0 seconds would obviously lead to a crash, but a short PET close to 0 also only requires a little mistake by one of the drivers to result in a crash (van Dijck, 2008).. Assessment of the Cooperative Intersection Safety System (IRIS) Bachelor Thesis for the University of Twente, Enschede. 17.
(19) PET has a threshold value, which indicates safety. A PET value lower than this threshold value is indicated as a conflict. The value of this threshold is arbitrary and can vary in different locations. Literature studies give values between 1 and 2 seconds A PET of 2 seconds is usually considered to be the time in which normal maneuvers can be executed (Archer, 2005; van der Horst, 1990; van Dijck, 2008). This of course also applies to negative values PET can easily be used in the evaluation process of the IRIS system. It has the major advantage that vehicles do not actually have to be on a collision course for a PET-value to exist. More measurements in more situations can be taken here, considering a larger part of the total simulation time. Not only situations where an accident would have happened if no action was taken are considered here, but also the situation where an accident could have happened if any condition would have had a slightly different effect on one of the vehicles.. Deceleration Rate (DR) The Deceleration Rate (DR, or Deceleration Rate to Avoid Crash, DRAC (Cunto, 2008)) is defined as the “rate at which crossing vehicles must decelerate to avoid collision with the conflicting vehicle” (Gettman & Head, 2003; Cunto, 2008). This rate can be used to show how strong a driver has to react to avoid a collision, which indicates how probable it is that a driver will not be able to react in time. It also gives an estimation of how strong the normal traffic situation is disturbed. This is a possible measure for the overall safety of the intersection. For angled crashes, the DR can be calculated using the following expression: (4.7) where: t = time interval i = vehicle for which the DR is calculated Vi,t = velocity of vehicle i at interval t Di,t = distance between the projected point of collision and vehicle i at interval t Source: (Cunto, 2008) A scale of severity of deceleration rates can be made quite arbitrarily, but in a more intuitive way. Examples of scales like this are the one made by McDowell et al. and the classification made by Hydén (Cunto, 2008). These are based on ranges of deceleration and ordered in an ordinal scale. The scale of Hydén is shown in Table 1. We use this scale, because it is quite similar to the one used by McDowell et al., while Hydén extends it with a nominal description of the required reaction by de driver instead of only showing an ordinal value. This makes it easier to get an impression of actual severity of a conflict. Conflict level No conflict No conflict 1 2 3 4. DR(AC) (m/s2) 0 0 to 1 1 to 2 2 to 4 4 to 6 ≥6. Description Evasive action not necessary Adaptation necessary Reaction necessary Considerable reaction necessary Heavy reaction necessary Emergency reaction necessary. Table 1: Braking levels suggested by Hydén (Cunto, 2008). Assessment of the Cooperative Intersection Safety System (IRIS) Bachelor Thesis for the University of Twente, Enschede. 18.
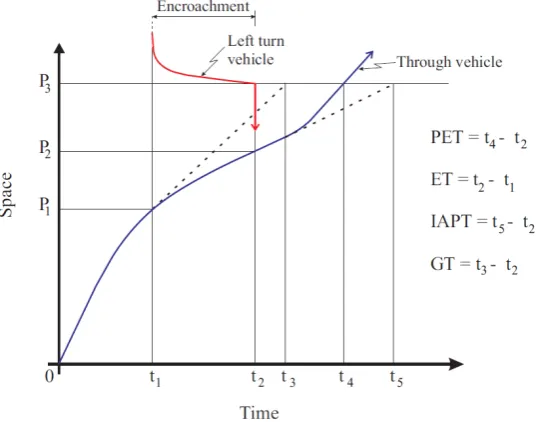
(20) The required DR is applicable in a lot of scenario’s, for example for different weather conditions or for all sorts of intersections. It should be reckoned with that different kinds of vehicles will have different maximum deceleration values and that values will vary in various weather conditions (Cunto, 2008). DR can however be a good indicator to evaluate the likelihood a crash could be avoided when a conflict is detected. It will return a value to what extend has to be braked, from which conclusions can be drawn on the possibilities of succeeding in this.. Other surrogate safety measures Besides TTC, PET and DR (and their derivative indicators), there are several other indicators that indicate the likelihood of occurrence of a conflict. These are mentioned by several literature sources, like Gettman and Head (2003), Abdoelbasier (2005) and Cunto (2008). They are often much like TTC (TTA) or PET (IAPT, GT, ET). The relation between PET and other surrogate safety measures is illustrated in Figure 6.. Figure 6: Time-space diagram with PET relations for a left-turning conflict (Cunto, 2008). Time To Accident (TTA) A simplified version of TTC is the Time To Accident (TTA). This is defined as “the time that passes from the moment that one of the users reacts and starts braking or swerving until the moment the involved road user had reached the point of collision if both road users had continued with unchanged speed and direction” (Cunto, 2008). In this case, only one TTC value is calculated, namely the TTC at the instant that one of the users starts braking. This indicator is invented to reduce the number of measurements that have to be taken or simulated and relies on human judgment of speed and distance. This is only required in a field experiment, where humans have to do the measuring and TTC cannot be estimated correctly. When using simulation software or more accurate sensors, TTC is a more exact and more valuable indicator. Initially Attempted Post-Encroachment Time (IAPT) The Initially Attempted Post-Encroachment Time (IAPT or IAPET) is almost equal to PET, but it does not use the real time of arrival at the conflict area by the vehicle on the major approach, but uses the projected arrival time if no action was taken by the driver (Cunto, 2008). The values of PET and IAPT are however often the same, because most PET Assessment of the Cooperative Intersection Safety System (IRIS) Bachelor Thesis for the University of Twente, Enschede. 19.
(21) calculations that are done to predict conflict situations, are done while not regarding the actions of the driver. Actually, often when one tries to calculate PET for predictions, he actually calculates IAPT, because he does not know what action the driver is going to take. Therefore, this indicator can be seen as very closely related to PET and often the same. Gap Time (GT) Gap Time (GT) is the time between the end of the encroachment of the offending vehicle and the arrival time at the conflict point of the major approach vehicle, if they continue with the same speed and path and no action is taken (Cunto, 2008; Gettman & Head, 2003). In other words, it is the time that neither of the vehicles is occupying the conflict area, if none of the vehicles had braked or changed path. This value is the same as the PET/IAPT if no actions are taken there. It could be used to measure the PET if no one would react, to determine if an action should be taken or a warning should be given. This is however just another indicator that does the same things as PET, but is less flexible to work with. Therefore, Gap Time is not required to evaluate intersection safety in this case. Proportion of Stopping Distance (PSD) The Proportion of Stopping Distiance (PSD) was defined by Cunto (2008) as “the ratio between the remaining distance to the point of collision and the minimum acceptable stopping distance” (Cunto, 2008). This measurement should be started when the “offending vehicle starts to infringe upon the right-of-way of the other vehicle” (Cunto, 2008), but this could mean that the vehicles are not on a collision course, for example when their PET and GT are greater than 0. This indicator thus only applies when a conflict is about to take place and indicates the probability that an accident could be avoided. It is also closely related to DR, because it describes the relation between braking and avoiding a collision. While these indicators could not be used directly to describe the increasing traffic safety after implementation of IRIS, they could be used to describe the probability of a driver being able to avoid a collision after a warning from IRIS is received. Encroachment Time (ET) The Encroachment Time is the “time duration during which the offending vehicle infringes the right-of-way of the vehicle in the major approach” (Abdoelbasier, 2005; Cunto, 2008). In other words, it is the time that the offending vehicle is occupying the conflict area between the two vehicles. This could be a good measurement if the location of the conflict area is known exactly and the time in which the offending vehicle occupies this area could be measured precisely. It also requires the assumption that vehicles in major approach have a constant speed, so a longer ET would need a higher deceleration rate of the vehicles on the major approach, resulting in a more severe conflict (Cunto, 2008). However, it still does not say much about the probability or severity of a conflict situation and the resulting accident. This makes it less suitable to use in assessing traffic safety on an intersection.. Assessment of the Cooperative Intersection Safety System (IRIS) Bachelor Thesis for the University of Twente, Enschede. 20.
(22) 4.3. Safety indicators used by IRIS The IRIS application uses two of the surrogate safety measures described earlier to determine the threat of a situation. It uses short-term predictions of the trajectories of objects as an input for PET. The PET of two conflicting vehicles can be estimated when these predictions, which are actually extrapolations of position, speed and acceleration, are applied. The PET is used as an input for the Safety Margin Concept, which determines how safe the situation is. It distinguishes between the states “Comfort” (communication is necessary, but the driver has to react in a very comfortable way), “Safety” (the situation is relevant for safety and the driver has to react in time) and “Critical” (the situation is critical for safety and the driver has to react very fast). (Vreeswijk, Schendzielorz, Mathias, Feenstra, & Pauwelussen, 2008; Vreeswijk, Turksma, Schendzielorz, & Mathias, 2008; Schendzielorz, Vreeswijk, & Mathias, 2008) TTC is also calculated and inputted to the Safety Margin Concept. This calculation is done using the actual position and speed of each vehicle and is a continuous function of time, under the condition that a collision course exists between two vehicles. IRIS uses the data from the Safety Margin Concept, generated using PET and TTC, to generate a message containing the appropriate action to be taken by one or more drivers.. 4.4. Conclusion The Traffic Conflicts Technique and Surrogate Safety Measures Traffic safety can be modeled using the Traffic Conflicts Technique. This technique uses potential accidents, so called conflicts, as a predictor for the actual amount of accidents on an intersection. This results in a good estimation of the actual safety on an intersection. Conflicts can be detected with several ‘surrogate safety measures’ or ‘indicators’. The most well-known and commonly accepted indicators are TTC (the time it will take for two vehicles to collide), PET (the time a conflict area is empty after the first vehicle left it until the next vehicle arrives) and DR (the extent to which a driver must brake to avoid an accident). From these indicators, other indicators are derived, like the quite similar but minor Time To Accident (TTA) and the more specific Time Exposed TTC (TET) and Time Integrated TTC (TIT). The latter two measures give a more complete and usable value of TTC. Other minor, derived indicators are available, but give the same results as the above indicators. They are more specific or more global than their predecessors and are not applicable in most situations.. Surrogate safety measures available for the evaluation of IRIS IRIS uses TTC and PET to determine the severity of a conflict and the need to interfere in a traffic situation. In conflict situations, it provides a warning message. Whether this message is correct, in time and useful can be defined using several surrogate safety measures. The most straightforward approach is to use TTC and PET themselves, because they can give a clear overview of the situation and the propagation of a conflict. With these indicators, the severity of a conflict can be successively determined before IRIS. Assessment of the Cooperative Intersection Safety System (IRIS) Bachelor Thesis for the University of Twente, Enschede. 21.
(23) detects a conflict, while it is calculating the correct interference warning and after it interferes in the situation. The changes in number and value of TTC and PET after implementation of IRIS indicate the value of the application. These changes can, for TTC, be calculated by the indicators TET and TIT. These give a total ‘score’ for the safety of the intersection, which will be determined in ‘before’- and ‘after’- (implementation) situations. The values of PET can be plotted in time, providing graphs for each vehicle, from which conclusions can be drawn concerning safety improvement. The DR is also a valuable measure, because it gives an impression of the likelihood that a crash can be avoided. The DR can be calculated at the instant that the warning message from IRIS is received, resulting in a number that shows the extent to which the driver has to brake. Whether this is possible depends on the weather conditions and the type of vehicle, so this value should be compared to certain thresholds. This will give an impression on the overall likelihood of avoiding a crash when a message from IRIS is received. This DR value is only calculated with the IRIS application applied, so there is no ‘before’- and ‘after’-testing. The DR thus only evaluates the validity of the warning message provided and not the total added safety of IRIS. For evaluation of the IRIS system using MARS as a simulator, TTC (minimum value and propagation), PET, TET, TIT and DR will be calculated using the position, speed and acceleration data MARS provides. These can be plotted and compared in ‘before’- and ‘after’ situations and can be repeated with a random seed to give a good representation of a real intersection.. Assessment of the Cooperative Intersection Safety System (IRIS) Bachelor Thesis for the University of Twente, Enschede. 22.
(24) Chapter 5: Setting up an evaluation for IRIS 5.1. Description of the evaluation Evaluation of IRIS is required to prove the usefulness of the application. If it really contributes to traffic safety on an intersection and if this revenue exceeds the total costs, it is worth the effort to implement it in the real world. Evaluation will show developers if the application does what it is meant to do and enables them to implement the application and sell it. For potential customers, the evaluation is a valuable test that provides trust in the application. For the SAFESPOT project, evaluation is also important to show funding providers the results of the project.. Field tests vs. simulation models For several reasons, it is hard to test the IRIS application in the field. The application is not fully available for testing it physically on a real intersection. Besides that, it would not be ethically and morally appropriate to test traffic safety in the real world. Vehicles and people would have to be brought on the brink of colliding, to see if the system interferes in the situation. This would actually create dangerous situations, which is not acceptable. To do a statistically correct evaluation of traffic safety, many experiments would have to be done, under similar circumstances. Besides the time consuming part of this problem, it is also not likely that all circumstances, like traffic situation, weather and time of the day could be set to constants in a field experiment. Finally, field studies would also be very expensive, because various vehicles and intersections must be equipped with the IRIS system. (Morsink & Wismans, 2008) The effects of IRIS could also be tested in a driving simulator test, as was done by some of the developers in an earlier stage (Vreeswijk, Schendzielorz, Mathias, Feenstra, & Pauwelussen, 2008). This gives better insight in driver conception of the system and simulates driver behaviour almost perfectly, because it uses real persons as drivers. However, this way of simulation costs much time and effort and does not enable developers to check if the system is working correctly, because every test driver has his own bias and errors. Driver simulation study is therefore useful to investigate driver behaviour, but is not exact enough for a satisfying evaluation of the application. A controlled environment should be used to overcome these troubles. Not all components of the IRIS application have to be built physically and implemented into a roadside unit (RSU) to test if it is working as it should work. Tests can be repeated as often as necessary, because simulation is done by a computer and does not result in any danger to people or property. In a simulation model, all parameters that are not used in the experiment, can be fixed and, often as a result of that been ignored. An experiment can be repeated several times with the same parameter values or with a random seed in their parameters, to discover constants and variables in the experiment results. (Tapani, 2005) For this purpose it is most suitable to use a computer simulation as a data generator and simulator of the intersection. Shortcomings of computer simulation, like uncertain or incorrectly modeled driver behaviour, should however be kept in mind while analyzing results. (Archer, 2005; Morsink & Wismans, 2008). Assessment of the Cooperative Intersection Safety System (IRIS) Bachelor Thesis for the University of Twente, Enschede. 23.
(25) Requirements for setting up an experiment To set up an experiment, several choices have to be made. One of the most important questions is which simulation environment is suitable for the evaluation of traffic safety and especially for this case. To choose the correct simulation model, several models will be compared with each other in the next paragraph. Every simulation model will have its own advantages and disadvantages that apply to this project. After one of them is chosen, the advantages of the model can be exploited, while the disadvantages have to be compensated or overcome. It is important to be aware of the capabilities of the model, so when traffic scenarios are implemented in the model, problems can be recognized easily. The development of traffic scenarios in the simulation model should be done in phases. First, a reference intersection should be developed. Ideally, the intersection where IRIS is tested in Helmond could be built, because simulation and field test results could then be compared and linked. If the model requires this, a simpler intersection can be built to test the application separate of the Helmond tests. This intersection should however still be able to evaluate all scenarios that are available in IRIS. The simulation environment must be connected with the SAFESPOT platform and IRIS to send messages between the model and the application. Communication must be available in both directions. Logging data from the model is sent to IRIS, after which IRIS will generate a warning message which it sends back to the simulation model, where the warning is applied in the traffic situation. If there are any problems with the communication of vehicle properties to the DFM, for example if beaconing messages get lost or a GPS location is incorrect, the forecasted trajectories will be biased. This property must be researched in an experiment.. Evaluation of IRIS by simulating Eventually, the simulations have to be ran to generate traffic data. To do a useful evaluation, data acquired from the simulation in which IRIS interferes should be compared to reference data. In this reference data, the same conflict situations should be simulated, but without IRIS interfering. This data is called the ‘before’ data, because it is acquired ‘before implementation of the IRIS application’. The data simulated with interference of IRIS is called the ‘after’ data. Before- and after data could be generated by running the same simulation set twice, once without any interference and one with IRIS connected and interfering in the simulation. To evaluate if traffic safety has really improved, the simulation data can be used to do calculations of surrogate safety measures. Using surrogate safety measures as indicators for traffic safety, a total value for traffic safety over a period of time on the simulated intersection can be calculated for the before- and after situation. If these values differ significantly, conclusions can be drawn whether IRIS makes the intersection ‘safer’ or not. The exact application of Surrogate Safety Measures can be found in the chapter ‘Surrogate Safety Measures’.. Summary Before evaluation can take place, some choices have to be made to define the correct testing environment. It is most likely that evaluation of IRIS will take place in a simulation model, because field testing and driver simulator tests are less suitable for this case. A. Assessment of the Cooperative Intersection Safety System (IRIS) Bachelor Thesis for the University of Twente, Enschede. 24.
(26) simulation model must be selected, taking the advantages and disadvantages of several models into account. In the selected model, a scenario should be defined, allowing simulations to take place in an environment that is as realistic as possible. With the acquired data, calculations can be done to draw a conclusion on the added value of IRIS for traffic safety on intersections. The entire evaluation is beyond the scope of this thesis, so only the set up of this evaluation will be described. A schematization of the process is shown in Figure 7. Selecting a simulation environment. Developing a scenario. Connecting the simulation to the SAFESPOT platform. Running simulations. Comparing data. Calculating using SSM. Figure 7: Schematization of the process of evaluating IRIS. 5.2. Selection of a simulation environment Requirements for simulation traffic safety Simulation models have always mainly been used to analyze capacity and level of service of a traffic network. They have often been applied to investigate the effect of making an extra lane or applying different traffic signal control strategies (Tapani, 2005). However, due to recent discoveries of better measures for analyzing traffic safety, simulations are more and more used in this part of traffic engineering. For evaluation of a safety based Intelligent Transport System like IRIS in a simulation environment, some basic properties are required. These will be briefly illustrated below. Driver behaviour One of the most important required features is realistic representation of driver behaviour. The behaviour of every individual driver is different, often resulting in conflicts when drivers meet in traffic. Every driver has his own response on typical situations, depending on, for example, their experience, age, gender and current emotions. This driver behaviour cannot be simulated entirely, but assumptions can be made. Driver behaviour simulation focuses on parameters that differ between drivers. Gap acceptance, car-following and lane changing behaviour are measures that account for the cautiousness/aggressiveness of a driver. These have to be dynamically simulated to match real driver behaviour. Usually, this is done with extensive models, based on probability and measured data. These models have to be calibrated for every traffic situation, to be sure that they match real observed data. It is often very difficult to formulate an expression to calculate these properties, because of the assumptions and estimations that are made by drivers. Parameters like reaction time, inattention and compliancy with traffic rules differ depending on the driver’s current emotions. The values for these parameters are usually based on empirical measures in the field. They have to be handled with care in simulations, because they must not be applied outside of their situational context. (Archer, 2005). Assessment of the Cooperative Intersection Safety System (IRIS) Bachelor Thesis for the University of Twente, Enschede. 25.
(27) Vehicle- and road dependent factors For correct simulation of a traffic situation, the environment and the vehicle properties also have to be simulated with care. The difference between desired and average speed for example, will have great effect on the amount of conflicts and accidents in several traffic situations. The variations in speed for one driver or between drivers are also an important property in traffic flows. This makes it an important attribute in realistic simulations. Correct variation values will have to be collected from field assessment. The traffic flow and –composition are difficult to simulate correctly. These variables can be collected empirical, but differ over time. It is almost impossible to simulate variations in parameters veraciously, without copying the entire traffic situation. Choices in traffic composition and amount should be based on measurements in several time slots, from peak hours to quiet moments. Desired and feasible maximum acceleration and deceleration rates are an important property of the vehicle and driver combination. These depend amongst other things on the type of vehicle, the tire profile, the overall condition of the car and the weather conditions. Acceleration rates should be simulated with variation between vehicles classes and their properties, resulting in many different maximum rates. Vehicles size and weight provide an estimation of the mass of the simulated vehicles. It is important that the simulation environment is aware of these properties of individual vehicles, to give a realistic impression of their movements. The dimensions of the road should also be simulated well, to ensure a realistic environment that can be compared to real world situations. (Archer, 2005) Simulation dependent factors The resolution of simulation time is a parameter that has a significant effect on the performance of a simulation. To simulate the interaction between vehicles, a high time resolution (with small time steps, tenths of seconds) is needed. This will make the simulation of vehicle behaviour more realistic and real-time. However, Archer (2005) cites Brackstone and McDonald in their study on traffic modeling, claiming that a time resolution of one second might give a more realistic picture of driver control processes (Archer, 2005). Drivers have to divide their attention between driving tasks, resulting in a lower reaction time, justifying a lower time resolution. Time resolution can therefore be chosen arbitrary, depending on the required use and level of detail. For the user-friendliness of the simulation model, some properties are required that make operating possible. It would help a lot if the source code of a simulation model is available, so that new features can be added and the underlying calculations can be understood easily. The environment should have an object oriented structure, making it possible to give parameters for every object (vehicle). The vehicles states, like position, current speed and acceleration and other properties, of every vehicle in the simulation have to be available for calculation any time, so the model must be able to output data to a (configurable) file. For calibration and validation purposes, almost all parameters have to be variable and adjustable.. Assessment of the Cooperative Intersection Safety System (IRIS) Bachelor Thesis for the University of Twente, Enschede. 26.
(28) SAFESPOT/IRIS dependent factors For the purpose of using the simulation model in combination with the SAFESPOT applications, some other minor properties are required. The simulation data should match the expected data from the platform, both in form and in content. This means that the output from the simulation to the DFM should meet the standards that are required for this platform. This requires some flexibility and adjustable output. The content should also meet certain requirements, like known coordinates that correspond with the SAFESPOT Local Dynamic Map (LDM) and vehicle states that are recognised by the platform. Conclusion Selection of the correct simulation environment to model traffic safety is bound by several requirements. These vary from driver behaviour modeling to environmental and vehicle properties. The overall properties of a certain model are also very important, because they provide the possibilities to simulate and the extent to which this can be done. In the next paragraph, several simulation models are described, allowing us to choose the most suitable environment for simulating the preferred intersection.. Available simulation models There are very many microsimulation models that are used to describe traffic flows. Most environments are essentially built for traffic distribution and planning purposes. Usually, it is not their specific goal to simulate traffic safety. Some models however are also applicable for use in the evaluation of safety. The most important models in the market are described in of this paragraph, supplemented with a list of less applicable models. AIMSUN The Advanced Interactive Microscopic Simulator for Urban and non-urban Networks (AIMSUN) was developed at the Polytechnic University of Catalunya in Barcelona, Spain. It can reproduce real traffic conditions in urban networks, using extensive driver behaviour models like car following, gap acceptance and lane changing systems. AIMSUN is able to simulate vehicles and other network elements like detectors and traffic regulators, due to the detailed modeling tools available. When the right parameters are given, AIMSUN can also model conflicts and incidents. AIMSUN can be linked to external regulating systems, allowing two-way communication. The model passes traffic details to an external system and is able to utilize the processed information that is sent back. According to Boxill & Yu (2000), this has for example been tested with the UK SCOOT UTC system, which is an adaptive traffic control system used in the United Kingdom. The program has also been interfaced to multiple other external codes and appears to be very suitable for that case. (Boxill & Yu, 2000; Gettman & Head, 2003) HUTSIM/SINDI The Helsinki University of Technology has built the HUTSIM program that specializes in the simulation of small networks. HUTSIM concentrates on a more specific and detailed simulation environment and driver behaviour model. Due to the main use in research, it does not have an intuitive graphical representation and is not very user-friendly in operation. There is no clear API available to introduce changes to the simulation rules.. Assessment of the Cooperative Intersection Safety System (IRIS) Bachelor Thesis for the University of Twente, Enschede. 27.
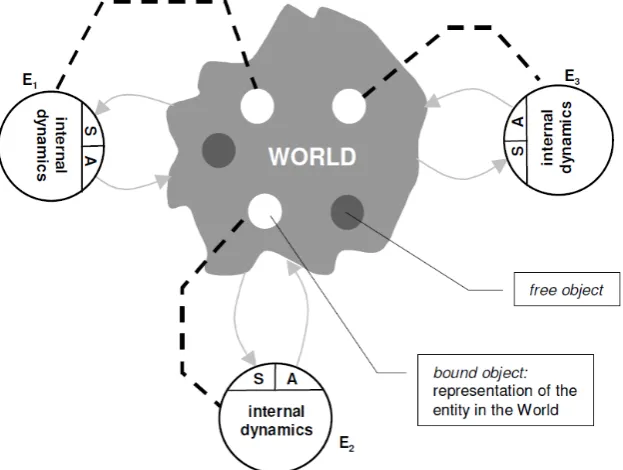
(29) The SINDI (Safety INDIcators) program is based on parts of HUTSIM. It is made by the Centre for Traffic Simulation Research in Stockholm, and focuses on one intersection at a time. The main goal of the program is traffic safety assessment through very detailed simulation. Its driver behaviour model takes into account the emotional state a driver is in. It differentiates mainly between aggression and fatigue as main forces behind the behaviour of a driver. In extreme states of these emotions, decisions are made differently. A driver also has to cope with a constant attention shift that occurs when one is driving in traffic. This makes it harder to recognize safety problems and easier to make mistakes. This is also modeled by SINDI, in an attempt to create a very realistic environment to be able to calculate Surrogate Safety Measures. (Gettman & Head, 2003; Abdoelbasier, 2005) MARS The Multi-Agent Real-time Simulator (MARS) is a simulation environment created by TNO in the object-oriented Java language. It is based on a World Model, which consists of roads and roadside objects. These static entities are predefined upfront. MARS makes it possible for other entities, like vehicles or other road users to move through this world. They have their own view on the model world, created by a Local Dynamic Map and filled with input from their sensors. They can act based on their observations and adjust their movements accordingly. The vehicles use Simulink models to generate their own path through the world. (Abdoelbasier, 2006) Driver en vehicle behaviour is simulated very detailed in MARS. It uses extensive lane changing and gap-acceptance models, with the possibility to tweak the settings to the required values. This makes it very easy to represent real world vehicles and driver behaviour. The vehicles in MARS are equipped with various sensors, which can be adapted by adding errors. Through this option, it is possible to research the effects of, for example, the bias of a GPS sensor in a vehicle on the position of the vehicle in the world. MARS is not yet wide-spread in the traffic engineering world, because it is still under construction and used primarily for research internally at TNO. TNO has provided the partners in the SAFESPOT project with limited access to the source code of MARS, so new technologies and functions can be developed. This development is still in an early stage however, only allowing users to use a simple World Model (a straight road or a Tintersection). A world model builder is included in the program, but is not available in SAFESPOT. Paramics Paramics, or “Quadstone Paramics” is a microscopic traffic simulation model that was originally developed in Scotland. It does simulations on different scale levels and can be used for various purposes. The network inside the simulation environment consists of links, connected by nodes. Links can be equipped with regulations, according to the traffic rules that apply to that section of road. The traffic flows through the network are based on an Origin-Destination matrix. (Abdoelbasier, 2005) Paramics uses a lane changing and car-following model that assigns every vehicle to a vehicle type with its own behavioural and technical properties. These properties include driver aggressiveness and familiarity with the environment, and vehicle dimensions, weight, age and speed limits. Simulation time resolution varies from 0.01 seconds to 0.5 second, allowing from very detailed to coarser simulation.. Assessment of the Cooperative Intersection Safety System (IRIS) Bachelor Thesis for the University of Twente, Enschede. 28.
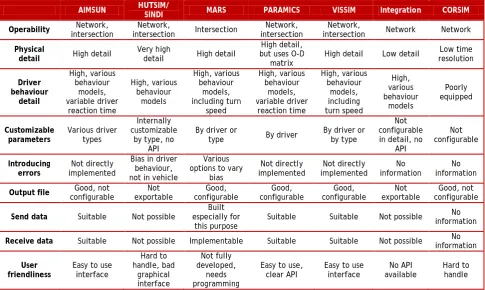
Figure

+7


Related documents