MECHANICS OF UNDERWATER LOCOMOTION IN DIVING
DUCKS: DRAG, BUOYANCY AND ACCELERATION IN A
SIZE GRADIENT OF SPECffiS
BY J. R. L O W O R N * , D. R. JONES AND R. W. BLAKE
Department of Zoology, University of British Columbia, Vancouver, BC, Canada V6T 2A9
Accepted 16 May 1991
Summary
1. The effects of accelerational swimming and body size on mechanical energy costs of diving were examined by comparing canvasback (Aythya valisineria Wilson), redhead (A. americana Eyton) and lesser scaup (A. affinis Eyton) ducks (mean body mass 1.275, 1.013 and 0.817kg, respectively) in steady versus unsteady models of locomotion. Steady models assume constant speed, whereas unsteady models incorporate acceleration and deceleration with each propulsive stroke.
2. The surface areas of the ducks increased linearly with body mass (r2=0.96), with all species falling on the same curve.
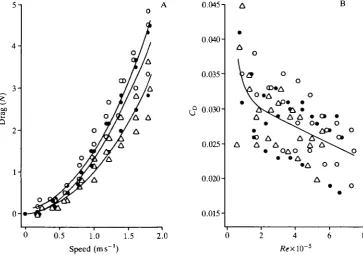
3. Body drag D of frozen ducks towed under water increased with body mass M and speed U according to the relationship:
D = - 0.946+ 0.826M + 0.614C/+0.825t/2, ^ = 0 . 9 5 .
4. In kinematic analyses, regression curves of percentage of total stroke distance versus percentage of stroke duration did not vary within individuals, sometimes varied between individuals and always varied between species. In diving ducks, analyses of a single sequence per individual and several individuals per species will usually provide an accurate kinematic description for the species.
5. The degree of acceleration and deceleration during a stroke increased with decreasing body size among species.
6. The power phase lasted for 66-70% of stroke duration, and the ducks accelerated for the first 84 % of this phase. During the power phase, work against drag was 10-12%, work against buoyancy was 36-38%, and inertial work in acceleration was 49-54% of the total mechanical work done.
7. Mechanical energy costs of descent, as estimated by the unsteady model, were 47-75% higher than estimates from the steady model. Accelerational stroking had greater effects on descent costs as body size decreased.
* Present address: Department of Zoology and Physiology, University of Wyoming, Laramie, WY 82071, USA.
90 J. R. LOWORN, D. R. JONES AND R. W. BLAKE
8. According to the unsteady model, the mechanical energy costs of descent were 2.9-3.2 times the costs of staying at the bottom. The relative difference between costs of descent and bottom phases increased with decreasing body size.
9. Comparison of steady versus unsteady models of propulsion revealed that, in terms of mechanical energy, the expected trend of decreased cost of transport (Jkg~J m"1) with increasing body size occurs only if unsteady (inertial) effects are considered.
10. Because of large differences between mechanical costs of descent and bottom phases, 'costs of diving' measured as oxygen consumption between dives are strongly affected by relative times spent descending and at the bottom. Such effects increase as body size decreases. Estimates of the efficiency of locomotion during dives must consider differences in dive phase.
Introduction
Most aquatic locomotion is unsteady (Daniel, 1984; Daniel and Webb, 1987). Unsteady locomotion involves acceleration and deceleration with each propulsive stroke, as opposed to movement at constant (steady) speed. Factors affecting resistance to change in inertia during unsteady swimming include body mass, body volume and surface area. Body volume determines the added mass of entrained water, and surface area affects body drag which increases as the animal accelerates. Thus, one might expect that body size would strongly affect transport costs through its implications for unsteady motion.
Investigation of unsteady motion requires kinematic analysis. Film analyses are expensive and time-consuming, so often only a single sequence of a single individual is digitized (e.g. Gal and Blake, 1988). Partly because of variation in individual behaviour, quantitative kinematic descriptions are often viewed as suitable only for qualitative comparison across wide ranges of body size or locomotor mode (Webb, 1988). Classically, this issue has not been a problem; the study of animal locomotion has focused on just such broad-scale comparisons of diverse locomotor modes or body sizes (e.g. Emerson, 1978; Clark and Bemis, 1979; Vleck etal. 1981; Taylor ef ai 1982; Schmidt-Nielsen, 1984; Webb and Blake, 1985) or of similarly sized animals with divergent locomotor strategies (e.g. Baudinette and Gill, 1985; Gal and Blake, 1987). A key generalization from these studies is that cost of transport (Jkg"1 m"1) decreases with increasing body size, although mechanisms for this trend are not well understood for all forms of locomotion (Daniel and Webb, 1987).
In contrast, we were interested in the implications of unsteadiness for actual energy-cost measurements, and in the generality of an unsteady kinematic model for diving ducks of rather similar size and locomotor pattern. Differences were not expected to be great, so individual variation became important in adequate sampling to detect subtle patterns. We therefore used a replicated experimental design that allowed us to quantify variation within and between individuals and species, and to test statistically for differences in kinematic parameters.
respirometry (Bennett, 1985). Oxygen consumption of freely diving birds can be measured only between dives, so that values for the power requirement of diving in ducks combine the costs of descent, staying at the bottom and ascent (Woakes and Butler, 1983; Takekawa, 1987). However, energy costs of these three dive phases are expected to differ (Stephenson et al. 1989), so that dives of varying duration or depth (and thus relative times spent at the bottom) should have different power averages.
The purposes of this study were (1) to compare costs of descent and staying at the bottom based on a steady model of locomotion versus an unsteady model that considered acceleration during periodic stroking; (2) to investigate effects of body size on estimates from these models; and (3) to evaluate effects of individual, intraspecific and interspecific variation on kinematic analyses of diving in ducks.
Materials and methods
Study animals
Eggs of wild canvasbacks {Ay thy a valisineria), redheads (A. americana) and lesser scaup (A. affinis) were collected from nests near Minnedosa, Manitoba, hatched in an incubator, and shipped to holding facilities at the University of British Columbia. Ducks were kept outdoors in concrete ponds 0.5-1 m deep, where they were fed mixed grain and poultry ration ad libitum on platforms. We regularly encouraged ducks to dive by throwing grain into the water. Water temperature in the ponds ranged from 2 to 16°C over the course of the study.
Body mass, length, volume, buoyancy and added mass
After capture from holding ponds, ducks were allowed to dry and preen for 2h before processing. Body mass was measured to the nearest gram with an Ohaus triple beam balance. Body length (to the nearest millimetre) was measured as total length of a bird laid flat on its back minus the length of tail feathers. Body diameter was calculated from circumference measured with a cord.
92 J. R . L O W O R N , D. R . J O N E S AND R. W. BLAKE
acceleration (9.81 ms~2)]. The buoyancies of 34 lesser scaup, 17 redheads and 14 canvasbacks were measured between 26 January and 11 February, and of four redheads on 15 June. Bonferroni multiple comparisons (Neter and Wasserman, 1974) were used to test for differences among species. Our buoyancy values do not account for predive exhalation or suppression of the plumage air layer by freely diving birds; no methods for measuring these effects currently exist (Loworn, 1991). Effects on buoyancy of pressure with depth are analyzed in detail elsewhere (Loworn and Jones, 1991a).
Added mass Ma, the mass of entrained water accelerated along with the body,
was calculated as ocpV, where or is the added mass coefficient, p is the density of water and Vis body volume. The added mass coefficient was taken to be 0.2, based on a plot of added mass coefficient versus fineness ratio (length/diameter) of spheroids (Daniel, 1984) (fineness ratios of ducks are given in Table 1). The force
G required to accelerate the body was calculated as:
G= -(Ma+M)(dU/dt), (1)
where M is body mass, U is speed and t is time (Daniel, 1984).
Surface areas
Three individuals each of canvasbacks, redheads and lesser scaup were killed painlessly by injection of sodium pentabarbitol in the tibiotarsal vein, and their surface areas measured before freezing. Three other redheads were measured after they had been frozen for 1-2 months.
Surface areas were measured by taping polyethylene film snugly around the ducks' bodies without compressing the plumage, tracing the removed film on paper, and then weighing the traced sections of paper (Walsberg and King, 1978). Surface areas of the bill and the feathered body excluding legs and feet were measured separately. Five measurements of a single redhead yielded coefficients of variation of 2.8 % for the feathered body (mean±s.D. = 793±22cm2) and 2.1 % for the bill (30± l c m2) .
Drag
Drag was measured in a tow tank at the BC Research Ocean Engineering Center. A carriage towed the birds at constant speed in a tank 3.7 m wide, 2.4 m deep and 61 m long. The vertical bar on which ducks were mounted was attached to a load cell wired to a computer for data collection and processing (for details see Stephenson et al. 1989). The ducks were positioned over three body diameters below the water surface to avoid drag augmentation from surface effects (Hertel, 1966). Water temperature was 15 °C. The ducks were packed in dry ice except during drag measurements, when their plumage remained smooth and appressed to the body, as in live birds.
Drag was measured for three individuals of each species at intervals of 0.2 m s "1 over a range of 0.2-1.8 m s "1. Drag of the bar was measured separately, and a regression based on these data was used to estimate bar drag at given speeds (A3AR = -0.0748+0.206£/+0.140[/2,r2=0.99, P<0.001). Estimated bar drag was subtracted from total drag to yield drag of the duck.
We calculated Reynolds numbers (Re) for each individual of body length L at each speed U as Re=UL/v, where v is the kinematic viscosity of water. Corresponding drag coefficients CD were calculated as CD=2D/pSBFU2, where
SBF is the surface area of bill and feathered body.
Speeds and stroke rates
Vertical speeds and stroke rates were determined from video recordings. Ducks were filmed diving in a tank 2.5m high, 0.8m from front to back and 1.2m wide. The back and sides of the tank were made of plywood painted white, and the front was of clear Plexiglas. Water depth was kept at either 1.2 or 2 m by standpipes that drained continuously flowing water. A platform (21 cm X 61 cm) hanging from the side of the tank allowed ducks to leave the water to rest and preen.
Ducks were trained to feed on mixed grain placed in an iron pan lowered to the bottom of the tank. The birds began feeding regularly from the pan in 1-6 days; some individuals would not dive and were replaced. For all filming, two ducks of the same species were put in the tank together, and were distinguished in films either by sex or by white plastic leg bands. Ducks were removed from the tank immediately after the last films had been made, and no longer than 4 days after filming began. Body mass, volume and buoyancy were measured when the birds were removed from the tank. Change in body mass while birds were in the tank (in grams per 24 h) ranged from —13.0 to —36.7 for eight canvasbacks, +8.2 to —37.2 for nine redheads, and —5.5 to —19.9 for nine scaup, depending on time in the tank and patterns of feeding behaviour. Thus, there was an unknown and variable difference between body mass when birds were removed from the tank and body mass when filming was done. Water temperature in the tank varied from 3.0 to 10.5°C during video filming.
94 J. R. L O W O R N , D. R. J O N E S AND R . W . B L A K E
a video monitor, when vertical speeds were timed with a stopwatch, stroke rates counted with the film in slow motion and dive trajectories to the bottom sketched. Some individuals, especially redheads, consistently took very linear, vertical paths to the bottom, whereas others, particularly scaup, tended to dive in an arc or at an angle across the tank. Dives in which ducks took unusually nonlinear paths or hesitated on the way to the bottom were excluded from analyses. Thirty to 40 dives per individual were described. At a water depth of 1.2 m, we analyzed 305 dives from eight canvasbacks, 360 dives from nine redheads, and 320 dives from eight lesser scaup. These data were not normally distributed, so medians and 15-85 % quantiles are reported.
Kinematics
Dive sequences were filmed at high speed with a Locam model 51 cine" camera, with a 1:1.8, 16 mm, 15-60m zoom lens. Eastman 1211A-X reversal film, ASA 320, was shot at lOOframess"1 at f/1.8. Filming was done during the day when light from a window above the tank obviated the use of floodlamps. Water depth was 2 m. A rectangular viewing area 53 cm high and 65 cm wide was delineated on the Plexiglas front of the tank with black tape. The top of this viewing area was 23 cm below the water surface. The camera was placed 2 m away from the Plexiglas front, with the lens at the same height as the centre of the viewing area, and the camera's field of view focused to fit the edges of this space. The camera was manually turned on when a duck began a dive, and turned off when the duck had descended past the viewing area. Filming was done from 19 July to 16 October, when water temperatures in the tank varied from 11.5 to 14.5°C.
Films were later inspected for sequences in which birds completed an entire stroke without turning to either side. We selected four sequences each for four canvasbacks, three sequences each for three redheads, four sequences for a fourth redhead, three each for two scaup and four for a third scaup. These sequences were then projected frame-by-frame on the screen of a P.A.L. photographic analyser (model 2AE-76), and the outline of the duck and its legs and feet was traced onto thin paper taped to the screen. The black tape marking the viewing area on the image served as a reference for measuring distance moved between frames. The position of the tip of the bill in successive frames was then plotted from individual tracings, and outlines of the feet were used to determine the beginnings of power and recovery strokes.
The distance of ducks from the Plexiglas front varied in different dives, so the exact distance moved between frames in different film sequences could not be compared absolutely. We also wished to compare different species which moved different average distances per stroke and at different speeds. Consequently, displacement of the bill in successive frames was expressed as a percentage of total stroke distance as measured on the tracings, and plotted against percentage of total duration of the stroke.
obtained by the model y=a+bx+cx4+dxs. This model was subsequently used to
fit all curves of percentage of total stroke distance versus percentage of stroke duration, which allowed general linear tests (Neter and Wasserman, 1974, pp. 160-165) for differences between curves within and among individuals and species.
Work against drag, buoyancy and acceleration
Displacements at 0.01-s intervals were calculated by applying the curves for percentage of stroke distance versus percentage of stroke duration for each species (see above) to average distance per stroke for that species (from video record-ings). Based on these displacements, work against drag, buoyancy and acceler-ation were calculated at 0.01-s intervals and integrated to yield work against these respective forces throughout a stroke.
Drag work was computed by multiplying instantaneous displacement by the drag at that velocity given by equation 3 in the Results. The value for body mass used in that equation was the average mass for the species (Table 1). Work against buoyancy was calculated as the average buoyancy for the species (Table 1) times the instantaneous displacement. Work done in acceleration was calculated by multiplying the sum of body mass and added mass (='virtual mass') by instan-taneous acceleration and by instaninstan-taneous displacement.
To compare work against different forces, work against drag, buoyancy and acceleration was computed for the power phase of the stroke only. Mechanical work against drag and buoyancy continues throughout the recovery phase of the stroke, but that work is done passively by means of momentum accumulated through acceleration during the power phase. During recovery, negative work from deceleration matches the positive, passive work against drag and buoyancy, so all three sum to zero. The value for total work during the power phase of a stroke was multiplied by average strokes per metre (from video recordings) to yield work per metre during descent.
To calculate work done at the bottom, it was reasoned that a bird had to progress downwards with each stroke the distance it would otherwise float upwards during the time required for a stroke. The distance S the duck would float upwards during a stroke duration t is given by:
/ t \ (2)
where Uo is initial velocity (equal to zero), Mv is virtual mass (body mass plus added mass) and B/Mv is the acceleration imparted by the buoyant force. This
distance was then multiplied by buoyancy to yield work per stroke at the bottom.
Results
Body size and shape
96 J. R. L O W O R N , D. R. JONES AND R. W. BLAKE
Table 1. Body size and shape parameters (mean±s.D.) of male diving ducks
Variable N
Body mass (g) Body volume (ml) Buoyancy (N) Body length (mm) Body diameter (mm) Fineness ratio Frontal area (cm2) Web area (both) (cm2)
Canvasback 10 1275 ±73 1828±74 5.4210.25 471 ±5 125±4 3.77±0.13 122.8±8.3 91.713.8 Redhead 14 10131120 14961138 4.7210.44 43719 11714 3.7510.12 107.117.2 77.014.2 Lesser scaup 18 817191 1146+89 3.2210.43 35918 10814 3.3310.16 91.616.6 58.713.5 Maximum diameter and frontal area include folded wings.
All values differ between species (P<0.05) except fineness ratios (length/width) of redheads and canvasbacks.
intermediate between scaup and canvasbacks in all measurements, except that redheads were closer to canvasbacks in buoyancy and web area. Fineness ratios (length/diameter) of redheads and canvasbacks (Table 1) were not significantly different, indicating close geometric similarity (Schmidt-Nielsen, 1984). The fineness ratio of lesser scaup was 13 % less than that of the other species, probably because of the longer necks of redheads and canvasbacks.
Surface area
For canvasbacks, redheads and scaup combined, body mass M explained 96% of the variation in surface area SBF, which included bill and feathered body but not
legs and feet (Fig. 1). Measurements for three previously frozen redheads, whose plumage might have been depressed while packed in the freezer, were not different from those of freshly killed ducks. Bill surface area averaged 3.2%
( S . D . = 0 . 2 % , /V=12) of SBF. The allometric equation for estimating feathered
body surface area (without bill) from body mass (range 547-1324 g) was 5F = 15.2M0595 (r2=0.92, P<0.001, N=12). The linear regression (Fig. 1) was more accurate than the allometric relationship, and was used in subsequent calculations.
Drag
red-
1000-
800-
600-5 B F = 0 . 6 1 1 M + 3 4 600-5
/=0.96, P<0Ml
A / A
A
o
400 600 800 1000
Body mass (g)
1200 1400
Fig. 1. Regression of the surface area of bill and feathered body excluding legs and feet (SBF) versus body mass (M) for canvasbacks (O), redheads (•) and lesser scaup
(A). Circled points are for redheads frozen 1-2 months before measurement.
heads Z)=0.0989+1.206£/2, r2=0.93; and for scaup D=0.0956+0.928£/2, r2=0.93 (P<0.001 for all curves).
For all species combined, regression of drag D (in N) on body mass M (in kg) and speed U (in ms"1) yielded the equation:
D = - 0.946 + 0.826M +0.614*7 +0.825C/2 (3)
r2=0.95, P<0.001, syx=0.294. Inclusion of body length did not improve this
regression. The relationship between drag D and Reynolds number Re was best fitted by an allometric equation for Re values less than 105 (CD=0.201JRe~0156) and a linear regression for Re values of 105 or greater (CD=0.033—1.27xlO~8i?e, r2=0.25, P<0.001) (Fig. 2B). The relative imprecision of the allometric relation-ship led us to use the multiple regression (equation 3) in subsequent modelling.
Descent speeds and stroke rates
98
J. R . L O W O R N , D. R. J O N E S AND R. W. B L A K Erelative to body size, primarily by increasing the distance moved per stroke. This difference might have been an artefact of their more linear trajectories, as discussed below. 5-i 4
-g
C3 Q 3- 2- 1- 0-0.5 1.0 Speed (ins"1)1.5 2.0
0.045-
0.040-
0.035-j 0.035-j1
0.030- 0.025- 0.020- 0.015-A A 1 \ \ A O a
\°
A c A o • A &-> • ^ A • o OA A • »
A fi~^\ •A
• A O
[image:10.451.45.409.126.383.2]A B O O o o » o
Fig. 2. Regression curves relating (A) body drag to speed (see text for equations and statistics); and (B) drag coefficient CD to Reynolds number (Re) for frozen
canvas-backs (O), redheads ( • ) and lesser scaup (A) towed underwater. In A, the uppermost curve is for canvasbacks, the middle curve for redheads and the lowest curve for scaup. In B, there is a composite curve for all three species (see text).
Table 2. Median vertical speeds, distances per stroke and stroke rates of ducks
descending to a depth of 1.2 m
Species Canvasback Redhead Lesser scaup (0 (0 (0 Speed (rns"1)
0.93 .81-1.11) 0.91 .81-1.04) 0.68 .58-0.80) Stroke length (mstroke"1)
(0 (0 (0 0.24 .20-0.30) 0.20 .20-0.24) 0.15 .14-0.18) Stroke length per body length (m stroke"1 m"1)
0.52
0.47
0.43
Stroke length per mass (m stroke"1 kg"1)
0.191
0.201
0.188
See Materials and methods for sample sizes.
Quantiles (15-85 %) for measured variables are in parentheses.
Stroke rate (Hz) (3 (3 (4 3.6 .4-3. 4.2 .9-4. 4.5 .3-4. 8) 4) 8) Stroke rate per mass (Hz kg"1)
2.8
4.2
[image:10.451.32.425.464.614.2]6
-
5-
4-
3-
2-/ \
20 40 60 8C
Percentage of stroke duration
[image:11.451.125.322.80.320.2]100
Fig. 3. Regression curves of percentage of stroke distance versus percentage of stroke duration for descending canvasbacks (bold dashed line), redheads (solid line), lesser scaup (light dashed line) and all species combined (circles). See text for sample sizes, equations and statistics.
Patterns of acceleration
Regression curves of percentage of total stroke distance versus percentage of stroke duration (Fig. 3) did not vary within individuals of any species (general linear tests comparing 3-4 curves per individual, P>0.05).
Among canvasbacks, curves for two males (mass=1.027 and 1.074kg, buoyancy=5.92 and 6.05 N, respectively) did not differ, but curves for two females (0.777 and 0.930 kg, 4.71 and 5.45 N) differed from curves for the males and from each other. The regression for all canvasbacks combined explained 69 % of the variation, whereas the curve for males alone explained 74% and for the two females 81 and 66% of the variation.
In redheads, curves for two males (mass=0.895 and 0.926kg, buoyancy=5.17 and 5.34N) and one female (0.862 kg, 4.67 N) were the same, but differed from the curve of another male (0.770 kg, 4.82 N). The regression for all redheads combined explained 81 % of the variation, whereas the curve for the three similar individuals explained 79 % and that for the differing individual 91 % of the variation.
100
J. R. L O W O R N , D. R . J O N E S AND R. W. B L A K EDisplacement-time curves for each species (Fig. 3) all differed significantly. The degree of acceleration and deceleration during a stroke increased with decreasing body size. Equations relating percentage of stroke distance y to percentage of stroke duration * (P<0.0001) were:
for canvasbacks,
y = 1.40 + 0.108* - 3.90 x l ( T V + 2.89 x 1CTV , r2=0.69, syx=Q.15;
for redheads,
y = 1.27 + 0.133* - 4.29 x l ( r V + 3.09 x 1 0 " V , r2=0.81, 5^=0.66;
for lesser scaup,
y = 1.2,1 + 0.143* - 4.38 x 1(T7*4 + 3.11 X 10"9*5 , r2=0J5, ^.,=0.86;
and for all species combined,
y = 1.35 + 0.124* - 4.14 x 10"7*4 + 3.02 x 1 0 ~ V , r2=0.67, syx=0.89.
Work due to drag, buoyancy and acceleration
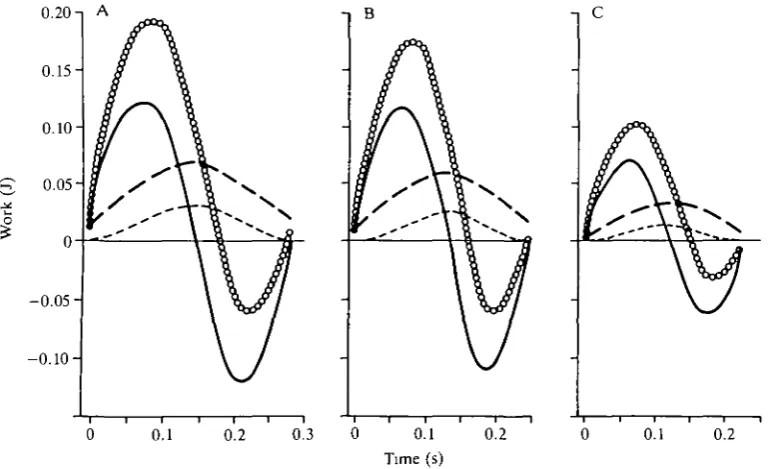
Time curves for calculated work due to drag, buoyancy, acceleration and to all three combined (Fig. 4) show the importance of acceleration in patterns of total work throughout the stroke. Tracings of foot position for all 39 dives analyzed
0.20 -i A -i C
[image:12.451.35.421.346.580.2]0.1 0.1 0.2
frame-by-frame indicated that the curve for total work becomes negative (Fig. 4) when the recovery stroke begins. This point occurred at 66, 68 and 70 % of stroke duration for canvasbacks, redheads and scaup, respectively. Acceleration oc-curred during the first 84% of the power phase.
We calculated mechanical work during the power phase of the stroke for the 10 canvasbacks, 14 redheads and 18 lesser scaup in Table 1, which differ in body mass, volume (thus added mass), buoyancy and mass-specific drag (from equation 3). Averages ( ± 1 S . D . ) of total work in the power phase were 2.44±0.08 J stroke"1
for canvasbacks, 1.91±0.16Jstroke~1 for redheads and 1.01±0.07 Jstroke"1 for scaup.
Despite interspecific differences in distance-time curves (Fig. 3), the pro-portion of mechanical work done against different forces in the power phase varied little among species. Percentage work against drag varied significantly among species (general linear test, P<0.05), but only decreased from 12.5% in canvasbacks to 10.4 % in scaup. Work against buoyancy did not vary significantly, decreasing from 38.0% of total work in canvasbacks to 35.8% in scaup. Proportion of total work done in acceleration differed between canvasbacks (49.5 %) and scaup (53.8 % ) , but neither differed from redheads (52.2 % ) . In the power phase, work done to accelerate the body was about equal to that done against drag and buoyancy combined.
Steady versus unsteady models
We calculated mechanical power and mechanical cost of transport during descent with both steady and unsteady models. The steady model considered only the resistance of drag and buoyancy to a body moving at constant speed (Stephenson et al. 1989). Average vertical speeds and stroke lengths were taken from Table 2, body mass and buoyancy from Table 1, and drag was calculated from equation 3.
[image:13.451.40.414.530.624.2]Mechanical cost estimates for descent were 47-75 % higher when effects of unsteady swimming were considered (Table 3). Mass-specific power estimates from both models decreased with decreasing body size. By the unsteady model, mechanical cost of transport for canvasbacks was, as expected, less than that for
Table 3. Mechanical energy costs of descent by male diving ducks (Table 1) as
estimated by steady and unsteady models of locomotion
Power requirement Cost of transport (Wkg-1) (Jkg-1™-1)
Percentage Species Steady Unsteady Steady Unsteady difference
Canvasback 4.97 7.30 5.34 7.85 47 Redhead 5.25 8.40 5.78 9.24 60 Lesser scaup 3.12 5.46 4.59 8.04 75
102 J. R. LOWORN, D. R. JONES AND R. W. BLAKE
Table 4. Median stroke rates (with 15-85 % quantiles) and mechanical power
requirements of staying at the bottom, and the ratio of power requirements of descent PD (unsteady model, Table 2) and staying at the bottom PB
Power Stroke rate requirement
Species (Hz) (Wkg"1) PD:PB
Canvasback 2.8(2.6-3.0) 2.51 2.91 Redhead 3.3(3.1-3.4) 2.54 3.31 Lesser scaup 3.6(3.4-3.7) 1.69 3.23
scaup. However, because of the very rapid descent of redheads relative to body mass, their cost of transport was higher than that of canvasbacks. The steady model actually predicted an increase in cost of transport from scaup to canvas-backs, despite a 56 % increase in body mass. For all species, effects of acceleration increased with decreasing body size.
Based on equation 2, the effective distance moved per stroke at the bottom (1.2 m depth) was 0.211m for canvasbacks, 0.165 m for redheads and 0.119 m for scaup. The power requirement at the bottom (Table 4) was much less than during descent (Table 3). Based on the unsteady model, mass-specific energy costs at the bottom decrease with increasing body size. Thus, overall 'costs of diving' will vary between dives of different duration and depth, with different proportions of time spent at the bottom. The importance of this effect generally increases as body size decreases.
To assess the accuracy of steady and unsteady models, calculations were compared with oxygen consumption (VO2) data for tufted ducks (Aythya fuligula)
(Woakes and Butler, 1983). This species is very similar to lesser scaup in body size, shape and behaviour. Body volume V (in litres) of tufted ducks used by Woakes and Butler (1983) was calculated from average mass M (in kg) as
V=0.339+0.971M (r2=0.82, sy.x=A1.2, P<0.001), based on measurements of 34
lesser scaup. Average mass of the tufted ducks (N=6) was 0.597 kg, yielding a body volume of 0.9191 and a buoyancy of 3.15 N.
Stroke rates and speeds of descent and ascent were assumed to be the same as for lesser scaup diving to a depth of 1.2 m (Tables 2 and 4; 0.78 m s "1 during ascent). For an average dive duration of 14.4s in water 1.7m deep (Woakes and Butler, 1983), time spent descending would be 2.5s, time spent ascending 2.2s and, by subtraction, the time spent at the bottom would be 9.7s.
The metabolic power requirement during ascent, which is passive, was assumed to be equal to the resting metabolic rate in the same experimental tank (3.28 W; Woakes and Butler, 1983). For an ascent time of 2.2 s, the metabolic requirement during ascent would be 7.2 J. This value was subtracted from the measured (Vo2) overall cost of the dive of 164.2 J (Woakes and Butler, 1983) to yield a cost for descent and bottom phases combined of 157 J.
Table 5. Mechanical work (in joules) by tufted ducks in a dive of 14.4s to a depth of
1.7 m, as estimated from steady (Stephenson et al. 1989) and unsteady models of locomotion
Model Descent At bottom Total
Steady 5.94 20.78 26.7 Unsteady 9.27 17.15 26.4
sum of buoyancy and drag calculated from equation 3. Work at the bottom was estimated by multiplying the calculated work against buoyancy during descent by the ratio of the durations of the bottom and descent phases (Stephenson et al. 1989).
For the unsteady model, mechanical work against drag, buoyancy and acceler-ation was integrated over the power phase of the stroke to yield work per stroke, and this value was multiplied by the 11 strokes required to reach the bottom (Table 2). Work done at the bottom was calculated on a per stroke basis as described earlier, and multiplied by the 35 strokes completed in 9.7 s (Table 4).
Estimates of total mechanical work done by tufted ducks during descent and bottom phases did not differ between steady and unsteady models (Table 5). Based on a power input of 157 J (see above), aerobic efficiency (mechanical power output/aerobic power input) calculated from both models is high at around 17 %. However, similarity of estimates from the two models is largely coincidental. Model estimates would diverge rapidly with changes in water depth or dive duration, which would alter the relative time spent descending and at the bottom.
Discussion
Surface areas
The strong relationship between surface area of the bill and feathered body (SBF) versus body mass for the three species (Fig. 1) justifies using this equation for other Aythya spp. A similarly tight relationship exists between buoyancy and body mass for all subfamilies of North American ducks weighing less than about 1200 g (Loworn and Jones, 19916), a relationship that is not improved by considering body length or a composite, principle-component measure of struc-tural size (Loworn and Jones, 1991a). Above 1200 g, data for eiders (Somateria
mollissima) and white-winged scoters (Melanitta fused) indicate that the
relation-ship of buoyancy to body mass curves strongly upwards. This suggests that plumage thickness and surface area relative to body mass are similar among ducks of small to medium size (including all Aythya spp.), but that the surface area curve in Fig. 1 may not apply to large sea ducks (Mergini) because of different scaling of air volumes in the plumage or respiratory system.
Walsberg and King's (1978) equation for estimating feathered body surface area (without bill) from body mass (5F=8.11M0-667) underestimated SF for Aythya spp.
104 J. R. LOVVORN, D. R. J O N E S AND R. W. B L A K E
of body mass (27-23 510 g) than did ours (547-1324 g). Walsberg and King also measured birds frozen in a perching position with neck retracted, whereas we measured ducks in a descent posture with head and neck extended. Higher surface areas of ducks might also result from greater plumage thickness than in terrestrial perching birds, which made up 11 of 12 species in Walsberg and King's sample.
Drag
Dead-drag measurements often underestimate effective body drag of animals that undulate while swimming, but such measurements are more realistic for diving ducks that hold their bodies rigid while the feet oscillate (Blake, 1983). We calculated body drag as the difference between the drag of the bird plus supporting bar, minus the drag of the bar measured separately. Drag of the bird plus bar is probably enhanced by interference drag, so our estimates of body drag are probably inflated by this amount (Pennycuick et al. 1988). For all species, drag of the isolated bar (see Materials and methods), as a percentage of total drag of the bird plus bar, increased from zero at 0.2 m s "1 to apeak at 1.0 m s "1, and declined at higher speeds. The maximum percentage ranged from 15.2 % in canvasbacks to 20.9% in scaup.
The relationship between drag coefficient Co and Reynolds number Re (Fig. 2B) incorporates effects of speed, body length and surface area, but explained only 25% of the variation in CD. The scatter is as large within as between species, so the poor fit does not result from lack of geometric similarity among species (see Pennycuick etal. 1988). For diving ducks weighing 0.5-1.3 kg, the multiple regression including body mass and speed (Fig. 2A) yields far better estimates of body drag (r2=0.95 versus 0.25) and does not require determination of surface area.
Individual variation and kinematic analyses
Statistical comparison of normalized distance-time curves (see Fig. 3) revealed no significant differences among 3-4 sequences per individual. Different indi-viduals within a species were more variable, and inspection of these curves suggested that variation resulted more from behavioural than from body size differences. In some cases, the variance explained by regressions for all individuals combined was greater than that explained by a regression for a single individual that differed from the others. Our data for ducks suggest that analysis of a single sequence per individual, and several individuals per species, will provide an accurate kinematic description for that species. Different species varying in size will probably differ in acceleration curves even when normalized, because of strong effects of body mass.
Cost of transport, body size and acceleration
size, primarily by increasing the calculated distance moved per stroke (Table 2). Consequently, their mechanical cost of transport does not scale with body size as expected (Table 3). This pattern apparently resulted from individual behaviour of the redheads in this study (7V=9), which consistently followed more linear, vertical trajectories than did the other species. Such trajectories might lead to greater calculated stroke length and vertical speed, without real differences in stroke length or speed relative to the water. In support of this interpretation, the normalized distance-time curves (Fig. 3) indicate that patterns of acceleration corresponded closely to body mass differences between species (Table 1).
In our tank, a bird could be anywhere from 1 to 65 cm away from the gridded backdrop, preventing consistent measurements of displacement relative to the grid as viewed from the camera. We attempted to restrict the birds' diving to a space near the front of the tank to reduce variation in their distance from the grid. This restriction simply prevented diving, and in any case might have altered normal locomotor patterns. In addition, there was variation in distance per stroke among dives within individuals, and probably between strokes within dives. This variation made averages desirable for quantifying consistent differences in kinematics between individuals and species. Our solution was to obtain large samples of descent speeds from video recordings, with the assumption that behavioural anomalies would become inconspicuous in large samples. However, the trajectories of redheads were consistently more linear than those of the other species.
Although the data for redheads confuse the pattern of mechanical cost of transport with body size (Table 3), comparison of values for canvasbacks and scaup, which differ in body mass by 56% (Table 1), indicates that the expected trend of decreasing cost of transport with increasing body size is obtained only from the unsteady model. Why is this so?
In the steady model, total work is calculated by multiplying the sum of buoyancy and drag by water depth. Because of the higher mass-specific buoyancy of canvasbacks (4.25 versus 3.94Nkg"1 for scaup), mass-specific work against buoyancy is 8% higher in canvasbacks (S.lOJkg"1) than in scaup (4.73.1kg"1). Drag increases with body mass and rises curvilinearly with speed (Fig. 2A). Drag work in canvasbacks (1.31 J kg"1) is 68% higher than in scaup (0.781kg"1), which accounts for 59 % of the difference in cost of transport between the species.
According to the unsteady model for a comparable dive to 1.2 m, mass-specific work against drag was 1.201kg"1 in canvasbacks versus 1.031kg"1 in scaup. For buoyancy work, the values were 3.64J kg"1 in canvasbacks and 3.541kg"1 in scaup. Values for work against drag and buoyancy cannot be compared directly between models, because in the unsteady model the work against drag and buoyancy during the recovery phase is done passively by means of momentum and is experienced by the duck's muscles as work to accelerate the body during the power phase. Nevertheless, mass-specific work against both drag and buoyancy in both steady and unsteady models is higher in canvasbacks than in scaup.
106 J. R. L O W O R N , D. R . J O N E S AND R. W. B L A K E
would not occur in either model because of drag or buoyancy. The expected trend occurs only if unsteady effects are considered.
Unsteadiness, differences in dive phases, and efficiency
Daniel and Webb (1987) identified two types of unsteady locomotion: periodic
versus accelerational. In the former, periods of acceleration alternate with an
unpowered glide phase, during which drag caused by body undulations is suspended. In accelerational locomotion (as in ducks), pulses of acceleration and deceleration occur in close succession without a glide phase, often with negative thrust developing during recovery. Daniel and Webb (1987) suggested that, in either aquatic or terrestrial environments, unsteady locomotion will have higher energy costs than the steady equivalent if energy is expended in both accelerating and decelerating the body. The relative cost of steady versus unsteady locomotion is less predictable if deceleration is entirely passive and if the net resistance to forward motion is unchanged (e.g. if drag is not reduced by gliding between strokes). In diving ducks, deceleration occurs passively towards the end of the power phase, and drag probably increases during the recovery phase when the legs and feet are brought forward. Accelerational stroking in ducks clearly increases locomotor costs above those predicted from a steady model.
When the obvious unsteadiness of underwater locomotion in ducks is explicitly modelled, important insights are gained into the meaning of oxygen consumption measurements. For benthic-feeding species, 'costs of diving' measured as VOl
between dives will be strongly affected by factors altering the relative time spent descending versus time at the bottom. Water depth and dive duration are principal among these factors. Furthermore, the importance of the relative duration of descent and bottom phases to average power requirements will increase as body size decreases. It appears that a major mechanism for the difference in energy cost between dive phases, as well as the change in that difference with body size, is acceleration during periodic stroking.
Measuring and explaining the efficiency of locomotion relative to body size and locomotor mode is a major theme in biomechanics and animal physiology (Stephenson et al. 1989; Blake, 1991). Given that muscle efficiency can change substantially with changes in power output (Hill, 1950), our model and measure-ments suggest that efficiency may differ between descent and bottom phases. For example, at the bottom, stroke rate decreased by 25-29%, while power output decreased by 291-323 % (Tables 2-4). Attempts to quantify locomotor efficiency based on interdive oxygen consumption should consider these dive-phase differ-ences, as well as their change in importance with body size. Such estimates of efficiency are required before the energy costs of diving can be estimated solely from body mass (from which volume and buoyancy can be estimated), water depth and dive duration.
•Jatural Science and Engineering Research Council of Canada. We thank G. A. Martinelli, R. Stephenson and R. F. Berry for assisting in buoyancy measure-ments, and the staff and students of the Delta Waterfowl and Wetlands Research Station for help in obtaining the ducks.
References
BAUDLNETTE, R. V. AND GILL, P. (1985). The energetics of 'flying' and 'paddling' in water: locomotion in penguins and ducks. /. comp. Physiol. B 155, 373-380.
BENNETT, A. F. (1985). Energetics and locomotion. In Functional Vertebrate Morphology (ed. M. Hildebrand, D. M. Bramble, K. F. Liem and D. B. Wake), pp. 173-184. Cambridge: Harvard University Press.
BLAKE, R. W. (1983). Fish Locomotion. 208pp. Cambridge: Cambridge University Press.
BLAKE, R. W. (1991). Efficiency and Economy in Animal Physiology. Cambridge: Cambridge University Press.
CLARK, B. D. AND BEMIS, W. (1979). Kinematics of swimming of penguins at the Detroit Zoo. /. Zooi, Lond. 188, 411-428.
DANIEL, T. L. (1984). Unsteady aspects of aquatic locomotion. Am. Zool. 24, 121-134.
DANIEL, T. L. AND WEBB, P. W. (1987). Physical determinants of locomotion. In Comparative
Physiology: Life in Water and on Land (ed. P. Dejours, L. Bolis, C. R. Taylor and E. R.
Weibel), pp. 343-369. Padova, Italy: Fidia Research Series IX, Liviana Press.
EMERSON, S. B. (1978). Allometry and jumping in frogs: helping the twain to meet. Evolution 32, 551-564.
GAL, J. M. AND BLAKE, R. W. (1987). Hydrodynamic drag of two frog species: Hymenochirus
boettgeri and Rana pipiens. Can. J. Zool. 65, 1085-1090.
GAL, J. M. AND BLAKE, R. W. (1988). Biomechanics of frog swimming. I. Estimation of the propulsive force generated by Hymenochirus boettgeri. J. exp. Biol. 138, 399-411.
HERTEL, H. (1966). Structure, Form and Movement. New York: Reinhold Publishing Corporation.
FLLL, A. V. (1950). The dimensions of animals and their muscular dynamics. Sci. Prog. 38, 209-230.
LOWORN, J. R. (1991). Mechanics of underwater swimming in foot-propelled diving birds. Proc.
int. Ornithol. Congr. 20 (in press).
LOWORN, J. R. AND JONES, D. R. (1991a). Effects of body size, body fat, and pressure with depth on buoyancy and costs of diving in ducks (Aythya spp.). Can. J. Zool. 69 (in press).
LOWORN, J. R. AND JONES, D. R. (1991b). Body mass, volume, and buoyancy of some aquatic birds, and their relation to locomotor strategies. Can. J. Zool. 69 (in press).
NETER, J. AND WASSERMAN, W. (1974). Applied Linear Statistical Models. Homewood, IL: R. D. Irwin, Inc.
PENNYCUICK, C. J., OBRECHT, H. H. AND FULLER, M. R. (1988). Empirical estimates of body drag of large waterfowl and raptors. J. exp. Biol. 135, 253-264.
SCHMIDT-NIELSEN, K. (1984). Scaling: Why is Animal Size so Important? 241pp. Cambridge: Cambridge University Press.
STEPHENSON, R., LOWORN, J. R., HEIEIS, M. R. A., JONES, D. R. AND BLAKE, R. W. (1989). A
hydromechanical estimate of the power requirements of diving and surface swimming in lesser scaup (Aythya affinis). J. exp. Biol. 147, 507-519.
TAKEKAWA, J. Y. (1987). Energetics of canvasbacks staging on an upper Mississippi River pool during fall migration. PhD thesis, Iowa State University.
TAYLOR, C. R., HEGLUND, N. C. AND MALOIY, G. M. O. (1982). Energetics and mechanics of terrestrial locomotion. I. Metabolic energy consumption as a function of speed and body size in birds and mammals. J. exp. Biol. 97, 1-21.
108 J. R. LOWORN, D. R. JONES AND R. W. BLAKE
WALSBERG, G. E. AND KING, J. R. (1978). The relationship of the external surface area of birds to skin surface area and body mass. /. exp. Biol. 76, 185-189.
WEBB, P. W. (1988). Simple physical principles and vertebrate aquatic locomotion. Am. Zool. 28, 709-725.
WEBB, P. W. AND BLAKE, R. W. (1985). Swimming. In Functional Vertebrate Morphology (ed. M. Hildebrand, D. M. Bramble, K. F. Liem and D. B. Wake), pp. 110-128. Cambridge: Harvard University Press.