MR of the Pituitary Gland Postsurgery: Serial MR Studies following
Transsphenoidal Resection
Thomas S. Dina, 1 ·5 Samuel H. Feaster, 1.3 Edward R. Laws, Jr. ,2
·4 and David 0. Davis 1
PURPOSE: To determine the MR appearance of the pituitary gland in the early and late postoperative periods in order to distinguish operative complications more effectively and to
establish a postoperative baseline. METHODS: Ten patients were prospectively studied with MR
following transsphenoidal resection of a pituitary tumor. Early postoperative studies were obtained at 2 to 8 days following surgery, late studies at 4 to 9 months in all patients and also at 12 to 16
months in five. Major observations were height of the pituitary mass and appearance of the surgical packing. RESULTS: Within 8 days following surgery, the height of the pituitary mass was
unchanged in two cases, increased in three, and only minimally decreased in five. All decreased in height (average 54%) by 4 to 9 months. Gelfoam packing completely (five) or nearly completely (three) resorbed leaving a normal-size, although deformed, pituitary gland. Fat-packed resection defects persisted (two). CONCLUSIONS: In the early postoperative period, the appearance of the
pituitary gland is similar in size to its preoperative appearance. Subsequent involution with packing
resorption yields a smaller, deformed pituitary gland.
Index terms: Pituitary gland, magnetic resonance; Pituitary gland, neoplasms; Magnetic resonance,
postoperative; Sella turcica, magnetic resonance
AJNR 14:763-769, May/Jun 1993
Magnetic resonance (MR) has become the pro-cedure of choice for the neuroradiologic diagnosis of pituitary tumors (1, 2). When there is positive correlation with laboratory and clinical findings, MR is usually definitive, obviating the need for further radiologic imaging even in those patients in whom surgical excision is indicated. Currently, the most commonly used surgical approach is the transsphenoidal microsurgical technique (3). Patient follow-up is primarily clinical,with appro-priate laboratory (hormonal) and visual field stud-ies. Imaging studies have played a supporting role in the follow-up of functioning adenomas and are the primary tool in following nonfunctioning
ad-Received April 14, 1992; accepted after revision September 2. Departments of 'Radiology and 2
Neurosurgery, The George Washing -ton University Medical Center, Washington, DC 20037.
3 Present address: Fort Sanders Radiology, 2001 Laurel Avenue, Suite
304, Knoxville, TN 37916.
' Present address: University of Virginia Health Science Center, P.O. Box 212, Charlottesville, VA 29908.
5 Address reprint requests to Thomas S. Dina, Department of Radiol-ogy, The George Washington University Medical Center, 901 23rd Street, NW, Washington, DC 20037.
AJNR 14:763-769, May/Jun 1993 0195-6108/93/1403-0763 © American Society of Neuroradiology
763
enomas (4). Follow-up imaging studies are not ordinarily obtained in the early postoperative period. With successful surgical cure or control of disease, imaging studies are normally obtained 6 to 12 months following surgery. However, an earlier postoperative study may be necessary in instances of possible surgical complications, lack of clinical and/or hormonal response or for radia-tion therapy treatment planning.
764 DINA
Materials and Methods
Ten patients were studied with MR following transs phe-noidal resection of a pituitary tumor. There were six women and four men, aged 21 to 66 years. All had clinical and laboratory evidence as well as MR findings indicative of an adenoma. Preoperative MR studies were obtained at various institutions including ours. All underwent nonenhanced studies; eight received gadopentatate dimeglumine (M ag-nevist; Berlex Imaging, Wayne, NJ). Two unenhanced stud-ies from outside institutions were sufficiently diagnostic of pituitary tumor to be acceptable for this study. Patients entered into the study were referred surgical candidates who underwent standard transsphenoidal removal of an adenoma without complication and who consented to early postoperative and follow-up MR examinations in addition to the standard 1-year follow-up.
Transsphenoidal removal of the adenoma was accom-plished through a standard transseptal approach to the sphenoid sinus. The sella floor was opened and a dural window was made through which the tumor was removed. The normal pituitary was spared whenever possible. The tumor resection cavity was packed with Gelfoam (The Upjohn Company, Kalamazoo, Ml) in eight patients. In those with a cerebrospinal fluid (CSF) leak (two patients), packing was achieved with a subcutaneous fat graft taken from the lower abdominal wall. One of these two patients also had packing of the cavernous sinus on one side with Gelfoam to control bleeding. The sella floor was reconstructed with an intradural stent of nasal bone (seven patients), nasal cartilage (two patients), or bone and cartilage (one patient). The sphenoid sinus was packed with fat in the cases of CSF leak, also with Avitene in one case to control venous bleeding. In the remaining patients, the sphenoid sinus was not packed. Surgical approach, tumor location, resection,
and packing material used within the tumor resection surgical defect were recorded by the surgeon. All of the surgical procedures were performed by the same neuro-surgeon.
After appropriate consent, immediate postoperative MR studies were obtained from 2 to 8 days following surgery. All were performed with a 1.5-T imager (Signa; GE Medical Systems, Milwaukee, WI). The initial imaging sequence included sagittal T1-weighted images (4.0-mm thick, no skip, 600/20 (TR/TE)) followed by coronal T1-weighted images (4.0-mm thick, no skip, 600/25, 16-cm field of view), and coronal long repetition time images (5.0-mm thick, 2.5-mm skip, 1800/30-70). After the intravenous administration of 0.1 mmol/kg gadopentetate dimeglu-mine, coronal T1-weighted images were repeated.
Late postoperative studies were obtained from 4 to 9 months after surgery and, in five patients, also at 12 to 16 months after surgery. Imaging parameters were basically the same for all studies performed at this institution or others.
The following were recorded: height of the pituitary mass, relationship to the optic chiasm, enhancement, vis
-ualization of the pituitary gland and stalk, and the appear-ance of the surgical packing within the sella and sphenoid
AJNR: 14, May/June 1993
sinus. Most observations, including measurements, were taken from coronal images. A few measurements were obtained with the distance measurement mode on the image display console; most used the scale printed on the image. Surgical observations noted and recorded included cavernous sinus invasion, intraoperative CSF leak, extent of tumor removal, and method of sella and sinus packing. Clinical and laboratory follow-up was obtained as clini-cally appropriate to confirm a favorable response to sur-gery. The sequential acquisition of laboratory data was not a controlled part of the study protocol. It was not the intent of the study to determine the earliest signs of recurrence, although the presence of either recurrent tumor growth on MR or a change in hormone levels from the postoperative baseline excluded a patient from the study.
Results
Of the 10 patients studied
,
two had
microad-enomas and eight macroadmicroad-enomas
.
Excess
hor-mone secretion among the macroadenomas was
prolactin in four
,
growth hormone in two
,
and
adrenocorticotropic hormone (ACTH) in one
.
One
patient had a nonfunctioning adenoma. One of
the two microadenomas had increased growth
hormone production, the other ACTH
.
On the preoperative MR scans
,
the pituitary
mass enhanced relatively homogeneously.
Hem-orrhage was present in three tumors, accounting
for a minor portion of the total mass in two and
the greater part of the mass in one. The pituitary
stalk entered the mass contralateral to the tumor
center in three cases
,
ipsilateral to the mass in
one case, and midline in one case
.
In five cases
,
the stalk position could not be located because
of the large size of the mass.
The pituitary mass was measured as the total
height of the adenoma and pituitary gland
.
Most
macroadenomas could not be separated from
normal pituitary gland preoperatively. The
maxi-mum height was measured from the sella floor
or inferiormost extent of the pituitary /tumor
mass to its most superior extent. In the immediate
postoperative period
,
two pituitary masses were
unchanged and three increased in height as
com-pared with the preoperative scans
.
The remaining
five were decreased in height but only minimally
compared w
i
th the height of the preoperative
mass (5
%-33%decrease in height) (Table 1)
.
On the early postoperative studies
,
enhance-ment was inhomogeneous with a nonenhancing
area that appeared to correspond to the site of
tumo
r r
esect
i
on and surgical packing
.
In three
cases
,
there was a thin peripheral enhancing rim
.
AJNR: 14, May/June 1993 POSTSURGICAL MR OF THE PITUITARY 765
TABLE 1: Pituitary Mass on Coronal MR
Preoperative Early Postoperative Late Postoperative
1 2 3 4 5 6 7 8 9 10
Adenoma Height Extension Height (mm) to Chiasm (mm)
PRL 18 0 13
GH 10 + 14
GH 18 0 18
PRL 15 ++ 13
NFA 33 +++ 33
PRL 18 + 16
ACTH 5 0 8
GH 40 +++ 38
PRL 40 +++ 27
ACTH 13 0 13
(Days)
(2 days) (3 days) (3 days) (4 days) (4 days) (3 days) (8 days) (3 days) (3 days) (3 days)
Extension Height Extension
Packing to Chiasm (mm) (Months) to Chiasm
G 0 4 (6.5 mo) 0
G ++ 11 (5.5 mo) +
F + 12 (4 mo) 0
F ++ 6 (7 mo) 0
G +++ 14 (4 mo) 0
G 0 5 (4 mo) 0
G 0 4 (6 mo) 0
G +++ 11 (6.5 mo) 0
G 0 16 (9 mo) 0
G 0 6 (8 mo) 0
Note.-Key: Adenoma: PRL = prolactin secreting; GH = growth hormone; ACTH = adrenocorticotropic hormone; NFA = nonfunctioning adenoma. To chiasm: 0 =no involvement;+= extension to chiasm;++= minimal impression; +++ = moderate or greater elevation. Packing: G = Gelfoam; F = fat.
variable MR signal intensity. In the majority of cases, signal intensity was isointense to the pitui-tary gland with an irregular center of decreased signal intensity on T 1-weighted images. On T2-weighted images, there was a further decrease in signal intensity over a larger area.
Late postoperative studies were obtained 4 to 9 months following surgery. All cases demon-strated a decrease in height of the pituitary mass on the second postoperative study compared with the first one. This decrease was marked in most cases (21 %-75% decrease in height, average 54%). The maximum total height on late studies was 16 mm; five cases were 10 mm or less. When compared with preoperative studies, nine cases showed a late decrease in height of 20%-78%. In one microadenoma, the postresection mass increased slightly from 10 to 11 mm (Table 1).
On the late postoperative studies, enhance-ment was more homogeneous. In those in which Gelfoam was used, there was either complete resorption (five cases) or a marked decrease in size of the packing defect (three cases). The pituitary gland assumed a normal or near normal appearance in the five patients with complete resorption. In two patients, the pituitary gland was deformed, normal in size but eccentrically positioned, with a defect on the contralateral side extending to the sellar floor. In one patient, the pituitary gland itself appeared normal in size, but combined with the persistent fat packing, the total pituitary mass appeared slightly enlarged. In two patients, there was residual tissue that en-hanced less than the adjacent pituitary, sugges-tive of residual tumor. In one of these two pa-tients, this appearance has remained unchanged 5 to 16 months after surgery and, therefore, may
or may not represent residual tumor. In the other patient, tumor likely remained in one cavernous sinus. The blood prolactin level decreased from 800 ng/mL to 60 to 70 ng/mL and remained at this level and the cavernous sinus remained un-changed on MR for at least 19 months following surgery. The pituitary in another patient remained slightly enlarged and homogeneous in signal in-tensity and enhancement with the exception of a vertical low signal "cleft" likely representing scar. Fat packing remained visible in the remaining two cases in which fat was used. In one of these two cases, Gelfoam was also used at the site of cavernous sinus bleeding. That presumed to be Gelfoam packing (by virtue of its location adja-cent to the cavernous sinus) exhibited a homo-geneous decrease in signal intensity that differed from the more centrally placed fat. The material adjacent to the cavernous sinus (presumably Gel-foam) resorbed completely leaving a defect that extended to the sella floor, whereas the fat pack-ing resorbed incompletely. The pituitary stalk was more often visible on late follow-up studies, ap-pearing less compressed and less displaced, but remained off midline in all but three cases.
The optic chiasm returned to or remained in normal position in seven patients. In three pa-tients, there was herniation of the suprasellar visual system into a partially empty sella. This consisted of inferior bowing of the center of the chiasm and a more vertically oriented course of the optic nerves and tracts.
[image:3.617.120.484.92.242.2]766 DINA AJNR: 14, May/June 1993
Fig. 1. A, Preoperative enhanced coronal Tl-weighted image. A macroadenoma slightly elevates the optic chiasm on the right (arrow).
8, Enhanced coronal Tl-weighted image 3 days postsurgery. The Gelfoam-packed resection defect is visible (arrows). There has been minimal decrease in overall size of the pituitary gland.
C, Enhanced coronal Tl-weighted image 4 months postsurgery. There is further decrease in pituitary size, the Gelfoam having been resorbed.
the exception of two in which fat packing remained.
On the 1 year (12-16 months) follow-up stud-ies, there was essentially no change in the size or configuration of the remaining pituitary gland/
mass. There was a further decrease in the amount of fat packing both in the sella and the sphenoid sinus in one case.
Visual field defects improved to normal in the two patients with field abnormalities and the signs of acromegaly regressed in all three patients so affected. Laboratory confirmation of a return of hormone production to normal was obtained in all cases of functional tumors with the exception of the one case with cavernous sinus residual tumor described above in whom a new baseline was established. There was insufficient laboratory data to correlate involution of the pituitary with change in hormone levels. The length of follow-up in this study is too short to address the diagnosis of tumor recurrence.
Discussion
The transsphenoidal microsurgical technique of pituitary tumor removal involves a surgical approach that traverses the sphenoid sinus and floor of the sella turcica. After removal of the adenoma, the resection cavity in the sella is packed with either Gelfoam or, in the case of a
CSF leak, autologous fat. If fat is used, the sphe -noid sinus is also packed with fat. In some inst
i-tutions, fat packing is preferred in most cases; occasionally muscle is used. A nasal bone or cartilage stent is also placed within the sella to reconstruct the defect in the sella floor.
Imaging studies obtained in the early postop -erative period demonstrate the sphenoid sinus to be at least partially opacified with thickened mu-cosa, fluid, and fat. These observations would be anticipated and were confirmed on MR in this study and also reported on CT (5). What came as an unexpected observation on CT studies in the early postoperative period was the alarming lack of change in overall size of the pituitary mass. Follow-up CT studies have shown a decrease in size of the pituitary mass over the
3
or4
months following surgery (4, 5, 8). Several explanations have been offered to explain this phenomenon,including the packing itself with subsequent re-sorption, overpacking of the tumor bed, postop-erative hemorrhage, persistent tumor or tumor
capsule, and adhesions between the diaphragma sellae or tumor and brain tissue (6).
In this series, MR imaging of the postoperative pituitary gland also demonstrated a delay in early involution of the pituitary mass (Figs. 1 and 2). The total height of the mass actually increased slightly in three of
10
patients and decreased to a maximum of only33
%
loss of height in five.Delayed studies showed the decrease in total mass to occur primarily at the site of the tumor, also the site of the resection defect and packing
AJNR: 14, May/June 1993 POSTSURGICAL MR OF THE PITUITARY 767
A
8
c
Fig. 2. A, Preoperative nonenhanced coronal Tl-weighted image. A large adenoma contains a small focus of hemorrhage (curved arrow) and marked suprasellar extension (arrows).
8, Enhanced coronal Tl-weighted image 3 days postsurgery. There is rim enhance-ment of the pituitary mass with mixed iso-and low-intensity packing.
C, Coronal long TR/TE image. The superior portion of the resection cavity exhibits increased signal intensity (black arrow) while there is greater decrease in signal intensity of the Gelfoam-packed area (white arrows).
D, Enhanced coronal Tl-weighted image 6 months postsurgery. The pituitary is
now normal in size.
D
Gadolinium-enhanced MR demonstrated
en-hancement of at least some tissue in all cases.
The enhancing tissue appeared to be other than packing and presumably represented residual pi-tuitary gland. A thin enhancing rim as seen on CT has been referred to as a persistent tumor capsule (5, 7, 9). Whether this tissue represents residual tumor, tumor capsule, or pituitary gland cannot be determined on a single imaging study. The peripheral enhancing rim in the three largest postoperative masses in this study (average
height,
38
mm) assumed a more normal pituitarysize and shape within the confines of the sella
(average height, 14 mm) 4 to 9 months later (Fig.
2).
The MR signal intensity of the packing was inhomogeneous. Fat retained high signal intensity
on T1-weighted images and was readily detected.
The fat was mixed with isointense soft tissue or
fluid. Gelfoam packing tended to be isointense
with pituitary tissue with T1-weighting, although
there was an irregular hypointense center. This hypointense signal appeared to be produced by
small air bubbles within the Gelfoam in some
cases. With T2-weighting, signal intensity was
mixed. The periphery of the packing had
in-creased signal intensity while the center was most
often moderately hypointense, lower in signal,
and larger than on the T 1-weighted image or the
first echo long TR image (Figs. 28 and 2C). In
addressing changes in signal intensity with
T2-weighting, one must keep in mind that the slightly
thicker, larger field-of-view T2-weighted images
have lower spatial resolution than the
Tl-weighted images. The etiology of the decreased
signal with T2-weighting is uncertain. Gelfoam is
saturated with saline prior to packing and most
certainly retains some trapped air. Few air
bub-bles could be recognized as such. Blood in the
surgical bed or mixed with Gelfoam, having been
exposed to air, would likely be in the
methemo-globin state, but there was no increase in signal
on Tl-weighted images to confirm this. Delayed
hemorrhage into the surgical site might still be in
its deoxyhemoglobin state on day 3 or 4 following
com-768 DINA AJNR: 14, May/June 1993
A
8
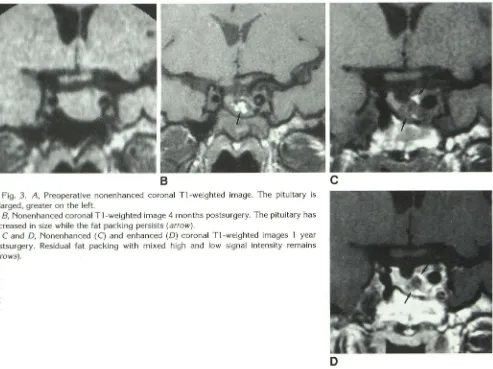
Fig. 3. A, Preoperative nonenhanced coronal Tl-weighted image. The pituitary is
enlarged, greater on the left.
B, Nonenhanced coronal Tl-weighted image 4 months postsurgery. The pituitary has
decreased in size while the fat packing persists (arrow).
C and D, Nonenhanced (C) and enhanced (D) coronal Tl-weighted images 1 year
postsurgery. Residual fat packing with mixed high and low signal intensity remains
(arrows).
plete hemorrhage resorption because the
in-creased signal of methemoglobin was not seen
on any of the delayed studies. T2 shortening, therefore, is more likely caused by the magnetic susceptibility effects of air trapped within the Gelfoam or by the Gelfoam itself. Fat packing displayed the characteristic decreased signal with T2 weighting. Bone and cartilage stents could not
be identified with certainty.
The delayed postoperative studies demon-strated the pituitary gland to have returned to a
more normal size, although half were somewhat
deformed. In two cases, the pituitary gland
oc-cupied only one side of the sella with a defect on
the contralateral side extending to the sella floor.
In two other cases, the pituitary gland remained
deformed by residual fat packing in one and by
a vertical low signal cleft that presumably
repre-sents scar.
Both persistence as well as disappearance of
fat has been observed on CT (5). In this series,
intrasellar fat packing was used in only two
pa-D
tients. In both, the sphenoid sinus was also packed with fat. A moderate amount of fat re-mained in one patient 1 year following surgery. While the amount had decreased, it remained mixed with isointense nonenhancing tissue that likely represents fibrotic scar but could not readily be differentiated from recurrent tumor (Fig. 3). Because Gelfoam packing is resorbed in the first few months following surgery, a new baseline develops with which subsequent examinations can be compared. Fat packing appears to result in a more long-lasting intrasellar effect.
Herniation of the suprasellar visual system into
the partially empty sella occurred in three pa
-tients. The significance of this observation is
uncertain. None of the three patients had visual
symptoms. The appearance is similar to that reported by Kaufman et al (11), who also noted a lack of correlation between severity of visual symptoms and various degrees of herniation of
[image:6.612.66.559.75.444.2]AJNR: 14, May/June 1993
Kaplan et al (4) reported the CT observation of
an empty or partially
e
mpty sella postoperat
i
vely
in about half of 108 patients
.
In that series of 4 7
patients with fun
c
tioning adenomas
,
22 had
hor-monal evidence of residua
l
tumor even though
most lacked CT tumoral enhancement. The
y
also
correlated the degre
e
of displacement of th
e
p
i
-tuitary stalk with the likelihood of tumor r
e
cur
-rence and
,
more importantly
,
a decrease in siz
e
of the stalk with cure. No attempt was made to
correlate these observations
i
n
t
his study
,
i
nas-much as the stalk was not adequately visualized
in most cases and follow
-
up too short to e
x
clude
recurrence.
In conclusion
,
th
i
s MR study has demonstrated
that the immediate postoperat
i
ve p
i
tuitar
y
mass
may appear remarkably similar to its preoperative
appearance
.
Surgical packing can be identified
and tends to occupy a volume similar to that of
the resected tumor. Gelfoam is
c
ompletely r
e-sorbed in the fi
r
st few months following sur
g
er
y,
resulting in residual normal or near-no
r
mal
ap-pearing tissue that has the imaging properti
es
of
the pituitary gland
,
although it may be deformed
or eccentrically positioned. A new baseline im
a
ge
i
s then established
.
While the
i
nterval b
e
tween
studies varied
,
the three cases with the ea
r
liest
follow
-
up (4 months) also had studies at
1
2 to 16
months that failed to show further change
.
Fur-ther study would be needed to determine wheFur-ther
this new baseline can be estab
li
sh
e
d earlie
r
and
i
f
th
i
s holds true for all cases
.
I
n any event
,
on
e
must be aware o
f
the potentially decept
i
ve
ap-pearance of th
e
pituitary gland in the imm
e
diate
POSTSURGICAL MR OF THE PITUITARY 769
p
osto
p
era
tiv
e
p
erio
d b
efore diagn
o
si
n
g possible
c
o
m
plicat
i
on
s
a
n
d al
s
o b
efore esta
bl
ishing a
base-lin
e f
or either
ra
d
iati
on
the
r
a
p
y
pl
a
n
ni
n
g or f
o
l
-low-up
s
tudi
es.
References
I. Kucharczyk W. Davis DO, Kelly WM. Sze G, NormanD, Newton TH. Pituitary adenomas: high-resolution MR imaging at 1 .ST. Radiology 1986;161 :761-765
2. Newton DR, Dillon WP, Norman D. Newton TH, Wilson CB. Gd-DTPA-enhanced MR imaging of pituitary adenomas. AJNR: Am J Neuroradiol 1989; 10:949-954
3. Kern EB, Laws ER Jr. The rationale and technique of selective transsphenoidal microsurgery for the removal of pituitary tumors. In: Laws ER Jr, Randall RV, Kern EB, Abboud CF, eds. Management of pituitary adenomas and related lesions with emphasis on transsphe-noidal microsurgery. New York: Appleton-Century-Crofts, 1982: 219-244
4. Kaplan HC, Baker HL, Houser OW, Laws ER Jr, Abboud CF, Schei-thauer BW. CT of the sella turcica after transsphenoidal resection of pituitary adenomas. AJNR: Am J Neuroradioll985;6:723-732 5. Dolinkas CA, Simeone FA. Transsphenoidal hypophysectomy: post
-surgical CT findings. AJNR: Am J Neuroradiol 1985;6:45-50 6. Teng MMH, Huang C, Chang T. The pituitary mass after
transsphe-noidal hypophysectomy. AJNR: Am J Neuroradiol1988;9:23-26 7. Allen MB Jr, El Gamma] T, Nathan MD. Transsphenoidal surgery on
the pituitary. Am Surg 1981;47:291-306
8. Ciric I, Mikhael M, Stafford T, Lawson L, Garces R. Transsphenoidal microsurgery of pituitary macroadenomas with long-term follow-up results. J Neurosurg 1983;59:395-40 1
9. Goldman JA, Hedges TRIll, Shucart W, Mol itch ME. Delayed chiasma! decompression after transsphenoidal operation for a pituitary ade-noma. Neurosurgery 1985; 17:962-964
10. Mikhael MA, Ciric IS. MR imaging of pituitary tumors before and after surgical and/or medical treatment. J Comput Assist Tomogr 1988; 12:441-445