Operator at Risk
A statistical risk management model to assess new operation and
maintenance contracts and quantify the associated financial risks
2011
I. Schutz
[
MASTER THESIS
]
Author: I. Schutz
Student number: s0089672
Institute: University of Twente
Faculty: School of Management and Governance
Program: Industrial Engineering & Management (MSc) Track: Financial Engineering & Management
Company: NedMobiel B.V.
Graduation committee: Dr. P. de Vries, University of Twente Dr. W. Tijhuis, University of Twente M.W.R. Hellemans LLM, NedMobiel B.V.
Preface
Ironically, these words will most likely be the first words that you will read, while they are the last words that I will write. What seemed to become a long (but fun) period at the beginning of this year, looks like a short period reflecting on it. I certainly have enjoyed student life, both the ‘relaxing’ parts as well as my challenging and in-depth study. Maybe it sounds cruel, but it is very interesting to follow the master Financial Engineering & Management when there is a financial crisis. However, I feel relieved to write these last words knowing that my graduation is close at hand and that my ‘professional’ life can finally begin.
Performing research at NedMobiel was very pleasant. The location is the first thing you notice, a church which houses the office of NedMobiel. It truly is a very unique and inspiring place to work at, a location which I probably will not encounter soon again. Having the freedom and resources to perform this innovative research at NedMobiel was also a privilege for which I am very grateful. Starting this research, I was astonished by the simplicity which even larger companies use to
calculate the risk premium. One person deciding purely on tacit knowledge which percentage to take as the premium on a contract of almost 1 billion euros sounds very unreal (but it is true). Especially with a background as a financial engineer, in which modeling and using data is the rule rather than the exception. Knowing that this research would be totally new for this sector and could really make an impact is something you can only wish for as a graduate student. This really made the research a worthy closure of my student life.
I want to use the rest of this page to thank some people whose help was very pleasant in finishing this master thesis. First and most of all my gratitude goes to Maarten Hellemans, supervisor from NedMobiel. The time and effort he has put in is enormous and without it, the outcome of this research would not have been what it is today. Thanks for the countless formal as well as informal discussions about this and other subjects. Also many thanks to Piet de Vries and Wilco Tijhuis,
supervisors from the University of Twente. The time taken to review and discuss all the drafts and the advises you gave are also very much appreciated.
Furthermore, thanks to my parents and sister for their support and advices. Not only during the writing of my master thesis but throughout my whole (student) life. Also thanks to Roel Scholten for supporting this research and giving me the opportunity to write my master thesis at NedMobiel. I sincerely hope that the ambition to become an operator will soon become reality. And of course thanks to my friends for the support, even when I did not need it.
Enjoy reading my master thesis!
Ivo Schutz
Summary
This research focuses on operation and maintenance (O&M) contracts in the road infrastructure sector. It specifically addresses the risk management model which is part of the risk dossier in
assessing a new O&M contract which will be used to calculate the risk premium. There is currently no formal risk model to assess these contracts and by performing external interviews it became
apparent that there are no such methods at other companies. The model needs to be designed such that specific risks are addressed to make a detailed assessment of the risk premium in an O&M contract. Currently, the risk premium is determined by the people responsible for a tender who assign a single ‘risk’ number to the sum of the project based on tacit knowledge. Having projects that cost billions of euros, this is not a desirable situation.
The desired situation is a statistical risk model that formalizes the process of calculating the risk premium of an O&M contract and which will support the gut feeling of NedMobiel. It is furthermore convenient that it can be used to build a database for the future.
To meet the desired situation, a model is designed which calculates the risk premium for the operator. The model is designed by following a few steps.
NedMobiel will be able to add and adjust risks and their parameters to fine-tune the model over the years and make sure that the model can be used in every tender where NedMobiel will act as operator. This ensures that the gut feeling of NedMobiel is quantified and the financial consequence of risks in future O&M contracts are clear, such that NedMobiel will be able to take on the role as operator while still being able to ‘sleep at night’.
• a list of thirty risks that should be taken into account is made and specifically tailored to the needs of NedMobiel, where risks can easily be in- and excluded in the model;
• from a multi criteria decision analysis it became clear that a probabilistic model will be most suitable to the wishes of NedMobiel;
• the parameters impact, chance and timing are calculated per risk and each risk is assigned a statistical distribution which specifies the three aforementioned parameters;
• everything is modeled in Excel and Visual Basic for Applications, the risks and the associated parameters are admitted in the model;
• NedMobiel can adjust the model to specific needs per project; and
Table of contents
PREFACE I
SUMMARY II
TABLE OF CONTENTS III
LIST OF FIGURES V
LIST OF TABLES VI
CHAPTER 1 1
1.OUTLINE OF THE RESEARCH 1
1.1 THE ESSENCE OF PUBLIC-PRIVATE PARTNERSHIPS (PPPS) 1
1.2 PPP CREATES A HIGHER VALUE FOR MONEY FOR THE TAXPAYER 3
1.3 THE PPP IS MANAGED USING A SPECIAL PURPOSE VEHICLE 5
1.4 CURRENT RISK MANAGEMENT MODEL IS NOT USEFUL TO CALCULATE THE RISK PREMIUM 7 1.5 THE DESIRED RISK MODEL IS STATISTICALLY A BETTER REPRESENTATION OF REALITY AND CALCULATES THE RISK
PREMIUM 10
1.6 THE NEW RISK MODEL SPECIFICALLY DESIGNED FOR NEDMOBIEL 11
1.6.1 PURPOSE OF THIS RESEARCH 12
1.6.2 RESEARCH QUESTION 12
1.6.3 SUB QUESTIONS 13
1.7 METHODOLOGY TO ANSWER THE RESEARCH QUESTION 13
CHAPTER 2 17
2.THE KEY RISKS IN AN O&M CONTRACT 17
2.1 METHOD TO DEFINE THE KEY RISKS 17
2.2 KEY RISKS UP TO THE THIRD LEVEL AND THE DISTINCTION OF INTERNAL RISKS 19
2.3 KEY INTERNAL RISKS AT THE FOURTH LEVEL 24
2.4 CONCLUSION OF THE KEY RISKS IN AN O&M CONTRACT 25
CHAPTER 3 26
3.CHOICE OF A RISK MODEL 26
3.1 VARIOUS RISK MODELS TO CHOOSE FROM 26
3.2 CHOOSING A RISK MODEL IS DONE BY USING THE ANALYTIC HIERARCHY PROCESS (AHP) METHOD 27
3.3 OUTLINE OF THE AHP METHOD 28
3.3.2 CHECKING THE ANSWERS FOR CONSISTENCY 30 3.4 APPLICATION OF THE AHP METHOD AND CHOICE OF THE RISK MODEL 30
3.5 CONCLUSION WHY TO USE THE PROBABILISTIC MODEL 33
CHAPTER 4 34
4.DATA SORTING 34
4.1 EXISTING METHODS OR DATABASES IN THE INFRASTRUCTURE SECTOR ARE NOT SUFFICIENT TO BUILD UPON 34
4.2 THE MATHEMATICS BEHIND THE GATHERING OF THE DATA 35
4.3THE FORMAT TO GATHER DATA IS TO FOCUS ON IMPACT, CHANCE AND TIMING OF THE RISKS 38
4.4 THE DATA WILL BE GATHERED BY PERFORMING INTERVIEWS 41
4.5 SUMMARY OF THE DATA SORTING 42
CHAPTER 5 43
5.BUILDING AND USING THE STATISTICAL MODEL 43
5.1 GENERAL INFORMATION ABOUT THE PROGRAMS USED TO CREATE THE MODEL 43
5.2 AGGREGATING THE DATA TO FIT THE MODEL 44
5.3OVERVIEW OF THE OUTPUT OF THE MODEL AND USING THE OUTCOME 47
5.4 FUTURE STEPS NEEDED TO FINE-TUNE THE MODEL 49
5.5 SUMMARY OF CODING THE MODEL 51
CHAPTER 6 52
6.CONCLUSION AND RECOMMENDATIONS 52
6.1 CONCLUSION 52
6.2 RECOMMENDATIONS 53
GLOSSARY AND LIST OF ABBREVIATIONS 55
BIBLIOGRAPHY 57
APPENDICES A-I
APPENDIX A OVERVIEW OF MATRICES AHP METHOD A-I
APPENDIX B EXPLANATION OF THE 4TH LEVEL RISKS B-I
APPENDIX C INTERVIEW DIRECTORY – SUBJECT MATTER EXPERTS (SMES) C-I
APPENDIX D OVERVIEW OF THE MODEL – EXCEL PART D-I
List of figures
FIGURE 1 TEST WITH THE PUBLIC SECTOR COMPARATOR FOR VALUE FOR MONEY IN A PPP (HUI, YING, &
ZHI-QINGN, 2010) ... 3
FIGURE 2 MOST COMMON RELATIONSHIP BETWEEN THE PUBLIC AUTHORITY AND THE OPERATOR GIVEN TWO SCENARIOS ... 5
FIGURE 3 PROJECT FINANCE FOR A NEW ROAD CONCESSION ... 6
FIGURE 4 DIFFERENT PHASES IN THE LIFETIME OF ROAD INFRASTRUCTURE ... 7
FIGURE 5 EXAMPLE OF THE PRICE OF A CONTRACT AND THE RISK PREMIUM PART ... 10
FIGURE 6 EXAMPLE CURRENT RISK MODEL ... 10
FIGURE 7 EXAMPLE DESIRED RISK MODEL ... 11
FIGURE 8 OVERVIEW OF THE DIFFERENT CHAPTERS ... 14
FIGURE 9 DIFFERENT PERSPECTIVES TO DEFINE A COMPLETE LIST OF RISKS ... 17
FIGURE 10 EXAMPLE OF THE FOUR DIFFERENT RISK LEVELS ... 19
FIGURE 11 INTERNAL RISKS AT THE SECOND LEVEL RELATED TO CASH FLOW ... 23
FIGURE 12 OVERVIEW AHP METHOD ... 29
FIGURE 13 FOUR GRAPHICAL EXAMPLES OF PARAMETRIC DISTRIBUTIONS ... 35
FIGURE 14 FOUR GRAPHICAL EXAMPLES OF NON-PARAMETRIC DISTRIBUTIONS ... 36
FIGURE 15 EXAMPLE OUTCOME OF MODELING IMPACT, CHANCE AND TIMING OF A RISK TO CONTRACT DURATION AND PRICE ... 39
FIGURE 16 THE STEPS THAT ARE TAKEN BY THE MODEL ... 44
FIGURE 17 EXAMPLE OUTPUT MODEL RISK PREMIUM PER YEAR ... 48
FIGURE 18 EXAMPLE OUTPUT MODEL RISK PREMIUM PER TIMEFRAME ... 48 FIGURE 19 EIGHT (NON-)PARAMETRIC DISTRIBUTIONS TO CHOOSE FROM... C-III FIGURE 20 EXAMPLE OF PART OF THE INPUT PARAMETERS FOR THE MODEL... D-I FIGURE 21 EXAMPLE OF THE AUTOMATED RAW DATA OUTPUT PER RISK WHEN RUNNING THE SIMULATION D-II FIGURE 22 EXAMPLE OF THE AUTOMATED DETAILED NUMERICAL OUTPUT OF RUNNING THE SIMULATION .. D-III FIGURE 23 EXAMPLE OF THE GRAPHICAL OUTPUT - RISK PREMIUM PER TIMEFRAME (STEPS OF 1/10 YEAR) .. D-IV FIGURE 24 EXAMPLE OF THE GRAPHICAL OUTPUT - RISK PREMIUM PER YEAR ... D-IV FIGURE 25 EXAMPLE OF A SMALL PART OF THE VBA CODE, AUTOMATICALLY USED BY EXCEL TO RUN THE
List of tables
TABLE 1 PUBLIC AND PRIVATE PROVISION OF INFRASTRUCTURE ... 2
TABLE 2 DIFFERENT CATEGORIES OF THE 7S FRAMEWORK AND RISMAN ... 18
TABLE 3 DESCRIPTION OF THE MACRO, MESO AND MICRO LEVEL ... 18
TABLE 4 KEY RISKS UP TO THE THIRD LEVEL ... 22
TABLE 5 EXPLANATION OF THE INTERNAL RISKS ... 23
TABLE 6 THE 4TH LEVEL RISKS CORRESPONDING TO THE INTERNAL RISKS... 25
TABLE 7 VARIOUS RISK MODELS TO CHOOSE FROM ... 27
TABLE 8 SCALE OF JUDGMENTS TO BE USED IN THE AHP METHOD ... 28
TABLE 9 CRITERIA TO BE USED IN THE AHP METHOD ... 29
TABLE 10 NUMBERS FROM THE RANDOM CONSISTENCY INDEX (RI) ... 30
TABLE 11 COMPARISON OF THE CRITERIA EASE OF USE, BUILDING THE MODEL, AWARENESS AND ADDING DATA AND RISKS ... 31
TABLE 12 NUMBERS TO CALCULATE THE CONSISTENCY RATIO (CR) ... 31
TABLE 13 EXAMPLE COMPARISON OF THE SUB CRITERIA FOR THE CRITERION 'EASE OF USE' ... 32
TABLE 14 EXAMPLE COMPARISON OF THE MODELS FOR THE SUB CRITERION 'REPORTING' ... 32
TABLE 15 EXAMPLE CALCULATION OF THE CR FOR THE SUB CRITERION 'REPORTING' ... 32
TABLE 16 SUMMARY OF ALL COMPARISON MATRICES ... 33
TABLE 17 PROBABILITY DENSITY FUNCTIONS OF THE PARAMETRIC DISTRIBUTIONS ... 36
TABLE 18 PROBABILITY DENSITY FUNCTIONS OF THE NON-PARAMETRIC DISTRIBUTIONS ... 37
TABLE 19 EXPLANATION OF THE PARAMETERS GIVEN IN THE PROBABILITY DENSITY FUNCTIONS ... 37
TABLE 20 DESCRIPTION OF THE FOCUS AREAS USED IN THE INTERVIEWS ... 41
TABLE 21 THE SECTIONS OF THE MODEL DIVIDED OVER EXCEL AND VBA ... 44
TABLE 22 EXAMPLE NUMERICAL OUTPUT RISK PREMIUM ... 49
TABLE 23 FUTURE STEPS NEEDED TO FINE-TUNE THE MODEL ... 50
Chapter 1
Chapter 1 describes what public-private partnerships (PPP) encompasses, what the relation with NedMobiel and the current problem is and what this research embodies to solve that problem. First an overview is given what PPPs are (§1.1). Then the relation in a PPP between Rijkswaterstaat (RWS) and a Special Purpose Vehicle (SPV) (§1.2) and the relation between the SPV and NedMobiel (§1.3) are described. Subsequently the current situation is described and it is argued why the current method is not sufficient (§1.4) and what the new model should be capable of (§1.5). The problem is restated in research questions (§1.6) and the methodology to answer the research questions is given (§1.7).
1. Outline of the research
1.1 The essence of public-private partnerships (PPPs)
his research has been performed for NedMobiel, a consulting firm in the area of (road) infrastructure with the ambition to become an (operation & maintenance) operator. NedMobiel was founded in February 2006 and arose out of a few core employees of the business development department from the NV Westerscheldetunnel. NedMobiel advises
governments, companies and interest groups in the area of (private) infrastructure and transport. As well as consultancy and project management for such parties, NedMobiel works to actually execute designed solutions through risk-bearing participation in projects and companies. NedMobiel works from three areas of expertise (NedMobiel, 2011):
• Tolls and pricing;
• Operation and maintenance of complex infrastructure; and
• Public-private partnerships (PPP).
PPPs are the main focus area of this thesis, which the commission of the European communities (2009) defines in their European PPP Report as: “the range of structures used for PPPs varies widely: in some countries, the concept of a PPP equates only to a concession where the services provided under the concession are paid for by the public. In others, PPPs can include every type of outsourcing and joint venture between the public and private sectors”. See e.g., the definition of Yescombe (2007) for the boundary conditions that define a PPP:
• “long-term contract (a ‘PPP Contract’) between a public-sector party and a private-sector party;
• for the design, construction, financing, and operation of public infrastructure (the ‘Facility’) by the private-sector party;
• with payments over the life of the PPP Contract to the private sector party for the use of the Facility, made either by the public-sector party or by the general public as users of the Facility; and
• with the Facility remaining in public-sector ownership, or reverting to public-sector ownership at the end of the PPP Contract.”
Or, as Kappeler & Nemoz (2010) put it in one sentence, a PPP counts as such if the “project [is] based on a long term, risk sharing contract between public and private parties based on a project
agreement or concession contract”. Benefits of using PPPs include the following (Regan, Smith, & Love, 2011):
• “The delivery of projects on time and on budget;
• Reduced procurement costs and improved VfM [Value for Money] outcomes;
• Improved project management-integration of design and construction processes and full life-cycle costing;
• Adoption of an output specification to encourage design and construction innovation and new technologies; and
• Improved public services and qualitative user outcomes.”
Public-private partnerships are based on a contractual relationship between a public agency and one or more organizations in the private sector which will deliver a particular policy, project or range of service. The specific public-private partnership where this research focuses on is called the private finance initiative (PFI), where the private sector provides both the capital and a range of services to operate the facility. A critical note has to be placed that if the private party defaults, the public sector ends up paying for recovery costs. The partnership will be involved in both policy development and executive delivery (Geddes, 2005). The PFI is about realizing a certain risk allocation, depending on the contract type, which achieves the best value for money (Nisar, 2007). For clarity and consistency, the term PPP will be used throughout this report.
Above description of the PPP contract type is considered as the ‘design-build-finance-maintain-operate’ (DBFMO) type. The essence of this contract is the definition of the ‘output’ by the government after which private sector bidders present their solutions to meet the service needs (Nisar, 2007). Table 1, adjusted from Yescombe (2007), provides a short overview of the
responsibilities in a DBFMO contract:
Contract type Design-build-finance-maintain-operate (DBFMO)
Construction Private sector Operation Private sector
Ownership Private sector during contract, then public sector Who pays? Public sector or users (depends on the specific project) Who is paid? Private sector
Table 1 Public and private provision of infrastructure
The process through which a project is developed can be split in four ‘rough’ tasks (de Bettignies & Ross, 2004):
1. Defining and designing the project; 2. Financing the capital costs of the project;
3. Building the physical assets (e.g., road, school, etc.); and
1.2 PPP creates a higher value for money for the taxpayer
A PPP will only be successful if, as a result of its existence, there is value for money (VFM) which is achieved through (among others) the lifecycle management of a project. VFM can be defined as the added value for the taxpayer in terms of the benefits that follow from a PPP in relation to the situation in which no PPP is set up. Benefits are more or better infrastructure for the same or less amount of public funds (i.e., the taxes paid) and consist of cost of goods and services, quality of the work process, resources used, timeliness and long-term service needs (Hui, Ying, & Zhi-Qingn, 2010). The measurement of these benefits can be quite subjective and need to be tested in each PPP contract. To do this, an ex-ante study of the public sector comparator (PSC) needs to be done (Merna & Njiru, 2002). As can be read in documents of RWS (2009a) (2009b), the PSC is actively used in the Netherlands to assess private parties on their VFM. Figure 1 shows how this comparison is done. The PSC column is the situation when no PPP is set up, which is compared to the situation if a PPP is set up. The difference in net present costs between the two options is the value for money.
Figure 1 Test with the public sector comparator for value for money in a PPP (Hui, Ying, & Zhi-Qingn, 2010)
Part of the relation between RWS and the private sector is to decide how to allocate the risks. This allocation and how to optimally allocate the risks is not part of this research since this involves much more than the design of the statistical risk management model (e.g., politics and a trade-off between risk and return). The model that will be the output of this research will however contain a function in which NedMobiel can manually and per project set the allocation of a certain risk. An example is that if a risk in a project is fully allocated to another party, then NedMobiel could set that risk to zero percent such that it is not accounted for.
A large concern of a PPP construction is that the government can in general lend money at cheaper interest rates than private institutions due to a better credit rating, and thus can execute the project at a different price. In the beginning of PPP it was thought that this was a factor that possibly deteriorates VFM (Merna & Njiru, 2002). The private sector has to make up for this difference by operating more efficient. However, Bing et al. (2005) and the National Audit Office (2010) did research on this issue and found that the actual impact of non-government borrowing is much less than first supposed and clearly offset by the efficiency gain. An explanation for this is that when there is a long-term contract with a government buyer, the private borrower can most likely lend at a lower rate compared to the situation where there would be no contract with a government buyer (de Bettignies & Ross, 2004). The lenders most likely assume that the public party still bears some of the risks involved and know that the government bears ultimate responsibility.
Furthermore, if there are large transfers of risk from the government to the private sector, the private sector will of course price this risk. It has to be taken into account that risk transfer must not be excessive (Merna & Njiru, 2002), risks that could better be taken by the government should be allocated there and not by the private sector. By taking this risk and the corresponding premium, the private sector can use its experience and skills in order to bring innovative alternatives to public service provision (Nisar, 2007). Overall, in the literature there seems to be consensus that PPPs (and PFIs) are in fact VFM when the PSC indicates this, and it seems reasonable to assume that PPPs will continue to exist in the future. This does not take the criterion away that future PPPs need to be tested on its VFM, both before and during/after the PPP contract period.
If a PPP is undertaken, focusing on the operation and maintenance part, there are two most common used forms. A split can be made between new infrastructure and existing infrastructure. When new infrastructure has to be build, it includes the Design & Build phase as well as the Maintenance and Operation phase. This is in this case defined as a DBFMO contract. If the infrastructure already exists, only the contracts to maintain and operate the infrastructure are closed.
In the former case, new infrastructure, a SPV is set up which will act as the project company. One of the reasons to create a SPV for building, operating and financing new infrastructure is that the original company is ‘shielded’ if the project fails. The SPV is a separate company from the promoter’s organization and is usually highly leveraged (high debt/equity ratio) (Merna & Njiru, 2002). The SPV is the contractor to the government or some other public sector organization. There are various kinds of organizations in a SPV, which together provide the essential elements of a project such as design, construction, finance and specialist facilities (Tranfield, Rowe, Smart, Levene, Deasley, & Corley, 2005). This makes sure that the client organization has a single point of contact through the project life. The SPV has no activity other than the activity which it was set up for (Yescombe, 2002). Tranfield et al. (2005) also state that most service-delivery-focused projects are currently managed by a formally configured SPV to form a successful PPP. In this SPV, the builder (responsible for the design & build phase) as well as the operator (responsible for the operation & maintenance phase) take place.
The main difference between the two forms is the method of financing. In a SPV, financing is usually done by taking on a huge amount of debt (~90%) and a small part equity (~10%) which changes the way the risks are treated. When you have a large amount of debt, the lenders have a big stake in the decision where to allocate the risk. Most of the time these lenders are banks, which do not want to take on unexpected risks. Since the SPV is set up for a sole purpose, the revenues that follow from the project are the only way to get the investment back. These cash flow will be used as the guarantee for the lenders. Given these facts, the SPV will transfer its (cost) risks to the
subcontractors, being NedMobiel as the operator. On the other hand, with existing infrastructure there is no need to set up a SPV, the financing amount required is limited and can be done with mostly equity. The financing risk is in this case not an issue because of the debt/equity ratio, there is in general more equity and less debt than in the SPV scenario.
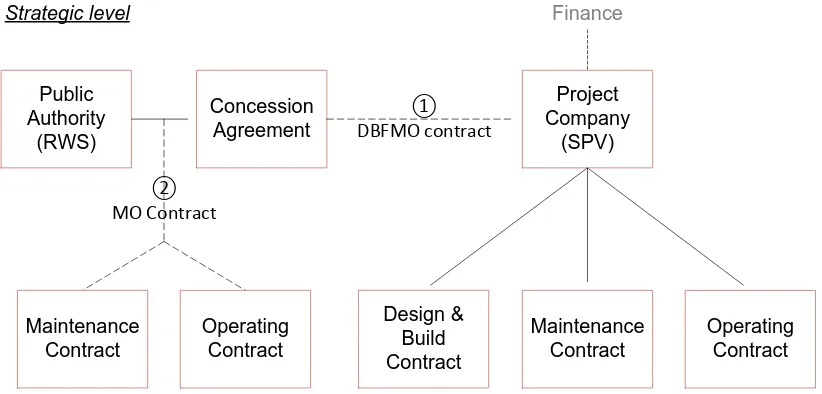
Let’s define scenario ① to be new infrastructure where the relation is between RWS and the SPV. Then scenario ② is the case where there is existing infrastructure and the relation is between RWS and NedMobiel. Drawn into a diagram gives Figure 2.
Operating Contract Maintenance
Contract Finance
Project Company
(SPV) Public
Authority (RWS)
Concession Agreement
①
DBFMO contract
Design & Build Contract ②
MO Contract
Operating Contract Maintenance
[image:13.595.93.504.309.506.2]Contract Strategic level
Figure 2 Most common relationship between the public authority and the operator given two scenarios
This research will focus purely on new infrastructure and will thus follow scenario ①. A detailed structure is shown in the next paragraph.
Given the new situation, there will be a relation between RWS and the SPV. NedMobiel will take place in the SPV as the operator (operating & maintenance contract), where a construction company will take on the role of the builder (design & build contract). They together form the SPV. The risk dossier that NedMobiel needs to set up is focused on the relation between the SPV and NedMobiel. The risk dossier is important for the lenders because the SPV is mainly financed by them and thus the SPV has a huge debt and low amount of equity.
1.3 The PPP is managed using a special purpose vehicle
can be additional structures. Given the fact that this research is about new infrastructure, as defined in the previous paragraph, the structure will not deviate too much from the figure.
Figure 3 Project finance for a new road concession
The operating and maintenance contract is the specific part that would be managed by NedMobiel. Although this research focuses on the operation & maintenance (O&M) part of the contract, it must be noted that the interaction between the design & build (D&B) contractor and the party that manages the operating and maintenance contract is important. An example is that if the builder uses inferior quality asphalt because it is cheaper but this means that the lifetime is reduced, it will have an influence on the costs for the operator. In this research it is assumed that NedMobiel is able to work closely together with the builder and work out a situation that is ‘optimal’ for both parties. In determining the risks in chapter 2, the aforementioned risk is also taken into account.
described, the next paragraphs will focus on the challenge for NedMobiel to assess the risk premium if they take on the role of operator.
1.4 Current risk management model is not useful to calculate the risk
premium
Before you can arrive at a structure as defined in the previous paragraph, you first need to be awarded (‘gegund’ in Dutch) a project after having been through the tender phase. After the tender phase you have the Engineering, Procurement & Construction (EPC) phase in which the infrastructure is build. When this is done the Maintenance & Operation phase begins and after this you have the Rest of the lifetime. Going back to Figure 2, the EPC and the Maintenance & Operation phase
combined is represented by scenario ①, the Rest of lifetime is scenario ②. This research focuses on developing a risk model that will be used in the tender phase to assess the risks associated with the Maintenance & Operation contractor, see Figure 4.
Maintenance & Operation Engineering,
Procurement & Construction
Rest of lifetime
Phase Tender
Phase when the model will
be used
Figure 4 Different phases in the lifetime of road infrastructure
In the steps before and in a tender, from the point of being a candidate to submit an offer
(‘gegadigde’ in Dutch) to financial close, there are a number of criteria that are assessed in choosing the winner. In the selection procedure of the party that grants the project (e.g., for the Netherlands this would be RWS) the amount of money is not the only variable that plays a role, but they look at the overall quality of the bid and subsequently choose the economic most valuable candidate (‘economisch meest voordelige inschrijving’ or ‘EMVI’ in Dutch). To give a broad overview of the criteria, without the intention to deliver a full list of criteria but with the intention to show the most important ones and where the risk management model comes in place:
• Price;
• Risk dossier;
• Approach of the project; Total proposal in the tender phase
• Optimization phase; and
• Planning.
These criteria are of course no stand-alone issues but all play a part in assessing the economic most valuable candidate.
Sharp (1964), a Nobel prize winner in economics, modeled that a higher expected rate of return can only be achieved by having additional risk. And it can be argued that having large optimization phases are not without risk. In this case, optimization is defined as the adjustments made to the EMVI that will affect the expenses of the operator. Regarding these criteria, this research will focus on the risk dossier, and the risks that need to be determined for the risk dossier. NedMobiel wants this
Based on internal (NedMobiel) as external (other companies) interviews and literature, the main method that is currently used to define and measure risks is the RISMAN method. This method is useful to define the risks for the risk dossier after the tender phase, i.e., the project is awarded to NedMobiel. The RISMAN method comprises four global steps (Kennisnetwerk Risicomanagement RISNET, n.d.):
• Define the goal of the project;
• Map the risks belonging to the project;
• Identify the most important/biggest risks; and
• Define how to manage these risks.
In defining the goal of the project, the different management measures, the level of depth and the different employees who are performing the RISMAN method are determined. The next step
comprises the analysis of the different risks that belong to the project via several brainstorm sessions and listing these risks in a matrix. The matrix comprises the risks in the first column and the risk description, possible cause and effect, management action to restrict the severity of the risk and the status, deadline and responsible persons are listed. In the third step the matrix is filled and the most important risks are determined. As a last step, the management actions of the most important risks are described in detail. These steps are done qualitatively, most of the time by putting the project team together and using a brainstorm session to achieve the list of risks. The outcome is a list of risks that need to be managed and an overview of the most important ones including different
management actions.
After making a list of management actions according to the defined risks, a decision needs to be taken which action per risk should be implemented, if any action is necessary. The RISMAN process is an ongoing cycle of choosing, implementing and evaluating the management actions (Bouwend Nederland, n.d.) (Twynstra Gudde, n.d.). The process focuses mainly on the relation between the public authority and the operator. By having this report, the public authority can qualitatively check the management actions of the risks.
As said before, the lenders are in need of a risk management model that will show them that the operator in the SPV can judge the financial impact of risks accurately. The RISMAN process is not practical for this. The first reason is because the outcome of the RISMAN process is too detailed and too specific for the lenders. Furthermore, it is not taken into account what the occurrence of risks over time is and how that translates to the overall picture (currently, risks are treated as stand-alone issues and are treated as if it is equally likely that a risk will happen in the, say, first year or the last year). A second reason is because it is not efficient to perform the RISMAN process in a tender. It is in terms of time/payoff not beneficial for both the operator and the public authority to go through the RISMAN process with each party that wants to submit an offer. The conclusion is that the RISMAN process is unsuitable for the purpose of assessing operation and maintenance contracts in terms of risk management and focusing on the relation between NedMobiel and the SPV.
time an integer (1%, 2%, 3%, …) because it is useless to define a risk premium of, say, 2.38% if this is not based on (formalized) data.
Put into an example: if we have a contract of 500 million euro, it is currently said that an x percent of this price is added to cover the potential loss of the risks. Let’s say it is 2%, then the price will go to 500 𝑀€∗(100% + 2%) = 510 𝑀€. We can thus say that the risks are priced at 10 M€ (called the risk premium), see Figure 5 for a graphical explanation.
This approach is called deterministic; these deterministic models describe exactly how the system will evolve over time. When put in simpler words, this means that you only deal with one possible reality of how a process will work out over time (“single-point estimate”). One possible reality means the risk occurs or it does not occur, which is certainly not the case in the real world. The opposite is a stochastic process which means that there is a whole range of possible solutions. In this stochastic process, the risk has different probabilities of occurring instead of just one possibility. It can be easily seen that (the effect of) risks is not that black and white in reality, it is not deterministic but rather stochastic. In reality risks will not just occur or do not occur, there is a wide range of possibilities between these options. So there is a mismatch between the current situation of pricing the risks (deterministic) and reality (stochastic).
Figure 5 Example of the price of a contract and the risk premium part
Figure 6 Example current risk model
This deterministic approach can be used if there are enough projects to diversify the risks. This is not the case for NedMobiel, since it is not likely that RWS will place large amounts of PPP contracts and that many of these contracts will be awarded to NedMobiel. Thus there is need for a new risk model. NedMobiel wants a model that will capture ‘reality’ in a better way opposed to the current
deterministic (‘binary’) model.
1.5 The desired risk model is statistically a better representation of reality
and calculates the risk premium
This risk model will be used as a tool to assess future O&M contracts to make a well-founded decision whether it is acceptable to close the O&M contract. In the whole range of risk management
practices, this model will assess the financial risks for NedMobiel when taking on the role of operator. It is reasonable to assume that the probability of a risk occurring will have a certain distribution
Base price, 500 Total price, 510
Risk premium, 10
Va
lu
e o
f c
on
tr
ac
t
Pricing of a contract with a risk premium
98%
2% 0%
20% 40% 60% 80% 100%
0 2 4 6 8 10
Pr
ob
ab
ilit
y
Loss (M€)
loss will occur. The outcome of modeling the new risk model will be more like a distribution as shown in Figure 7 than a distribution as shown in Figure 6, so more disperse instead of binary.
Figure 7 Example desired risk model
The main difference with the old model is moving from two possible outcomes to multiple possible outcomes. Recall the example, it is in the current situation estimated that there is a 2% chance of a loss of 10 M€ and a 98% chance of a loss of 0 M€. This implies that there is a zero percent chance of a loss of (say) 5 M€ or 15 M€ in the current situation, which is obviously nothing like reality. The new situation will say that the expected loss will be 10 M€, but it will be spread out over different losses. The whole surface under the graph represents the probability of the risk occurring. Looking at Figure 7, you have for instance a 50% chance of a loss between 0 - 0.685 M€, a 25% chance of a loss
between 0.685 M€ - 1.367 M€, a 24.995% chance of a loss between 1.367 M€ - 10 M€ and a 0.005% chance of a loss > 10M€.
An advantage is that seeing such a distribution gives a better idea of the riskiness of a project versus the current model. This is something you cannot see in the current model, since you only have a few points (in the example in Figure 6 this is either a 0 or 10 million euro loss). This is essential because a company should have a clear and unambiguous model that assesses the financial risks that can be taken (Hull, 2010).
1.6 The new risk model specifically designed for NedMobiel
To summarize the desired situation: NedMobiel is currently in need of a statistical tool to assess future O&M contracts to make a well-founded decision whether it is acceptable to close the O&M contract in terms of risk. The criteria reporting, usability, feasibility, correlation between risks, awareness and adding data and risks will be used to choose and subsequently build an appropriate risk model.
0% 10% 20% 30% 40% 50% 60% 70% 80% 90% 100%
0 2 4 6 8 10
Pro
ba
bi
lit
y d
en
si
ty
Loss (M€)
1.6.1 Purpose of this research
The purpose of this research, as defined by the management of NedMobiel, is:
So the specific criterion of this risk model must be in line with the purpose and is defined as the ability to assess financial risks in O&M contracts.
1.6.2 Research question
The research question is defined as:
The specific part of the O&M contract in question is the operator part, i.e., the actual operation and maintenance of new road infrastructure project. So it is about executing the O&M contract (being the operator), which is different from building the infrastructure (Engineering, Procurement &
Construction provider) or advising on the O&M contract (e.g., performing the capital- or operational expenditures (CAPEX/OPEX) calculations).
During the research, the author was given the opportunity to participate in a tender to experience firsthand what this gut feeling (‘onderbuikgevoel’ in Dutch) actually encompasses. It was not a tender for an O&M contract but the process is comparable to the process of an O&M tender. The tender required a subscription price (‘inschrijfprijs’ in Dutch) and a description of the project organizational details, planning and the quality of the provision of services. All these factors were taken into account by using an EMVI, such that the fictional price could be lower than the subscription price. The
planning and quality of the provision of services included, among others, a risk dossier. This risk dossier was drawn up purely on the basis of tacit knowledge obtained from other projects and the risks were thought of on an individual basis. It furthermore was more a qualitative judgment and there were no calculations of, for instance, the chance or impact of the risk occurring. It was rather a statement of what would be done to minimize the risk from occurring and/or the control measure. The risk was priced purely on basis of a ‘guesstimate’ and was a percentage of the subscription price. There was no relation between the risks and the price, let alone be a decomposition of the individual risks and their impact (costs) and chance of occurring. One of the biggest negative consequences of this method was that there was no overview of the total risk of the project (other than the estimated single percentage) and a positive consequence was the speed with which this ‘risk increase’ could be included in the price.
The gut feeling of identifying and quantifying the risks can be seen as ‘commercial satisfaction’. In To have a statistical model that can be used by the management of NedMobiel in a tender, specifically in the calculation of the maintenance phase, which gives a financial risk assessment of
the O&M phase of a specific project.
How to design a statistical risk model, specifically designed for NedMobiel, to assess risks associated with Operation & Maintenance contracts while being the operator in a Special Purpose
The answer to the main research question can be achieved by answering the subsequent sub questions.
1.6.3 Sub questions
1. How does the qualitative risk model currently used to assess risks for the operator part in an O&M contract work (chapter 1);
2. What risks should be in- and excluded based on the criterion which risks directly influence the cash flow (chapter 2);
3. How could a statistical risk model for the infrastructure sector and specifically for NedMobiel be designed, such that it captures reality in a more sophisticated way than the current method (chapters 3-5); and
4. What data are required for the model and how can NedMobiel acquire these data in the future (chapter 4-5).
These sub questions will be answered by following the methodology that is described below.
1.7 Methodology to answer the research question
The sub questions reveal part of the methodology used as described by Verschuren & Doorewaard (1998). Verschuren & Doorewaard describe that to come to a research design, you need a concept design which determines what, why and how much the research will embody. The second step is technical research design which answers the where and when you are going to research. Although their methodology is followed, the research design is fitted in a custom design. This can be seen in Figure 8, which gives an overview of the several steps in this research and to which chapter the different steps correspond.
The process of making the model is an iterative process. The steps are interwoven and for clarity defined into four chapters:
• Identification of the key risks in an O&M contract;
• Choice of a statistical risk model;
• Data sorting; and
• Building the statistical model.
First of all, the project variables and key risks concerning an O&M contract will be assessed. The main problem is that an endless list of different kinds of risks can be produced. However, the model needs to be simple enough such that it will not take ages to get the desired input per project. On the other hand; it cannot be too simple such that it will not generate a reliable measure of reality, thus an optimum must be found. At the same time a specific and appropriate risk model needs to be chosen that will be used by NedMobiel in the future. By looking at the direct influence on the cash flow and performing many internal and external interviews, it is determined which risks are particularly important for NedMobiel. Within the structure of a contract as shown in Figure 3 there are various contracts, and especially the allocation of risks, possible. By allowing NedMobiel in later stages to manually adjust the risks in the model, the model can be corrected for individual cases.
Second, a suitable risk assessment model will be chosen to be researched. Appropriate risk models for the subject researched will be listed. The analytic hierarchy process will be used to operationalize the criteria; reporting, usability, feasibility, correlation between risks, awareness and adding data and risks and rank the various models accordingly. From this ranking the appropriate risk model will be chosen.
When the key risks are clear, the third step is to find data using expert views on this topic, both from within and outside the infrastructure sector, or information about past projects. This can be done either by: looking at the current qualitative method, to get an idea and building further on this by looking at expert views; or by synthetically determining the distribution, using a database of
projected risks and outcomes of past projects. The former method will in this case be used because a database is not readily available and needs to be build the coming years. This implicitly means that you must quantify the risks based on (tacit) knowledge. Thus the main method of gathering data is by consulting experts and going through the list as defined in the second chapter. The experts will judge every risk on its impact, chance, timing which is aggregated to fit a probability distribution per risk. A standard contract will be used to gather data. This standard contract is defined as an O&M contract in the Netherlands with:
• a duration of 20 years (i.e., excluding 5 years EPC);
• a contract price of 1 billion euro;
• not transferable and no prolongation;
• light maintenance (vs. heavy maintenance);
• frequency based maintenance (vs. performance based maintenance);
• having an availability fee (i.e., no tolling); and
• no readjustments during the lifetime of the contract.
The fourth step is the building of the model which will be done in Visual Basic for Applications (VBA) and Microsoft Excel. Microsoft Excel (and its underlying method of modeling, VBA) will be used since this is the program that NedMobiel is familiar with. By ensuring that a familiar program is used, it is more likely that NedMobiel will be able to work with and adjust the model after delivery.
Chapter 2
Chapter 2 describes the key risks that will be used. First, the method to define the key risks is stated (§2.1) after which the key risks at a broad level are determined (§2.2). The next paragraph states the specific key risks which will be used and these risks will be split out in more detail (§2.3). The chapter ends with a conclusion (§2.4).
2. The key risks in an O&M contract
2.1 Method to define the key risks
n this chapter the key risks are identified that play a role in operation & maintenance (O&M) contracts. It is difficult to compose a list that is both comprehensive and feasible in terms of usability in this research as well as for NedMobiel. A list of literally every risk thinkable is surely comprehensive, but not at all feasible to model in this research or use in practice. From another point of view, a list of too little risks is both not comprehensive as it is not useful in practice (but it may be quick to model). So an optimum has to be found, where the word ‘optimum’ is quite subjective. To define optimum in this case; a list of risks is comprehensive and feasible if the list is both extensive enough as defined by NedMobiel (it can be used in practice) as well as narrow enough (that it can be modeled) as defined by the author. The reason that the former decision maker is NedMobiel is because this research is conducted for NedMobiel. The latter decision maker is the author because this research has a limited time and scope which certainly needs to be taken into account.
[image:25.595.207.392.556.630.2]The method to find a complete list is to approach the project from different angles: from the 7S framework, RISMAN, scientific literature, interviews and existing O&M contracts (see Figure 9). The 7S framework, RISMAN and existing O&M contracts are used to get an idea of the categories that could be formed. Scientific literature is used to come up with a raw list of risk which is fine-tuned in interviews. Concluding sessions were used to be sure that the list of risks was compliant with the needs of NedMobiel. Using these five different angles, it is ensured that a good qualitative list is gathered.
Figure 9 Different perspectives to define a complete list of risks
The 7S framework (Rasiel & Friga, 2001) is a McKinsey management model to describe how a company operates and it has seven categories. The RISMAN method of working is already described in the first chapter, to use the method there are several categories (van der Tak & Lindenaars, 2008). Table 2 shows the categories for both methods, which are not linked.
Method 7S framework RISMAN Shared values Demographic Strategy Economic Structure Environment Systems Politics
Staff Technology
Style Laws and Regulation Skills Society
Organizational Table 2 Different categories of the 7S framework and RISMAN
For the determination of the risks, the scope will not only be O&M contracts but it will also be
extended to the risks that come in play when designing or constructing the project. It is reasonable to assume that if there is a design flaw or a construction error, there will likely be some consequences for the operator as well. So instead of just looking at O&M contracts, the focus will be on PPP projects as a whole and all the (relevant) risks that can be in place. There were no contradictions found in the literature and to the authors knowledge there is not yet a ‘standard’ list available. A check was done internally at NedMobiel with various employees to check for completeness at the various levels. Risks are defined at different levels to be able to keep a clear overview. The 1st level consists of the macro, meso and micro level. Macro level risks are autonomous processes of the entire economy around a project. The micro level risks look at the individual projects and how several forces are at play there. The meso level risks lie between the macro and micro level and look at the interaction between the project and various other aspects. Li (2003), as presented in Li, Akintoye, Edwards & Hardcastle (2005), puts it in the following way:
1st level Description
Macro The macro level of PPP risk comprises risks source exogenously, i.e., external to the project itself.
Meso The meso level of PPP risk includes risks sourced endogenously, e.g., the communication risk between the EPC and O&M contractor.
Micro The micro level of PPP risk represents the risks within a certain project, e.g., the risk of organizational capabilities of NedMobiel.
Table 3 Description of the macro, meso and micro level
The levels are meant as an in-depth way of describing the risks. The second level comprises broad categories while looking at the first level. The third level consists of more detailed risks based on the second category, etcetera. Figure 10 gives a graphical example how a specific risk is comprised from the different levels. Another explanation in words could be: define ‘Meso level risk’ which could be further specified as ‘Ownership risk’ which could be further specified as ‘Indirect damage to the assets risk’ which could in turn be further specified as ‘Weather conditions’. As said before, it is possible to continue this specification and arrive at a very specific level of risk. A very specific
Weather conditions (e.g., a landslide)
Indirect damage to the assets Ownership
Meso level risk 1st level
3rd level 2nd level
[image:27.595.175.420.70.188.2]4th level
Figure 10 Example of the four different risk levels
The specification is done until the fourth level. The fourth level is deducted from the third level, which is derived from scientific literature. Since there was little to no research available for the fourth level risks, this level was created by brainstorming internally with various employees at NedMobiel. Again, a check was made for consistency and completeness.
To determine which risks should be included in the model, there will be a specific focus on the internal risks. These internal risks are defined as the risks that influence the cash flow of the operator directly during the concession period and are in place after closing the contract. The external risks are the risks that influence the cash flow indirectly and qualify as the ‘unknown unknown’ risks. In other words, risks that you do not know that will be there and cannot be quantified. These definitions are tailored specifically to the wishes of NedMobiel, such that the final model fits these specific wishes. In practice this means that NedMobiel will determine which risks qualify as internal risks.
The internal risks will be specified up to the aforementioned fourth level risks and the gathering of data belonging to these risks will be treated in chapter four. These internal risks account for a substantial part of the risks that come in play when looking at the cash flow. Beforehand it is expected that data about the external risks will cost too much effort to find while the impact of finding the data is marginal compared to the internal risks. The external risks will be treated as more fixed and a fixed percentage will be taken for these risks. These risks will in practice be treated at the first level due to the fact that data is not (at all) available. A follow up of this research would be to subtract data from future (or current) O&M contracts or by performing additional research on these risks.
This list is in no means a way of describing how much risk NedMobiel should allocate to itself, since that is up to the company to decide. There is a trade-off between risk and return; i.e., the higher the risk taken, the higher the return that can be realized. This is due to the fact that there is also a higher risk at a downturn, i.e., a loss. An important note is that this trade-off is between risk and expected return, not the actual return. The expected return is defined as the mean value of the ‘return’ variable (Hull, 2010). This determination of risk preference is explicitly not part of this research. The model will assist NedMobiel in determining the risks of future O&M contracts.
performed by companies) enhances this statement. The sources varied in the way of assessing risks and most of them did not categorize risks at different levels.
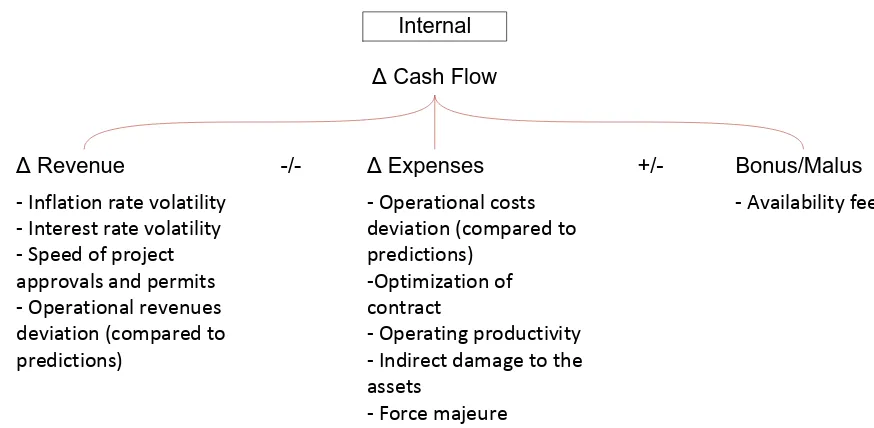
An existing contract was used to check the combined list. Internal and external interviews where performed to verify the applicability of the list in practice. The list was then reviewed and discussed internally with a risk manager & managing partner, director & managing partner, senior project manager & managing partner, project managers and the operations manager PPP. Given the scope of the third level, this list is according to both the author as NedMobiel comprehensive and feasible. Being an operator for so many years clearly puts a major focus on the deviations (Δ) of the cash flow of the organization. As stated earlier, the standard model as defined by NedMobiel does not take the investments into account as this is about ‘light’ maintenance. This cash flow will be the standard to determine the third level risks that are relevant for the risk model. For the cash flow of the operator during the O&M period, a simple formula can be defined:
𝛥𝐶𝑎𝑠ℎ𝐹𝑙𝑜𝑤=𝛥𝑅𝑒𝑣𝑒𝑛𝑢𝑒 − 𝛥𝐸𝑥𝑝𝑒𝑛𝑠𝑒𝑠±𝐵𝑜𝑛𝑢𝑠/𝑀𝑎𝑙𝑢𝑠
The internal factors that play a direct role in determining the cash flow are marked in the table. Recall that these internal risks are selected by NedMobiel and that these (and other) risks can easily be in- and excluded in the model, depending on the wishes of NedMobiel that may vary per project. The criterion to select the internal factors is: influence on the direct cash flow of the operator. These internal factors will be specified further on in this document to a fourth level. Note that the term ‘internal’ refers to the risks that NedMobiel wants to take into account which in turn is defined as the risks that have a direct impact on the cash flow of being an operator.
The list of risks that followed from the literature search, the check with and existing O&M contract, multiple interviews and brainstorm sessions is shown in Table 4.
1st level risks 2nd level risks Internal 3rd level risks Macro level
risks Country Government stability Corruption
Public decision-making process errors Credit risk of the public sector entity Political point of view regarding the project Macroeconomic Financial market health
√ Inflation rate volatility √ Interest rate volatility
Competition (exclusive right) Influential economic events
Legal Legislation change
Contractual risk
Change in tax regulation Industrial regulatory change
Weather conditions Archeological findings
Meso level risks Project
selection Land acquisition (site availability) Level of demand for project (competitors) (Project)
finance Availability of finance Financial attraction of project to investors Maintaining finance (including changes to loan conditions)
Foreign currency exchange Level of financing costs
Design √ Speed of project approvals and permits Design quality
Knowledge of engineering techniques Construction Completion time
Construction costs deviation (compared to predictions)
Environmental events Material/labor availability Level of design changes Quality workmanship Level of contract variation
Solvency of sub-contractors and suppliers Operation √ Operational costs deviation (compared to
predictions) √ Availability fee
Environmental events √ Optimization
Condition of facility Operator solvability Staff training Tariff change
√ Operational revenues deviation (compared to predictions)
√ Operating productivity Ownership √ Indirect damage to the assets
Technology change
Concession changes by the government
Federal and state legislation/regulation changes Public/third-party liabilities
Realization of the residual value of assets Residual/force
majeure √ Force majeure
Experience in PPP
Distribution of responsibilities and risks Distribution of authority in partnership
Differences in working method and know-how between partners
Level of commitment from either partner Third party Third party tort liability
Staff events Table 4 Key risks up to the third level
Table 4 is composed using the following sources: (Dailami, Lipkovich, & van Dyck, 1999), (Lessard & Miller, 2001), (Yescombe, 2002), (Yescombe, 2007), (Grimsey & Lewis, 2002), (Grimsey & Lewis, 2004), (Li, 2003), (Li, Akintoye, Edwards, & Hardcastle, 2005), (Flyvbjerg, Bruzelius, & Rothengatter, 2003), (Flyvbjerg, 2006), (Hodge, 2004), (Ng & Loosemore, 2006), (Gatti, Rigamonti, Saita, & Senati, 2007), (Roumboutsos & Anagnostopoulos, 2008), (Tinsley, 2009), (Ke, Wang, & Chan, 2010), (Ke, Wang, Chan, & Lam, 2010), (Xu, Chan, & Yeung, 2010). This list is set up by looking at already published articles/books about risk management in PPPs, while taking the categories of the 7S framework and RISMAN in mind. The criteria on which the papers are selected are: fit in research scope, year of publication and relevance/application to risk management in PPPs. A summary was made from the remaining appropriate articles and there was a check on consistency (no
contradictions between articles) and completeness (how many new risks were found). Key criterion to compose the list was that it should be collectively exhaustive. All of the categories taken together should deal with all possible options without leaving any gaps (Rasiel E. M., 1999). The list that was created from this search was checked with an existing O&M contract. In subsequent internal interviews and brainstorm sessions, the list was checked again with several people. This process led eventually to the list in Table 4.
In most contracts, there will be risk allocation. Optimal risk allocation is about distributing risks to parties that can best manage the specific risk. Where managing stands in this case for measuring and, through their actions, minimizing the risk (de Bettignies & Ross, 2004). This minimization of risks for the government does not mean that all risks should account with the private sector, which is often a misperception in countries that are not yet familiar with PPPs (Jin & Zhang, 2010). It has been specifically chosen not to allocate risks beforehand. The main reason is because NedMobiel does not want to assume that risks can be allocated to another party (i.e., the government) at zero costs and that allocation will vary for different projects. For this reason, NedMobiel wants to include all the risks in the model if they can be allocated to them.
Δ Expenses
Δ Revenue -/- +/- Bonus/Malus Internal
Δ Cash Flow
- Inflation rate volatility - Interest rate volatility - Speed of project approvals and permits - Operational revenues deviation (compared to predictions)
- Operational costs deviation (compared to predictions)
-Optimization of contract
- Operating productivity - Indirect damage to the assets
- Force majeure
- Availability fee
Figure 11 Internal risks at the second level related to cash flow
Bonus/malus is at request of NedMobiel a separate category. The measurement of these risks
depends on specific contracts and is treated in chapter 4. A short explanation per risk is given in Table 5.
Risk Explanation
Inflation rate volatility A measure of fluctuations in inflation rate. Interest rate volatility A measure of fluctuations in interest rate. Speed of project approvals
and permits If there is a delay in the start date of operation & maintenance contract, there will be a loss of revenue. Operational revenues
deviation (compared to predictions)
The demand of traffic can affect the revenues for the operator.
Operational costs deviation
(compared to predictions) Costs associated with operating and maintenance can deviate from predictions and thus adjust the expenses. Optimization of contract The adjustments made to the EMVI that will affect the expenses
of the operator.
Operating productivity Deviations from the productivity as predicted will adjust the expenses.
Indirect damage to the assets Direct damage will likely be insured, but the associated indirect damage will affect the expenses of the operator.
Force majeure An event that affects the ability of one party to fulfill its contract, but that is not the fault of, and could not reasonably have been foreseen by, that party.
[image:31.595.73.510.66.280.2]Availability fee If the percentage availability deviates from predictions, there can be a bonus/malus for the operator.
Table 5 Explanation of the internal risks
2.3 Key internal risks at the fourth level
The reason that a fourth level is necessary is because the third level is inadequate to determine the corresponding parameters per risk. The determination of the parameters that will be used is described in chapter 4 and comprises the impact, chance and timing per risk.
One reason that the third level is inadequate is because the third level risks are multi-interpretable and the perceptions to different people would differ too much to get accurate results. Thus, the risks need to be defined one step deeper to come to detailed results which are useful and adequate. As said before, literature did not get deeper than the third level. Thus, brainstorm sessions with operational managers were organized to find the third level risks based on the internal second level risks. The boundary conditions of the sessions were the determination of the fourth level risks of the corresponding internal risks. Criteria on which the fourth level risks were assessed: collectively exhaustive, specificity (deeper than the third level but not too deep) and influence of the cash flow for the operator.
Both inflation and interest rate volatility are already specific enough to gather country specific data. The other third level risks were specified such that it is possible to determine a chance, impact and time aspect of the risk. These three parameters are the data that will be collected as can be read in chapter four. Chance (𝑋𝑖) refers to the possibility expressed in percentages that a certain risk will occur. Impact (𝑌𝑖) will be the amount of money involved if the risk occurs, expressed in a percentage of the contract price. The time aspect refers to the point in time that a certain risk, given its chance and impact, will occur. The time aspects (𝑍𝑖) is measured in a percentage of the total time of the project were there is the largest chance that the risk will occur. The notation i refers to a specific fourth level risk. Table 6 shows the outcome of the sessions and the fourth level risks.
3rd level risks 4th level risks Inflation rate volatility -
Interest rate volatility - Speed of project approvals and
permits EPC to O&M transfer of property Communication risk: expectations about deliverables Time to get an approval
Operational revenues deviation
(compared to predictions) Number of cars on the road Quality of maintenance Availability of the road Measuring availability Operational costs deviation
(compared to predictions) Maintenance costs deviation (compared to predictions), e.g., extra incidents, loan changes, weather conditions, price of materials, electricity prices, extra traffic, etc.
Maintenance frequency deviation (compared to predictions) Technological developments
Safety issues, e.g., changing the maximum speed
Operating productivity Efficiency of organization, e.g., communication, techniques, supply route, etc.
Weather conditions Low level of education
Indirect damage to the assets Weather conditions, e.g., dust, mud, landslides, etc. Cause of damage unidentifiable
Overhead costs, e.g., office and staffing costs
Force majeure Natural disasters
Terrorist attack
Labor disputes and strikes
Availability fee Credit risk of the public sector entity
Measuring method, e.g., how to measure additional performance
Costs of measuring higher than bonus
[image:33.595.70.532.72.337.2]Due to culture no motivation to achieve the bonus Table 6 The 4th level risks corresponding to the internal risks
2.4 Conclusion of the key risks in an O&M contract
By using different perspectives, a list of key risks is composed that will serve as the components of the model. A literature study was used to come up with a rough list of risks. These risks where then split into different levels of specificity. Performing internal and external interviews made sure that the list was compared with practice. Several internal brainstorm sessions were then set up to ensure that the list of key risks was tailored to the specific needs of NedMobiel. Key risks were selected by NedMobiel by looking at the risks that were directly of influence at the cash flow when being an operator. These ten key risks were specified further which resulted in a list of thirty risks that will be used in the model. The model will be flexible enough to easily add or delete risks, such that
Chapter 3
Chapter 3 describes the choice for a certain kind of risk model. A list of risk models that will be part of the evaluation process is given (§3.1) after which the multi criteria decision analysis method how to choose the most appropriate risk model is given (§3.2). The outline of this method is given including the criteria which are used to assess the models (§3.3) and the actual results from the application of the method is presented (§3.4). Lastly there is a wrap-up and a conclusion (§3.5).
3. Choice of a risk model
3.1 Various risk models to choose from
choice for a specific risk model will be made in this chapter. It has to be taken into
consideration that the model will not provide ‘the’ answer, but that it will be the foundation to or an indication for an answer. As already shown in section 1.4 the model will give rise to a risk dossier which will be part of the decision making process.
This research is about developing a statistical model for NedMobiel. This does not mean that such a model is enough for a risk dossier. Given the nature of operation & maintenance (O&M) contracts a qualitative analysis should always be made. A list of possible and feasible risk models is chosen in dialogue with NedMobiel. Criteria used to make an initial assessment of the models were: applicability to O&M contracts; general feasibility in terms of time, money and usability for
NedMobiel; and the possibility to include all the risks. For instance, a checklist is also a risk model but is as a stand-alone model clearly not a suitable method in identifying and assessing all the risks that come with an O&M contract. The risk models that remained are shown in Table 7.
Risk Models Description
Mathematically simple models
EGAP (Everything goes according to plan) Model that looks at risks with an ex-ante optimism bias
RISMAN/MLD (Most likely development) Focus is on identifying the most likely risks FMECA (Failure mode effect and criticality
analysis) Bottom-up, inductive analytical method including a criticality analysis, which is used to chart the probability of failure modes against the severity of their consequences
IPRA (International project risk assessment
model) A risk breakdown structure which puts risks in certain categories Cause-and-effect diagrams Illustrate the interrelations between risks and their
causes
Statistically sophisticated models
VaR/CFaR (Value at Risk/Cash Flow at Risk) Computer algorithms are used to calculate the maximum that the institution could lose in a given time period given a certain confidence level
ES (Expected Shortfall) An alternative to VaR focusing on the expected loss
Probabilistic/stochastic model simulation
(e.g., Monte Carlo method) To obtain the cumulative likelihood distributions of the project’s objectives using probabilistic estimation of the input parameters
Sensitivity analysis Discover the criticality of various project parameters
Table 7 Various risk models to choose from
From this list, a statistically sophisticated model will be chosen using the AHP method as described in the next paragraph. Given the fact that RISMAN is already used widely as a qualitative risk model and there is not yet an alternative, it is assumed that the RISMAN method will be continued in the (short) future. The quantitative model that is the output of this research will be used to determine the risk premium. The model that will be chosen is explained in detail in chapter five.
3.2 Choosing a risk model is done by using the Analytic Hierarchy Process
(AHP) method
A first note about the mathematically simple models is the fact that they are not mutually exclusive. For the use of for instance a VaR/CFaR or ES model, a model simulation is also used. Simplistically saying, model simulation is a simple version of the former models. In the choice of a statistical model, the distinction between microstructural and reduced form models can be made. The former models are fully pre-specified, meaning that the input of the model is fixed and that all parties involved know the distribution of the input parameters. An advantage is that you know that everything is accounted for, but the clear disadvantage is the fact that such a model is not possible for O&M contracts. The reduced form models are less ambitious