Benzylammonium heptanoate
Mary H. Wood and Stuart M. Clarke*
BP Institute and Department of Chemistry, University of Cambridge, Cambridge, England
Correspondence e-mail: [email protected]
Received 20 February 2013; accepted 8 April 2013
Key indicators: single-crystal X-ray study;T= 180 K; mean(C–C) = 0.002 A˚; Rfactor = 0.054;wRfactor = 0.141; data-to-parameter ratio = 19.8.
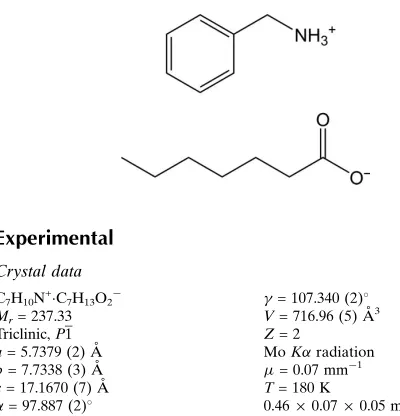
The title 1:1 stoichiometric salt, C7H10N +
C7H13O2
, is formed by proton transfer between heptanoic acid and benzylamine. This combination contrasts to the recently published 2:1 acid– amine adduct of cation, anion and neutral acid molecule from the same components [Wood & Clarke (2013). Acta Cryst. E69, o346–o347]. There are N—H O hydrogen bonds of moderate strength in the structure [the most important graph-set motifs are R24(8) andR44(12)], as well as weak C—H O
interactions.
Related literature
For spectroscopic studies of acid–amine complexes, see: Kohler et al. (1981); Karlsson et al. (2000); Paivarintaet al.
(2000); Smithet al.(2001, 2002). For recent diffraction studies of acid–amine complexes, see: Jeffersonet al.(2011); Sunet al.
(2011); Wood & Clarke (2012a,b, 2013). For the categorization of hydrogen bonds, see Gilli & Gilli (2009). For graph-set motifs, see Etteret al.(1990).
Experimental
Crystal data
C7H10N+C7H13O2
Mr= 237.33
Triclinic,P1
a= 5.7379 (2) A˚
b= 7.7338 (3) A˚
c= 17.1670 (7) A˚ = 97.887 (2)
= 92.864 (2)
= 107.340 (2) V= 716.96 (5) A˚3
Z= 2
MoKradiation = 0.07 mm1
T= 180 K
0.460.070.05 mm
Data collection
Nonius KappaCCD diffractometer Absorption correction: multi-scan
(SORTAV; Blessing, 1995)
Tmin= 0.874,Tmax= 0.999
8415 measured reflections 3253 independent reflections 2308 reflections withI> 2(I)
Rint= 0.043
Refinement
R[F2> 2(F2)] = 0.054
wR(F2) = 0.141
S= 1.03 3253 reflections 164 parameters
H atoms treated by a mixture of independent and constrained refinement
max= 0.32 e A˚
3
min=0.19 e A˚
[image:1.610.314.565.236.301.2] [image:1.610.48.248.521.729.2]3
Table 1
Hydrogen-bond geometry (A˚ ,).
D—H A D—H H A D A D—H A
N1—H1A O2 0.99 (2) 1.80 (2) 2.7802 (17) 168.7 (19) N1—H1B O1i
0.98 (2) 1.73 (2) 2.6993 (17) 169 (2) N1—H1C O2ii
1.00 (2) 1.87 (2) 2.8590 (18) 167 (2) C1—H1E O1iii 0.99 2.40 3.280 (2) 148
C7—H7 O2 0.95 2.52 3.3528 (19) 146
Symmetry codes: (i)xþ1;y;z; (ii)xþ1;y;z; (iii)xþ1;yþ1;z.
Data collection: COLLECT (Nonius, 1998); cell refinement: SCALEPACK(Otwinowski & Minor 1997); data reduction:DENZO (Otwinowski & Minor, 1997) andSCALEPACK; program(s) used to solve structure:SIR92(Altomareet al., 1993); program(s) used to refine structure:SHELXL97(Sheldrick, 2008); molecular graphics: Mercury(Macraeet al., 2008); software used to prepare material for publication:SHELXL97.
We thank the Department of Chemistry, the BP Institute and the Oppenheimer Trust for financial and technical assis-tance, and Dr J. E. Davies and Dr A. D. Bond for assistance in collecting and analysing the X-ray data.
Supplementary data and figures for this paper are available from the IUCr electronic archives (Reference: FB2281).
References
Altomare, A., Cascarano, G., Giacovazzo, C. & Guagliardi, A. (1993).J. Appl. Cryst.26, 343–350.
Blessing, R. H. (1995).Acta Cryst.A51, 33–38.
Etter, M. C., MacDonald, J. C. & Bernstein, J. (1990).Acta Cryst.B46, 256–262. Gilli, G. & Gilli, P. (2009).The Nature of the Hydrogen Bond. Outline of a Comprehensive Hydrogen Bond Theory. International Union of Crystal-lography. Oxford Science Publications. p. 61. New York, Oxford: Oxford University Press, Inc.
Jefferson, A. E., Sun, C., Bond, A. D. & Clarke, S. M. (2011).Acta Cryst.E67, o655.
Karlsson, S., Backlund, S. & Friman, R. (2000).Colloid Polym. Sci.278, 8–14. Kohler, F., Atrops, H., Kalali, H., Liebermann, E., Wilhelm, E., Ratkovics, F. &
Salamon, T. (1981).J. Phys. Chem.85, 2520–2524.
Macrae, C. F., Bruno, I. J., Chisholm, J. A., Edgington, P. R., McCabe, P., Pidcock, E., Rodriguez-Monge, L., Taylor, R., van de Streek, J. & Wood, P. A. (2008).J. Appl. Cryst.41, 466–470.
Nonius (1998).COLLECT. Nonius BV, Delft, The Netherlands.
Otwinowski, Z. & Minor, W. (1997). Methods in Enzymology, Vol. 276,
Macromolecular Crystallography, Part A, edited by C. W. Carter Jr & R. M. Sweet, pp. 307–326. New York: Academic Press.
Paivarinta, J., Karlsson, S., Hotokka, M. & Poso, A. (2000).Chem. Phys. Lett. 327, 420–424.
Sheldrick, G. M. (2008).Acta Cryst.A64, 112–122.
organic compounds
Acta Cryst.(2013). E69, o755–o756 doi:10.1107/S1600536813009574 Wood and Clarke
o755
Acta Crystallographica Section E
Structure Reports
Online
J. Chem.55, 349–356.
Smith, G., Wermuth, U. D., Bott, R. C., White, J. M. & Willis, A. C. (2001).
Aust. J. Chem.54, 165–170.
(2011).Langmuir,27, 3626–3637.
supporting information
sup-1 Acta Cryst. (2013). E69, o755–o756
supporting information
Acta Cryst. (2013). E69, o755–o756 [https://doi.org/10.1107/S1600536813009574]
Benzylammonium heptanoate
Mary H. Wood and Stuart M. Clarke
S1. Comment
There exist in the literature a number of examples of complexes formed between alkyl amines and carboxylic acids.
These have been identified by a number of experimental methods, such as NMR and IR spectroscopy (e. g. Karlsson et
al., 2000; Paivarinta et al. (2000); Smith et al. (2001, 2002)). Unfortunately, the atomic details of the materials and hence
the nature of the bonding that can be obtained from single-crystal diffraction has only been determined in a few cases.
This is partly due to the challenges in growing crystals large enough to be suitable for single-crystal diffraction. Some
crystals of sufficient size have been grown (e. g. Jefferson et al. (2011); Wood & Clarke, 2012a, 2012b). Of the
stoichiometic combinations reported to date, the majority have been 1:1 complexes, though some 2:1 and even 3:1
examples have been reported by calorimetry and NMR spectroscopy, generally when the environment is acid-rich (e. g.
Kohler et al., 1981; Sun et al., 2011), and very recently using single-crystal diffraction (Wood & Clarke, 2013).
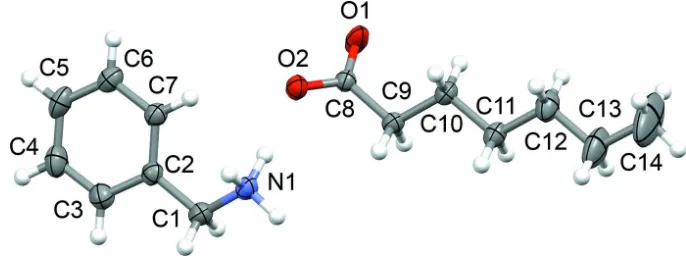
Here we report growth of a suitable crystal for single-crystal X-ray diffraction of a 1:1 complex formed between
heptanoic acid and benzylamine (Figs. 1 and 2). This work follows a previous publication (Wood & Clarke, 2013) in
which an acid-rich 2:1 complex formed between these two species is described. In the previous work, one acid molecule
donates its proton to the amine group and one acid group retains its proton. The hydrogen bonding extends across both
the ions and the neutral acid molecule.
As described below, the sample of the present study was grown by vapour phase condensation. Each preparation
resulted in a batch of several crystals. The crystal used in this present study was taken from a different region of the same
batch of samples as for the 2:1 combination (Wood & Clarke, 2013). We attribute the combination of compositions to the
concentration gradients across the vapour streams in the preparation.
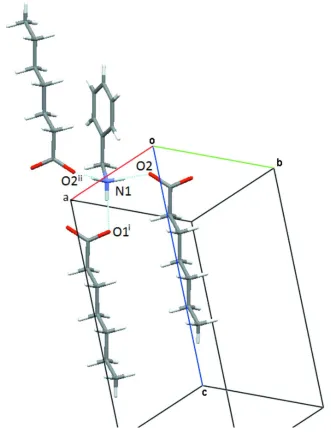
In the crystal structure of the 1:1 complex (Figs. 1 and 2), each acid anion is involved in N-H···O hydrogen bonds of
moderate strength (Gilli & Gilli, 2009) with three surrounding amine molecules (Table 1; Fig. 2), and vice versa each
benzylammonium group donates its hydrogen to three different heptanoate molecules. The most important graph set
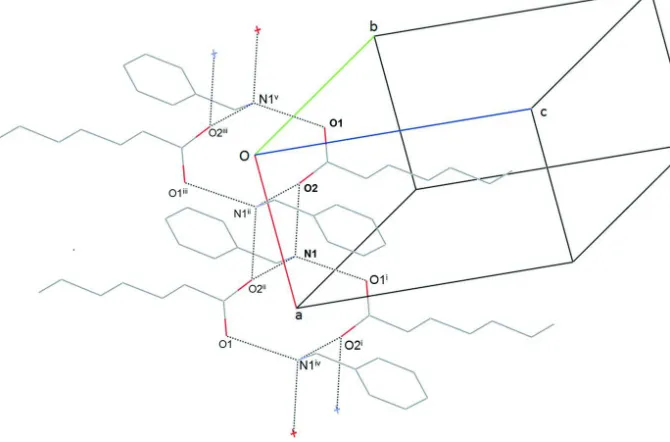
motifs are R2
4(8) (Etter et al., 1990) - see Fig.3. (In this motif the donated atoms are H1a and H1c and the acceptors are
the O2 atoms.) The other important motif is R4
4(12) with donated hydrogens H1b and H1c and accepting oxygens O1 and
O2 (Fig. 3.). Moreover, there are also weak C-H···O interactions present in the structure (Table 1).
S2. Experimental
Benzylamine and heptanoic acid (purities 99.7% and 99.8% respectively, determined by titration and gas
chromatography) were purchased from Sigma Aldrich and used without further purification. A small volume of amine
(approximately 1 ml) was placed into a small vial that was itself placed within a larger vial containing a similar volume
of the acid, and left in an inert atmosphere. Extensive crystal growth was observed after a few weeks, particularly on a
All the hydrogens were discernible in the difference electron density map. Nevertheless, the hydrogens attached to the C
atoms were situated in the idealized positions and refined under these constraints: Caryl-Haryl=0.95, Cmethyl-Hmethyl=0.98,
Cmethylene-Hmethylene=0.99 Å. Ueq(Haryl)=1.2Uiso(Caryl), Ueq(Hmethylene)=1.2Uiso(Cmethylene), Ueq(Hmethyl)=1.5Uiso(Cmethyl). The
positional parameters of the hydrogens attached to N of the benzylammonium cation were freely refined while their
[image:4.610.131.474.168.304.2]Ueq(HN)=1.5Uiso(HN).
Figure 1
Title molecules with atom labels. The displacement ellipsoids are drawn at the 50% probability level for non-H atoms. H
supporting information
[image:5.610.140.471.70.506.2]sup-3 Acta Cryst. (2013). E69, o755–o756
Figure 2
Figure 3
A section from the hydrogen bond pattern in the title structure. The symmetry codes: i: 1+x, y, z; ii: 1-x, -y, -z; iii: -x, -y,
-z; iv: 2-x, -y, -z; v: -1+x, y, z.
Benzylammonium heptanoate
Crystal data
C7H10N+·C7H13O2− Mr = 237.33
Triclinic, P1 Hall symbol: -P 1
a = 5.7379 (2) Å
b = 7.7338 (3) Å
c = 17.1670 (7) Å
α = 97.887 (2)°
β = 92.864 (2)°
γ = 107.340 (2)°
V = 716.96 (5) Å3
Z = 2
F(000) = 260
Dx = 1.099 Mg m−3
Mo Kα radiation, λ = 0.71073 Å Cell parameters from 9084 reflections
θ = 1.0–27.5°
µ = 0.07 mm−1 T = 180 K Needle, colourless 0.46 × 0.07 × 0.05 mm
Data collection
Nonius KappaCCD diffractometer
Radiation source: fine-focus sealed tube Graphite monochromator
ω and φ scans
Absorption correction: multi-scan (SORTAV; Blessing, 1995)
Tmin = 0.874, Tmax = 0.999
8415 measured reflections 3253 independent reflections 2308 reflections with I > 2σ(I)
Rint = 0.043
θmax = 27.5°, θmin = 3.6°
h = −7→7
k = −10→9
supporting information
sup-5 Acta Cryst. (2013). E69, o755–o756
Refinement
Refinement on F2
Least-squares matrix: full
R[F2 > 2σ(F2)] = 0.054 wR(F2) = 0.141 S = 1.03 3253 reflections 164 parameters 0 restraints 82 constraints
Primary atom site location: structure-invariant direct methods
Secondary atom site location: difference Fourier map
Hydrogen site location: difference Fourier map H atoms treated by a mixture of independent
and constrained refinement
w = 1/[σ2(Fo2) + (0.0544P)2 + 0.2301P]
where P = (Fo2 + 2Fc2)/3
(Δ/σ)max < 0.001
Δρmax = 0.32 e Å−3
Δρmin = −0.19 e Å−3
Special details
Geometry. All e.s.d.'s (except the e.s.d. in the dihedral angle between two l.s. planes) are estimated using the full
covariance matrix. The cell e.s.d.'s are taken into account individually in the estimation of e.s.d.'s in distances, angles and torsion angles; correlations between e.s.d.'s in cell parameters are only used when they are defined by crystal symmetry. An approximate (isotropic) treatment of cell e.s.d.'s is used for estimating e.s.d.'s involving l.s. planes.
Refinement. Refinement of F2 against ALL reflections. The weighted R-factor wR and goodness of fit S are based on F2,
conventional R-factors R are based on F, with F set to zero for negative F2. The threshold expression of F2 > σ(F2) is used
only for calculating R-factors(gt) etc. and is not relevant to the choice of reflections for refinement. R-factors based on F2
are statistically about twice as large as those based on F, and R- factors based on ALL data will be even larger.
Fractional atomic coordinates and isotropic or equivalent isotropic displacement parameters (Å2)
x y z Uiso*/Ueq
N1 0.7763 (2) 0.1651 (2) −0.04200 (8) 0.0352 (3)
H1A 0.630 (4) 0.195 (3) −0.0239 (11) 0.053*
H1B 0.919 (4) 0.247 (3) −0.0072 (12) 0.053*
H1C 0.752 (4) 0.033 (3) −0.0380 (11) 0.053*
C1 0.8129 (3) 0.1865 (2) −0.12452 (9) 0.0363 (4)
H1D 0.9629 0.1556 −0.1381 0.044*
H1E 0.8402 0.3168 −0.1298 0.044*
C2 0.6010 (3) 0.06878 (19) −0.18296 (9) 0.0300 (3)
C3 0.6366 (3) 0.0514 (2) −0.26288 (10) 0.0407 (4)
H3 0.7927 0.1102 −0.2790 0.049*
C4 0.4468 (4) −0.0507 (3) −0.31918 (10) 0.0478 (5)
H4 0.4734 −0.0608 −0.3736 0.057*
C5 0.2196 (3) −0.1378 (2) −0.29682 (10) 0.0448 (4)
H5 0.0898 −0.2079 −0.3356 0.054*
C6 0.1819 (3) −0.1225 (2) −0.21798 (10) 0.0379 (4)
H6 0.0259 −0.1830 −0.2022 0.045*
C7 0.3712 (3) −0.0191 (2) −0.16130 (9) 0.0327 (4)
H7 0.3430 −0.0084 −0.1070 0.039*
O1 0.1339 (2) 0.37947 (17) 0.06866 (7) 0.0499 (4)
O2 0.35258 (19) 0.20902 (14) 0.01788 (6) 0.0345 (3)
C8 0.3307 (3) 0.34204 (19) 0.06561 (8) 0.0274 (3)
C9 0.5477 (3) 0.4606 (2) 0.12239 (8) 0.0297 (3)
H9A 0.5971 0.5868 0.1097 0.036*
H10A 0.3462 0.5117 0.2151 0.037*
H10B 0.4458 0.3413 0.2217 0.037*
C11 0.7043 (3) 0.5911 (2) 0.26616 (9) 0.0346 (4)
H11A 0.8487 0.5476 0.2590 0.042*
H11B 0.7467 0.7172 0.2535 0.042*
C12 0.6502 (4) 0.5962 (2) 0.35193 (10) 0.0472 (5)
H12A 0.6043 0.4697 0.3643 0.057*
H12B 0.5081 0.6423 0.3594 0.057*
C13 0.8663 (5) 0.7167 (3) 0.40931 (11) 0.0747 (7)
H13A 1.0069 0.6686 0.4025 0.090*
H13B 0.9147 0.8422 0.3958 0.090*
C14 0.8143 (8) 0.7273 (5) 0.49474 (15) 0.1389 (17)
H14A 0.9597 0.8085 0.5281 0.208*
H14B 0.7732 0.6044 0.5094 0.208*
H14C 0.6761 0.7758 0.5023 0.208*
Atomic displacement parameters (Å2)
U11 U22 U33 U12 U13 U23
N1 0.0267 (7) 0.0391 (8) 0.0357 (7) 0.0102 (6) −0.0036 (6) −0.0059 (6) C1 0.0289 (8) 0.0376 (8) 0.0371 (8) 0.0054 (7) 0.0018 (7) −0.0003 (7) C2 0.0310 (8) 0.0260 (7) 0.0320 (8) 0.0096 (6) 0.0007 (6) −0.0001 (6) C3 0.0426 (9) 0.0408 (9) 0.0362 (9) 0.0095 (8) 0.0054 (7) 0.0040 (7) C4 0.0623 (12) 0.0500 (10) 0.0280 (8) 0.0155 (9) −0.0009 (8) 0.0016 (7) C5 0.0487 (10) 0.0405 (9) 0.0379 (9) 0.0101 (8) −0.0157 (8) −0.0032 (7) C6 0.0330 (8) 0.0344 (8) 0.0428 (9) 0.0075 (7) −0.0044 (7) 0.0033 (7) C7 0.0307 (8) 0.0337 (8) 0.0314 (8) 0.0087 (6) −0.0008 (6) 0.0014 (6) O1 0.0302 (6) 0.0555 (8) 0.0574 (8) 0.0210 (6) −0.0126 (5) −0.0247 (6) O2 0.0326 (6) 0.0328 (6) 0.0359 (6) 0.0119 (5) 0.0001 (5) −0.0052 (5) C8 0.0275 (7) 0.0272 (7) 0.0264 (7) 0.0079 (6) 0.0011 (6) 0.0022 (6) C9 0.0250 (7) 0.0309 (8) 0.0305 (8) 0.0066 (6) 0.0003 (6) 0.0012 (6) C10 0.0293 (7) 0.0282 (7) 0.0309 (8) 0.0060 (6) −0.0010 (6) 0.0020 (6) C11 0.0363 (8) 0.0321 (8) 0.0306 (8) 0.0059 (7) −0.0044 (7) 0.0015 (6) C12 0.0616 (11) 0.0419 (10) 0.0307 (9) 0.0070 (9) −0.0012 (8) 0.0036 (7) C13 0.0991 (19) 0.0672 (14) 0.0341 (10) −0.0026 (13) −0.0178 (11) 0.0004 (10) C14 0.196 (4) 0.128 (3) 0.0330 (13) −0.031 (3) −0.0145 (17) −0.0003 (15)
Geometric parameters (Å, º)
N1—C1 1.467 (2) C8—C9 1.5148 (19)
N1—H1A 0.99 (2) C9—C10 1.531 (2)
N1—H1B 0.98 (2) C9—H9A 0.9900
N1—H1C 1.00 (2) C9—H9B 0.9900
C1—C2 1.510 (2) C10—C11 1.524 (2)
C1—H1D 0.9900 C10—H10A 0.9900
C1—H1E 0.9900 C10—H10B 0.9900
supporting information
sup-7 Acta Cryst. (2013). E69, o755–o756
C2—C3 1.391 (2) C11—H11A 0.9900
C3—C4 1.384 (2) C11—H11B 0.9900
C3—H3 0.9500 C12—C13 1.521 (3)
C4—C5 1.378 (3) C12—H12A 0.9900
C4—H4 0.9500 C12—H12B 0.9900
C5—C6 1.376 (2) C13—C14 1.507 (3)
C5—H5 0.9500 C13—H13A 0.9900
C6—C7 1.389 (2) C13—H13B 0.9900
C6—H6 0.9500 C14—H14A 0.9800
C7—H7 0.9500 C14—H14B 0.9800
O1—C8 1.2486 (17) C14—H14C 0.9800
O2—C8 1.2653 (17)
C1—N1—H1A 113.5 (11) C10—C9—H9A 109.1
C1—N1—H1B 109.7 (11) C8—C9—H9B 109.1
H1A—N1—H1B 107.3 (15) C10—C9—H9B 109.1
C1—N1—H1C 107.3 (11) H9A—C9—H9B 107.9
H1A—N1—H1C 107.5 (16) C11—C10—C9 112.75 (12)
H1B—N1—H1C 111.6 (16) C11—C10—H10A 109.0
N1—C1—C2 114.05 (13) C9—C10—H10A 109.0
N1—C1—H1D 108.7 C11—C10—H10B 109.0
C2—C1—H1D 108.7 C9—C10—H10B 109.0
N1—C1—H1E 108.7 H10A—C10—H10B 107.8
C2—C1—H1E 108.7 C12—C11—C10 113.17 (14)
H1D—C1—H1E 107.6 C12—C11—H11A 108.9
C7—C2—C3 118.30 (14) C10—C11—H11A 108.9
C7—C2—C1 123.43 (13) C12—C11—H11B 108.9
C3—C2—C1 118.25 (14) C10—C11—H11B 108.9
C4—C3—C2 120.71 (16) H11A—C11—H11B 107.8
C4—C3—H3 119.6 C11—C12—C13 113.06 (16)
C2—C3—H3 119.6 C11—C12—H12A 109.0
C5—C4—C3 120.39 (16) C13—C12—H12A 109.0
C5—C4—H4 119.8 C11—C12—H12B 109.0
C3—C4—H4 119.8 C13—C12—H12B 109.0
C6—C5—C4 119.57 (15) H12A—C12—H12B 107.8
C6—C5—H5 120.2 C14—C13—C12 113.9 (2)
C4—C5—H5 120.2 C14—C13—H13A 108.8
C5—C6—C7 120.24 (16) C12—C13—H13A 108.8
C5—C6—H6 119.9 C14—C13—H13B 108.8
C7—C6—H6 119.9 C12—C13—H13B 108.8
C2—C7—C6 120.78 (15) H13A—C13—H13B 107.7
C2—C7—H7 119.6 C13—C14—H14A 109.5
C6—C7—H7 119.6 C13—C14—H14B 109.5
O1—C8—O2 122.39 (13) H14A—C14—H14B 109.5
O1—C8—C9 117.80 (12) C13—C14—H14C 109.5
O2—C8—C9 119.80 (12) H14A—C14—H14C 109.5
C8—C9—C10 112.28 (12) H14B—C14—H14C 109.5
D—H···A D—H H···A D···A D—H···A
N1—H1A···O2 0.99 (2) 1.80 (2) 2.7802 (17) 168.7 (19)
N1—H1B···O1i 0.98 (2) 1.73 (2) 2.6993 (17) 169 (2)
N1—H1C···O2ii 1.00 (2) 1.87 (2) 2.8590 (18) 167 (2)
C1—H1E···O1iii 0.99 2.40 3.280 (2) 148
C7—H7···O2 0.95 2.52 3.3528 (19) 146