JOURNAL OF FOREST SCIENCE, 55, 2009 (7): 312–322
In the Journal of Forest Science, No. 7, 2008, a study Production potential of Douglas fir in mes-otrophic sites of TFE Křtiny was published. The whole research project Douglas fir – the introduced species in multifunctional and sustainable forest manage-ment was briefly presented there. Simultaneously with the project treatment in mesotrophic sites of TFE Křtiny, the second series of research plots was established in the Hůrky Training Forest District of the Secondary Forestry School in Písek. However, there are nearly exclusively poor and acid sites of the 2nd and 3rd forest vegetation zones included in
management sets of stands (MSS) 23 and 43. Thus,
growing Douglas fir in Písek has more than a centen-nial tradition similarly like in Křtiny. At present, this species is recorded on more than 12% (!!) of the stand land (79 ha of reduced area) of the Písek TFE.
Data on the production potential of Douglas fir in its homeland, i.e. in the USA, in countries of Central Europe and in this country were discussed in the above-mentioned study published in the Journal of Forest Science.
In addition to basic generally operative data, extraordinarily high production of the species was analyzed and certified in mesotrophic sites (Hof-man 1964; Burgbacher, Greve 1996; Huss 1996; Kantor et al. 2001). At the same time, however, the target proportion of the species is recommended
Supported by the Ministry of Education, Youth and Sports of the Czech Republic, Research Plan No. MSM 6215648902, and Ministry of Agriculture of the Czech Republic, Project No. QG 60063.
Production potential of Douglas fir in acid sites
of Hůrky Training Forest District, Secondary
Forestry School in Písek
P. Kantor, R. Mareš
Faculty of Forestry and Wood Technology, Mendel University of Agriculture and Forestry in Brno,
Brno, Czech Republic
AbSTRAcT: The study is a follow-up of the production potential of Douglas fir in mesotrophic sites of the Křtiny Training Forest Enterprise (TFE) (Journal of Forest Science, No. 7, 2008). Production parameters (height, dbh, volume) of Douglas fir are also evaluated, but in acid sites of the Hůrky Training Forest District, Secondary Forestry School in Písek in mature stands. In total, 17 mixed stands with the proportion of Douglas fir aged 88 to 121 years were assessed. Comparing 10 Douglas fir trees with 10 Norway spruce, Scots pine or European larch trees of the largest volume, higher and generally markedly higher production potential of the introduced Douglas fir was always found in all assessed stands. Groups where the volume of Douglas fir trees was two to three times higher than the volume of spruce, pine or larch were not an exception. For example, in stand 22B10, the mean volume of the 10 largest Douglas fir trees was 6.30 m3 but the volume of spruce trees was only 1.93 m3 and the volume of larch trees 2.25 m3. Differences between the mensurational parameters of Douglas fir and spruce (or larch) assessed by the ANOVA test were statistically highly significant. At present (based on annual ring analyses), the volume increment of particular Douglas fir trees ranges at level of 0.06 to 0.10 m3/year (i.e. about 0.6 m3 to 1.0 m3 per 10 years) in mature stands.
even in acid sites, particularly in management sets of stands (MSS) 23 and 43 (Dolejský 2000; Šindelář 2003). Šika and Vinš (1980) assessed the produc-tion potential of Douglas fir on the basis of extensive investigations in the series of forest regions of the Czech Republic. According to their findings, the mean stand height of 60-year Douglas fir trees ranges at the level of about 37 m in mesotrophic sites, about 34 m in acid sites and only about 27 m in drying-up sites. Hrnčíř (1998) also drew similar conclusions showing in his thesis evidence of the lowest growth potential of the species in dry localities under con-ditions of the CR. On the other hand, in the region of Tábor, Šedivý (1990) reported the high grow-ing stock of 60-year Douglas fir trees even in acid sites (the group of forest types 5K – growing stock: Douglas fir 1,020 m3/ha; spruce 632 m3/ha). Kadlec
(1989) evaluated growth conditions of Douglas fir in the surroundings of Horažďovice in sites of management sets of stands 23, 43, 53, 45, 55 and 57 and compared its production with autochthonous species. In all MSS, Douglas fir showed the fastest growth and only in MSS 23, pine predominated Douglas fir. Douglas fir achieved the best results as compared with spruce and pine in MSS 43, where it showed double volume (1.28 m3) compared to spruce
(0.60 m3) and pine (0.65 m3).
In the last 5 years, considerable attention has been paid to problems of production possibilities of Douglas fir also in forestry-advanced countries of Europe. This introduced species is evaluated from
various aspects, e.g. in papers of Lokow (2004), Rau (2005, 2006), Dong and Eder (2005), König (2006), Dietrich et al. (2006), etc.
Douglas fir in Hůrky Training Forest District
The Hůrky Training Forest District (TFD) serves as a special-purpose establishment of the Higher Sec- ondary Forestry School and of Bedřich Schwarzen-berg Secondary Forestry School in Písek. This TFD consists of an integrated complex of forests about 5 km south of Písek with a total area of 658 ha forest land (647 ha stand land). It is situated in cadastral areas of Smrkovice, Heřmaň, Selibov and Putim.
In the Hůrky TFD, only two forest vegetation zones are distinguished. On sunny drying up slopes, the beach/oak vegetation zone is situated (60 ha – 9%). However, the oak/beech forest vegetation zone to-tally dominates in the TFD (about 600 ha – 91%). In natural communities, beech and sessile oak with the admixture of linden predominated in the whole estate. In the proportion of trophic series, poor and acid sites wholly predominate (80% stand area). Gleyed and waterlogged sites account for 12% and mesotrophic sites for the remaining 8% area of the TFD.
Management conditions of the estate significantly changed at the end of the 18th and at the beginning
of the 19th
[image:2.595.64.533.511.713.2]century when the autochthonous broad-leaved stands of oak and beech were virtually totally converted to coniferous stands dominated by pine
Table 1. Development of the species composition in the Hůrky Training Forest District since 1830
Year Spruce Silver fir Pine Larch conifers*Other Oak Beech broadleavesOther
1830 13.1 13.0 69.1 0.0 0.0 2.0 0.1 2.7
1877 16.0 9.3 63.2 2.2 0.0 4.9 0.0 4.4
1890 18.4 6.5 60.5 3.1 0.0 5.9 0.0 5.6
1910 24.2 6.7 66.6 0.0 0.0 1.7 0.6 0.2
1930 40.2 5.8 44.8 2.6 0.0 5.3 0.8 0.5
1940 46.2 5.6 35.2 2.7 3.1 5.3 0.7 1.2
1950 39.7 6.1 23.2 3.2 4.6 16.5 2.4 4.3
1970 37.1 4.8 34.2 2.4 6.7 10.1 2.3 2.4
1990 35.7 1.7 34.8 4.3 9.2 9.2 3.2 1.9
2000 42.8 2.3 20.1 4.0 14.5 9.5 4.9 1.9
monocultures. The species composition develop-ment in the Hůrky TFD from 1830 to the present
[image:3.595.65.531.86.338.2]time is given in Table 1. Thus, even at present, coni-fers predominate in the species composition, namely spruce nearly 43% and pine 20%. The third most widespread species is Douglas fir, the proportion of Table 2. The survey of growing stock and area of Douglas fir according to age classes in forest stands in the Hůrky Training Forest District
Age class Number of stands Growing stock (m3) Area of the species (ha) Douglas fir growing stock (m3/ha)
1 (1–10) 58 0 8.38 0.00
2 (11–20) 37 233 5.83 39.98
3 (21–30) 44 1,640 8.32 197.16
4 (31–40) 56 3,231 12.23 264.14
5 (41–50) 32 1,966 5.33 369.01
6 (51–60) 35 3,171 7.37 430.03
7 (61–70) 49 10,569 24.02 439.99
8 (71–80) 17 2,279 4.83 471.47
9 (81–90) 11 414 0.99 417.97
10 (91–100) 12 261 0.56 467.49
11 (101–110) 8 444 0.75 593.27
12 (111–120) 2 121 0.15 822.57
Total 361 24,329 78.76 308.90
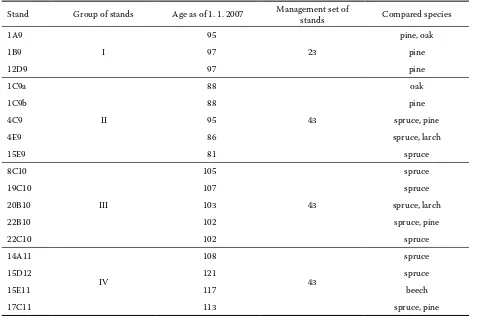
Table 3. Characteristics of experimental stands
Stand Group of stands Age as of 1. 1. 2007 Management set of stands Compared species
1A9
I
95
23
pine, oak
1B9 97 pine
12D9 97 pine
1C9a
II
88
43
oak
1C9b 88 pine
4C9 95 spruce, pine
4E9 86 spruce, larch
15E9 81 spruce
8C10
III
105
43
spruce
19C10 107 spruce
20B10 103 spruce, larch
22B10 102 spruce, pine
22C10 102 spruce
14A11
IV
108
43
spruce
15D12 121 spruce
15E11 117 beech
[image:3.595.62.540.442.758.2]which on 78.76 ha stand lands (12.2%) does not evi-dently show analogy in the Czech Republic on estates of similar size. The increase in its area (see Table 1) is given by its present natural and artificial regenera-tion as well as by the improvement of mensurational data at processing the last forest management plan (FMP) (as of 1 January 2000).
According to this FMP, in total 361 stand parts with the proportion of Douglas fir 1% and more are recorded in the Hůrky TFD. The total area of these stand parts amounts to 413.11 ha (63.9% stand land of the TFD). At the same time, the above-mentioned 78.76 ha (12.2% stand land) fall on Douglas fir.
Basic data on the proportion and growing stock of Douglas fir in particular age classes are given in Table 2. Thus, it is evident that Douglas fir occurs in the whole age spectrum. Similarly like in the Křtiny TFE, the occurrence of 58 stand parts of the 1st age
class with Douglas fir (area 8.38 ha) in Hůrky TFD demonstrates the significant present position of this species in regeneration targets.
The majority of stands with Douglas fir were es-tablished there during the decade 1931–1940 (the present 7th
age class). To a smaller extent, the spe-cies was, however, regularly grown there even before
World War I; the oldest so far standing stand 15D12 was established in 1886.
In the Hůrky TFD, Douglas fir occurs in for-est stands in all age classes predominantly in the position of individual trees or group admixtures. In 163 groups, it is recorded in a range from 1 to 10%. In 138 groups, the proportion of Douglas fir ranges between 11 and 50% and only in 40 groups, between 51 and 90%. As a monoculture, it occurs in 17 stands.
Methodology and characteristics of research stands
Methodology of determination of the production potential of Douglas fir in Hůrky TFD is identical with methodology represented in the Journal of Forest Science (No. 7, 2008), where production po-tentials of the species were assessed in mesotrophic sites of the Křtiny Training Forest Enterprise.
[image:4.595.61.535.437.670.2]The list and registration of all stands from the forest management plan (as of 1. 1. 2000) for Hůrky TFD with the proportion of Douglas fir 1% and more served as a basic database to assess the produc-tion potential of Douglas fir. The list was compiled according to age classes and management sets of
Table 4. Mensurational parameters of the ten largest trees in stand 1A9 (age 95 years, management set of stands HS 23)
Douglas fir Pine Oak
Tree
No. height (m) (cm)dbh volume (m3) tree No. height (m) (cm)dbh volume (m3) tree No. height (m) (cm)dbh volume (m3)
1 35.0 65.3 5.23 1 32.0 55.1 3.32 1 25.5 59.6 3.90
2 37.0 63.1 5.23 2 29.0 48.4 2.30 2 22.0 52.2 2.53
3 35.0 59.9 4.54 3 25.5 47.8 2.04 3 24.5 47.8 2.36
4 36.5 57.6 4.44 4 27.0 40.1 1.49 4 26.5 43.9 2.12
5 36.0 57.6 4.38 5 24.0 42.0 1.47 5 26.0 43.0 1.99
6 36.5 55.7 4.18 6 25.0 39.8 1.38 6 24.0 42.4 1.75
7 37.5 53.5 4.04 7 23.5 41.4 1.37 7 23.0 41.1 1.60
8 35.0 54.5 3.76 8 25.0 39.5 1.32 8 25.5 39.2 1.59
9 34.5 53.8 3.71 9 28.0 36.9 1.32 9 25.0 39.2 1.56
10 35.0 52.5 3.64 10 24.0 39.2 1.27 10 24.0 38.9 1.50
Mean 35.8 57.4 4.32 mean 26.3 43.0 1.73 mean 24.6 44.7 2.09
Statistical parameters of the largest trees
Mean Median Lower quartile Upper quartile Standard deviation
Dgl (volume m3) 4.32 4.28 3.76 4.54 0.57
Pine (volume m3) 1.73 1.43 1.32 2.04 0.66
stands. As mentioned above, there are 361 stands in the given estate and the reduced area of Douglas fir amounts to 78.76 ha.
In the present study, the oldest mature stands in the 9th to the 12th age class are evaluated. In total,
17 stands were assessed, which corresponded to methodical requirements for research surveys. Their list is given in Table 3.
The stands were classified according to age and management sets of stands into 4 groups: in the 9th age class, three stands were evaluated in MSS 23
and five stands in MSS 43. In the 10th age class, five
stands were assessed in MSS 43 and in the 11th age
class, four stands again in MSS 43. Demonstrably, stand 15D12 appears to be there the oldest evaluated stand with the registered proportion of Douglas fir. The stand was established in 1886 (as of 1. 1. 2008 – age 122 years).
In each of the stands, 10 Douglas fir trees with the highest dbh were marked and recorded. At the same time, height was measured in each of the trees. Finally, the volume of trees was calculated according to actual volume tables (tables of the Forest Manage-ment Institute for the stem volume over bark of silver fir). The same method was used, i.e. marking in the
stand, recording and measuring volumes of trees with the highest dbh, to determine the production potential of other species of assessed stands: spruce, pine, larch and sessile oak. Only trees within stand parts were included in the evaluation. On the con- trary, edge trees, trees along roads, cleared bound-ary lines, corridors, etc. were excluded from the evaluation. In the following text, results of studies from 4 stands are compiled in simple tables. Thus, one characteristic stand is represented from each of the groups.
The significance of differences in the produc-tion potential (volume in m3) among the particular
species was statistically evaluated by the ANOVA single-factor test.
[image:5.595.61.533.437.678.2]Within the study of the Douglas fir production potential, the diameter increment of three sample trees was retrospectively analyzed in stand 18D8 by means of computer-based image analysis using OSM and PAST programs. Respective increment cores were scanned immediately after sampling (excluding the effect of shrinkage) and subsequently processed only in a digital form. The volume increment was then calculated from the diameter increment and heights derived from the yield tables.
Table 5. Mensurational parameters of the ten largest trees in stand 4C9 (age 95 years, MSS 43)
Douglas fir Spruce Pine
Tree
No. height (m) (cm)dbh volume (m3) tree No. height (m) (cm)dbh volume (m3) tree No. height (m) (cm)dbh volume (m3)
1 38.0 65.0 5.68 1 34.5 38.2 1.81 1 33.5 42.0 2.02
2 38.0 55.4 4.11 2 34.0 36.9 1.70 2 33.5 39.2 1.75
3 37.0 54.1 3.98 3 33.5 36.3 1.59 3 33.0 39.5 1.73
4 35.5 53.2 3.69 4 32.0 34.7 1.45 4 32.5 39.2 1.70
5 33.5 50.0 3.12 5 33.0 33.8 1.41 5 33.0 38.2 1.64
6 34.0 48.7 3.06 6 34.0 33.4 1.38 6 32.0 36.6 1.51
7 33.0 47.8 2.85 7 32.0 33.8 1.37 7 31.5 36.0 1.40
8 34.0 47.1 2.84 8 32.0 33.8 1.37 8 31.0 35.0 1.30
9 32.5 45.2 2.50 9 31.5 33.4 1.28 9 32.5 34.1 1.29
10 33.0 43.9 2.44 10 31.5 31.5 1.21 10 32.0 34.4 1.27
Mean 34.9 51.1 3.43 mean 32.8 34.6 1.46 mean 32.45 37.4 1.56
Statistical parameters of the largest trees
Mean Median Lower quartile Upper quartile Standard deviation
Dgl (volume m3) 3.43 3.09 2.84 3.98 0.98
Spruce (volume m3) 1.46 1.40 1.37 1.59 0.19
Table 6. Mensurational parameters of the ten largest trees in stand 22B10 (age 102 years, MSS 43)
Douglas fir Spruce Larch
Tree
No. height (m) (cm)dbh volume (m3) tree No. height (m) (cm)dbh volume (m3) tree No. height (m) (cm)dbh volume (m3)
1 40.0 80.9 8.69 1 31.0 49.0 2.51 1 33.0 59.2 3.37
2 43.0 75.8 8.43 2 34.0 40.8 2.03 2 34.0 50.0 2.76
3 41.0 73.6 7.68 3 32.0 42.4 1.99 3 35.5 42.7 2.37
4 41.5 72.6 7.58 4 32.5 41.1 1.94 4 34.0 42.7 2.21
5 40.5 69.1 6.71 5 33.5 40.1 1.92 5 35.0 41.4 2.16
6 39.0 60.8 5.32 6 34.0 38.9 1.86 6 33.5 42.0 2.09
7 40.0 59.2 5.01 7 33.0 39.2 1.81 7 34.0 41.4 2.06
8 38.5 58.0 4.68 8 32.5 38.5 1.78 8 32.0 41.1 1.89
9 37.5 58.0 4.56 9 32.0 38.5 1.76 9 34.0 37.6 1.84
10 39.0 54.8 4.33 10 31.5 38.9 1.73 10 30.0 41.7 1.77
Mean 40.0 66.3 6.30 mean 32.6 40.7 1.93 mean 33.5 44.0 2.25
Statistical parameters of the largest trees
Mean Median Lower quartile Upper quartile Standard deviation
Dgl (volume m3) 6.30 6.02 4.68 7.68 1.70
Spruce (volume m3) 1.93 1.89 1.78 1.99 0.23
Larch (volume m3) 2.25 2.13 1.89 2.37 0.49
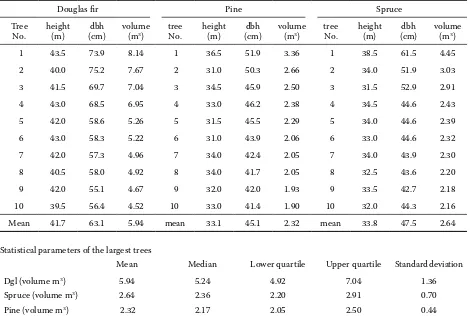
Table 7. Mensurational parameters of the ten largest trees in stand 17C11 (age 113 years, MSS 43)
Douglas fir Pine Spruce
Tree
No. height (m) (cm)dbh volume (m3) tree No. height (m) (cm)dbh volume (m3) tree No. height (m) (cm)dbh volume (m3)
1 43.5 73.9 8.14 1 36.5 51.9 3.36 1 38.5 61.5 4.45
2 40.0 75.2 7.67 2 31.0 50.3 2.66 2 34.0 51.9 3.03
3 41.5 69.7 7.04 3 34.5 45.9 2.50 3 31.5 52.9 2.91
4 43.0 68.5 6.95 4 33.0 46.2 2.38 4 34.5 44.6 2.43
5 42.0 58.6 5.26 5 31.5 45.5 2.29 5 34.0 44.6 2.39
6 43.0 58.3 5.22 6 31.0 43.9 2.06 6 33.0 44.6 2.32
7 42.0 57.3 4.96 7 34.0 42.4 2.05 7 34.0 43.9 2.30
8 40.5 58.0 4.92 8 34.0 41.7 2.05 8 32.5 43.6 2.20
9 42.0 55.1 4.67 9 32.0 42.0 1.93 9 33.5 42.7 2.18
10 39.5 56.4 4.52 10 33.0 41.4 1.90 10 32.0 44.3 2.16
Mean 41.7 63.1 5.94 mean 33.1 45.1 2.32 mean 33.8 47.5 2.64
Statistical parameters of the largest trees
Mean Median Lower quartile Upper quartile Standard deviation
Dgl (volume m3) 5.94 5.24 4.92 7.04 1.36
Spruce (volume m3) 2.64 2.36 2.20 2.91 0.70
[image:6.595.64.534.437.753.2]ReSulTS AnD DiScuSSiOn
Results of studies are processed similarly like in the Křtiny Training Forest Enterprise. Basic men-surational data of the largest Douglas fir trees and largest autochthonous trees (spruce, pine, larch, sessile oak) in assessed stands are given in Tables 4 to 7. Very interesting findings were already noted in the first represented stand 1A9 (age 95 years – see Table 4). The stand is situated on a drying up SW slope. Nevertheless, the height of the largest Douglas fir trees ranged between 34.5 and 37.5 m, which is on average by nearly 10 m (!!) more than in pine.
Similarly, markedly higher dbh together with the height of Douglas fir trees manifested itself in their volume. This volume ranged from 3.64 m3 to 5.23 m3.
Particularly from the aspect of site conditions (acid, drying up sites, shallow soils very poor in minerals, total annual precipitation 500 to 600 mm) as well as stand age, it documents a remarkable potential of the species, which is on average double in comparison with pine.
Data on production parameters of oak were in-cluded in Table 4 particularly because the mixture
of Douglas fir with sessile oak, which is uncommon elsewhere, is rather common on southern, west-ern and south-western aspects of the Hůrky TFD. Nevertheless, the comparison of oak ad Douglas fir is not commented more closely here because of quite different biological and growth characteristics of both species. Somewhat lower absolute produc-tion parameters were noted in a stand marked 4C9 in MSS 43 (see Table 5). Nevertheless, even here, the volume of the largest Douglas fir trees (on average 3.43 m3) is more than twofold than in spruce (on
average 1.46 m3) or pine (1.56 m3). Extremely high
production potentials of Douglas fir are shown by 102-year stand 22B10 again in MSS 43 (see Table6). The largest Douglas fir trees show there on average a volume of 6.30 m3 at a mean height of 40 m. It is
3.3 times more than the volume of spruce trees and 2.8 times more than the volume of the largest larch trees.
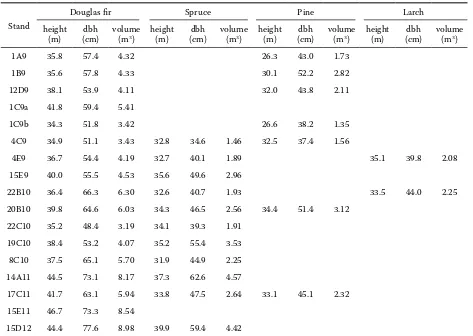
[image:7.595.63.536.419.755.2]Representative data from the oldest group of stands are given in Table 7. Similarly like in all as-sessed stands all evaluated parameters (height, dbh, volume) in Douglas fir are higher than in compared conifers, namely in spruce and pine.
Table 8. Mean parameters of the ten largest conifers in assessed stands of the 9th to the 12th age class in the Hůrky Training Forest District
Stand
Douglas fir Spruce Pine Larch
height
(m) (cm)dbh volume (m3) height (m) (cm)dbh volume (m3) height (m) (cm)dbh volume (m3) height (m) (cm)dbh volume (m3)
1A9 35.8 57.4 4.32 26.3 43.0 1.73
1B9 35.6 57.8 4.33 30.1 52.2 2.82
12D9 38.1 53.9 4.11 32.0 43.8 2.11
1C9a 41.8 59.4 5.41
1C9b 34.3 51.8 3.42 26.6 38.2 1.35
4C9 34.9 51.1 3.43 32.8 34.6 1.46 32.5 37.4 1.56
4E9 36.7 54.4 4.19 32.7 40.1 1.89 35.1 39.8 2.08
15E9 40.0 55.5 4.53 35.6 49.6 2.96
22B10 36.4 66.3 6.30 32.6 40.7 1.93 33.5 44.0 2.25
20B10 39.8 64.6 6.03 34.3 46.5 2.56 34.4 51.4 3.12 22C10 35.2 48.4 3.19 34.1 39.3 1.91
19C10 38.4 53.2 4.07 35.2 55.4 3.53 8C10 37.5 65.1 5.70 31.9 44.9 2.25 14A11 44.5 73.1 8.17 37.3 62.6 4.57
17C11 41.7 63.1 5.94 33.8 47.5 2.64 33.1 45.1 2.32 15E11 46.7 73.3 8.54
This unambiguous finding results also from Tables 8 and 9, where partly mean values are compiled from all 17 stands under evaluation and partly values of the 10 absolutely largest trees in the given age inter-val in the Hůrky TFD.
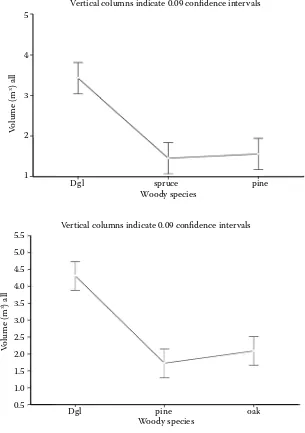
Determined differences in mensurational param-eters of Douglas fir on the one hand and spruce, pine or oak on the other hand compared by a single-factor test ANOVA were (without exception) naturally sta-tistically highly significant. By contrast, the same test did not confirm any significant differences among production potentials of spruce, pine and oak (Figs. 1 and 2).
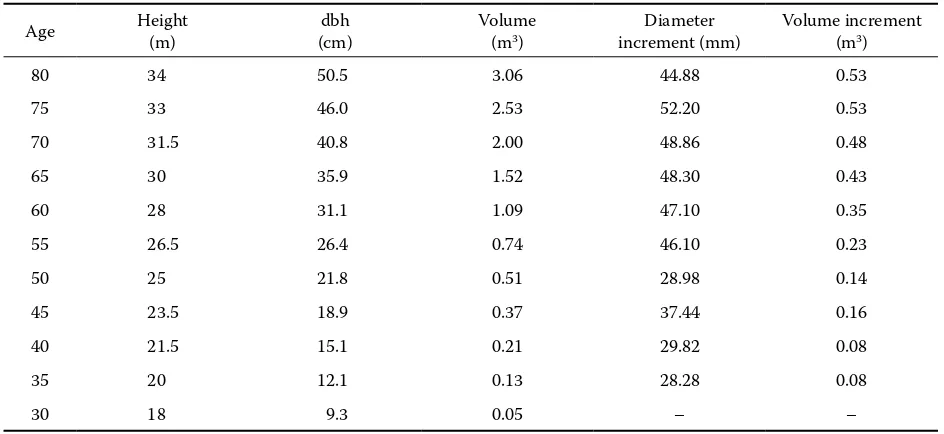
The high production potential of Douglas fir even in acid sites of lower vegetation zones was proved by the retrospective analysis of diameter increment in three sample trees in stand 18D8 (see Fig. 3). At the age of 80 years, the evaluated sample trees showed the following parameters:
sample tree 1 height 34 m dbh 50.5 cm volume 3.06 m3,
sample tree 2 height 34 m dbh 54.5 cm volume 3.42 m3,
sample tree 3 height 37 m dbh 61.0 cm volume 4.42 m3.
The course of increments shows an initially usual downward trend – from about 10 mm/year at the age of 20 years to about 6 mm/year at the age of 45 years. Evidently due to tending measures, the diameter in-crement does not decrease even in the next period oscillating from 4 to 14 mm/year about the mean value of 7–8 mm/year in all three sample trees.
After conversion, the current volume increment of the largest Douglas fir trees in acid sites of the Hůrky Training Forest District amounts to about 0.06 to 0.10 m3/year at the age of 50 to 80 years. In other
words, these Douglas fir trees increase, even at present, their volume by 0.6–1.0 m3 (see Table10)
Vertical columns indicate 0.09 confidence intervals 5
4
3
2
1
Volume
(m
3) all
Dgl spruce pine
Woody species
Vertical columns indicate 0.09 confidence intervals
Volume
(m
3) all 5.5 5.0 4.5 4.0 3.5 3.0 2.5 2.0 1.5 1.0
0.5 Dgl pine oak
[image:8.595.63.368.57.490.2]Woody species
[image:8.595.68.371.60.258.2]Fig. 1. The significance of differences in the production potential of Douglas fir, Norway spruce and Scots pine (single-factor ANOVA test) in the management set of stands (MSS) 43 (y-axis – mean stem volume of sample trees)
every 10 years. Wolf (1998) and Bušina (2006) also reported extraordinary production possibilities of Douglas fir in acid sites of the Hůrky Training Forest District. A young unmixed Douglas fir stand showed the total volume production of 619 m3/ha (!!)
at the age of 31 years. In the period of 1993 to 1997, the stand increased its standing volume even by 23 m3/ha (Wolf 1998). According to all parameters,
it concerns a stand which markedly exceeds the 1st site class of valid growth tables at the given age.
Also in other evaluated stands in poor acid sites, pe-riodic current increment amounted to 21 m3/ha/year
in the last 8 years (Wolf 1998).
In his Ph.D. thesis Bušina (2006) also evaluated the basic mensurational parameters of 219 Douglas fir trees aged 65 to 121 years growing at the same estate. The volume of the youngest and largest Douglas fir trees exceeded 5.00 m3. The oldest and
largest Douglas fir trees showed the volume between 10.44 and 14.3 m3 and the periodic volume increment
amounted even to 0.28 m3/year in the last 30 years.
SuMMARy AnD cOncluSiOn
In connection with the importance of introduced species, the Hůrky Training Forest District of the Secondary Forestry School in Písek shows quite a specific position. With the proportion of Douglas fir amounting to 12.2% of the area it can serve as an exemplary area for growing the species. Moreover, there is a number of data on tending programmes of Douglas fir (Wolf 1998) and its production po-tential (Bušina 2006). Douglas fir is traditionally grown there in mixed, as a rule individually mixed stands. In addition to simple mixtures of Douglas fir with spruce, mixed stands with a rich spectrum of
0 2 4 6 8 10 12 14 16 18 20
1946 1951 1956 1961 1966 1971 1976 1981 1986 1991 1996 2001 2006
(m
m
)
DG n. 1 DG n. 2 DG n. 3 Fig. 3. Annual ring analysis of the
[image:9.595.67.402.56.218.2]development of 3 sample trees of Douglas fir in stand 18D8 (y-axis – annual diameter increment)
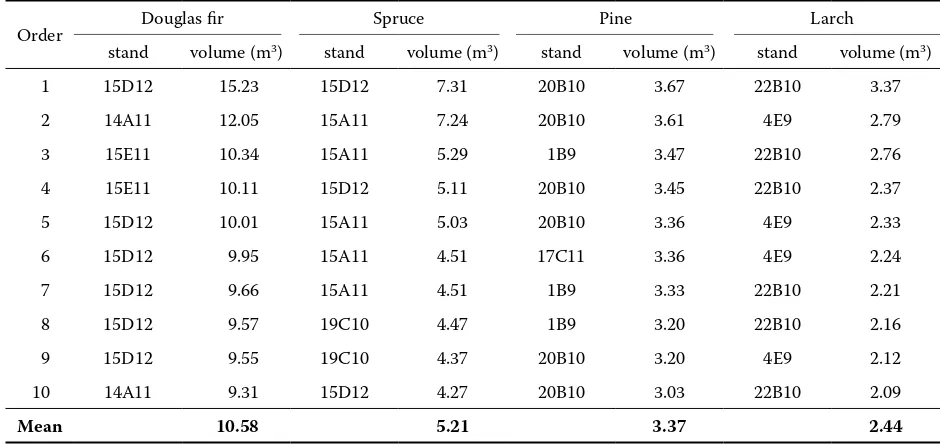
Table 9. The largest trees in Hůrky TFD in assessed stands of the 9th to the 12th age class (MSS 23, 43)
Order Douglas fir Spruce Pine Larch
stand volume (m3) stand volume (m3) stand volume (m3) stand volume (m3)
1 15D12 15.23 15D12 7.31 20B10 3.67 22B10 3.37
2 14A11 12.05 15A11 7.24 20B10 3.61 4E9 2.79
3 15E11 10.34 15A11 5.29 1B9 3.47 22B10 2.76
4 15E11 10.11 15D12 5.11 20B10 3.45 22B10 2.37
5 15D12 10.01 15A11 5.03 20B10 3.36 4E9 2.33
6 15D12 9.95 15A11 4.51 17C11 3.36 4E9 2.24
7 15D12 9.66 15A11 4.51 1B9 3.33 22B10 2.21
8 15D12 9.57 19C10 4.47 1B9 3.20 22B10 2.16
9 15D12 9.55 19C10 4.37 20B10 3.20 4E9 2.12
10 14A11 9.31 15D12 4.27 20B10 3.03 22B10 2.09
[image:9.595.61.534.534.756.2]5 to 8 species are not exceptions. Thus, the unusual mixture of Douglas fir with sessile oak creates a specific group.
Similarly like in mesotrophic sites of Křtiny TFE, the exceptionally high production potential of this introduced species as compared with autochthonous commercial conifers has been proved also here in the 9th to 12th age classes in acid sites. It is also
documented by Tables 8 and 9, where mean values are given from the 17 assessed stands as well as basic mensurational parameters of the largest trees from all evaluated stands.
The volume of the 10 largest Douglas fir trees amounted there on average to 10.58 m3, which was
a value comparable with mesotrophic sites in TFE Křtiny (12.47 m3). The largest Douglas fir tree in the
Hůrky TFD (15.23 m3) has even 1.5 m3 higher volume
than the largest Douglas fir tree in mesotrophic sites of TFE Křtiny (13.72 m3).
To assess the production potential of Douglas fir, the annual ring analysis of three sample trees from stand 18D8 (age 80 years) is also important. Even at this age, the diameter increment of the largest Douglas fir trees oscillates about a mean value of ± 7–8 mm/year, which represents a current volume increment of 0.06–0.10 m3/year.
In conclusion, it is possible to state that similarly like in nutrient-rich soils, also in acid sites of the 2nd and 3rd
forest vegetation zones, the exception-ally high production potential of Douglas fir has been proved. Thus, the production potential of this introduced species is also here twofold as compared with autochthonous conifers, i.e. spruce and pine.
References
BURGBACHER H., GREVE P., 1996. 100 Jahre Douglasien-anbau im Stadtwald Freiburg. AFZ, 51: 1109–1111. BUŠINA F., 2006. Přirozená obnova douglasky tisolisté (
Pseu-dotsuga menziesii /Mirb./ Franco) a její produkční potenciál
v porostech Školního polesí Hůrky VOŠL a SLŠ v Písku. [Dok-torská dizertační práce.] Brno, MZLU v Brně, LDF: 152. DIETRICH P., MUTH M., HOANG D.P., 2006. Entwicklung
natürlicher Sukzession in einem Douglasienbestand nach wiederkehrenden Schadereignissen. Forst und Holz, 61: 128–130.
DOLEJSKý V., 2000. Najde douglaska větší uplatnění v našich lesích? Lesnická práce, 79: 492–494.
DONG P.H., EDER W., 2005. Wachstum der Douglasie in Rheinland-Pfalz. Mitteilungen aus der Forschungsanstalt für Waldökologie und Forstwirtschaft Rheinland-Pfalz, Nr. 55: 9–36.
HOFMAN J., 1964. Pěstování douglasky. Praha, SZN: 253. HRNčíř J., 1998. Proměnlivost růstu douglasky tisolisté
(Pseudotsuga menziesii
/Mirb./ Franco) na vybraných loka-litách čR. [Diplomová práce.] Brno, MZLU: 48.
HUSS J., 1996. Die Douglasie als Mischbaumart. AFZ, 51: 1112.
KADLEC Z., 1989. Vyhodnocení růstových podmínek in-trodukovaných dřevin s hlavním zaměřením na douglasku tisolistou na LS Prácheň a LS Slavník v Horažďovicích. [Závěrečná práce postgraduálního studia.] Brno, VŠZ: 37. KANTOR P., 2008. Production potential of Douglas fir at
mesotrophic sites of Křtiny Training Forest Enterprise. Journal of Forest Science, 54: 321–332.
[image:10.595.62.534.72.289.2]KANTOR P., KNOTT R., MARTINíK A., 2001. Production capacity of Douglas fir (Pseudotsuga menziesii /Mirb./ Fran-co) in a mixed stand. Ekológia, Supplement 1, 20: 5–14.
Table 10. Retrospective analysis of the development of one Douglas fir sample tree in stand 18D8
Age Height (m) (cm)dbh Volume (m3) increment (mm)Diameter Volume increment (m3)
80 34 50.5 3.06 44.88 0.53
75 33 46.0 2.53 52.20 0.53
70 31.5 40.8 2.00 48.86 0.48
65 30 35.9 1.52 48.30 0.43
60 28 31.1 1.09 47.10 0.35
55 26.5 26.4 0.74 46.10 0.23
50 25 21.8 0.51 28.98 0.14
45 23.5 18.9 0.37 37.44 0.16
40 21.5 15.1 0.21 29.82 0.08
35 20 12.1 0.13 28.28 0.08
KöNIG T., 2006. Douglasie auf sandigen altpleistozänen Sedimenten Ostdeutschlands – Wunschdenken oder Al-ternative? Forst und Holz, 61: 123–127.
LOKOW K.W., 2004. Eberswalder Anbauversuche mit Doug-lasie. AFZ-Der Wald, 59: 851–854.
RAU H.M., 2005. Der Internationale Douglasien – Provenienz- versuch in Hesse. Forst und Holz, 60: 291–294.
RAU H.M., 2006. Prüfung von Douglasien – Beständen aus Hessen und anderen Bundesländern. Forst und Holz, 61: 131–136.
ŠEDIVý M., 1990. Pěstování douglasky tisolisté na LZ Tábor. [Diplomová práce.] Brno, VŠZ: 73.
ŠIKA A., VINŠ B., 1980. Růst douglasky v lesních porostech čSR. Práce VÚLHM, 57: 73–95.
ŠINDELář J., 2003. Aktuální problémy a možnosti pěstování douglasky tisolisté. Lesnická práce, 82: 238–240.
WOLF J., 1998. Výchova douglaskových porostů. Lesnická práce, 77: 134–136.
Received for publication December 15, 2008 Accepted after corrections February 18, 2009
Corresponding author:
Prof. Ing. Petr Kantor, CSc., Mendelova zemědělská a lesnická univerzita v Brně, Lesnická a dřevařská fakulta, Lesnická 37, 613 00 Brno, česká republika
tel.: + 420 545 134 123, fax: + 420 545 134 125, e-mail: kantor@mendelu.cz
Produkční potenciál douglasky tisolisté na kyselých stanovištích
Školního polesí Hůrky Střední lesnické školy Písek
AbSTRAKT:Studie navazuje na hodnocení produkčního potenciálu douglasky tisolisté na živných stanovištích ŠLP Křtiny (Journal of Forest Science, č. 7, 2008). Rovněž zde jsou hodnoceny produkční parametry (výška, d1,3, objem) douglasky tisolisté, ale na kyselých stanovištích Školního polesí Hůrky Střední lesnické školy Písek v porostech mýtného věku. Celkem bylo posuzováno 17 smíšených porostů s evidovaným zastoupením douglasky ve věku 88 až 121 let. Srovnáním deseti nejobjemnějších douglasek s deseti nejhmotnatějšími smrky, borovicemi, resp. modříny byl bez výjimky ve všech hodnocených porostech zjištěn vyšší, zpravidla výrazně vyšší produkční potenciál intro-dukované douglasky. Výjimkou nebyly skupiny, kde byl objem douglasek dvakrát až třikrát větší než objem smrků nebo modřínů. V porostu 22B10 byl např. zaznamenán střední objem deseti nejobjemnějších douglasek 6,30 m3, ale objem smrků pouze 1,93 m3 a objem modřínů 2,25 m3. Zjištěné rozdíly dendrometrických parametrů douglasky na jedné a smrku, resp. modřínu na druhé straně, srovnávané testem ANOVA, byly statisticky vysoce průkazné. Z letokruhových analýz souběžně vyplynulo, že v současné době se pohybuje v dospělých porostech objemový přírůst jednotlivých douglasek na úrovni 0,06 až 0,10 m3/rok (tj. ca 0,6 m3 až 1,0 m3 každých 10 let).