Oxidation Resistance of TiAl Improved by Ion Implantation
of Beta-Former Elements
Shigeji Taniguchi
1, Michiko Yoshihara
2and Kazuhisa Fujita
3 1Department of Materials Science and Processing, Graduate School of Engineering, Osaka University, Suita 565-0871, Japan 2Department of Mechanical Engineering and Materials Science, Yokohama National University, Yokohama 240-8501, Japan 33rd Project Research Laboratory, Ion Engineering Research Institute Corporation, Hirakata 573-0128, Japan
TiAl coupon specimens were implanted with Fe, Mo, Ta or W ions and then cyclically oxidised with temperature varying between room temperature and 1200 K in a flow of purified oxygen under atmospheric pressure. The surface modification by the ion implantation was characterised by glancing angle X-ray diffractometry (GAXRD), Auger electron spectroscopy (AES) and transmission electron microscopy (TEM). The oxidised specimens were examined by AES, GAXRD, X-ray diffractometry, scanning electron microscopy and electron probe microanalysis. The oxidation resistance of TiAl is significantly improved by the implantation of Mo, Ta or W ions with a dose of1021ionsm 2 at acceleration voltages ranging from 50 to 340 kV. The acceleration voltage has a small influence. The oxide scales consist predominantly of -Al2O3and are very adherent to the substrates even after 20 cycles (400 h). On the other hand, the implantation of Fe has a little effect. The significant effect brought about by the implantation is attributable to the formation of a thin-Ti phase layer in the modified area. Therefore, a possible explanation for the improved oxidation resistance is the formation of-Ti phase, which is a solid solution where diffusion of Al seems much faster than in-TiAl which has an ordered structure. The enhanced Al diffusion results in the formation of a thin but continuous Al2O3 -rich layer in the scale during the initial oxidation stages. The en-richment of Al relative to Ti by the implantation was thought playing some role. The so-called doping effect of Mo, Ta and W is also contributing to the early formation of Al2O3-rich layers by retarding TiO2growth. (Received January 7, 2004; Accepted March 10, 2004)
Keywords: high-temperature oxidation, titanium aluminide, ion implantation, beta phase, transmission electron microscopy, alumina scale
1. Introduction
TiAl-based alloys have attractive properties, e.g. high
specific strength as light weight heat-resisting material. Although their application is limited at present to automobile
engine components,1,2) it is very probable that they will be
used in aerospace and other fields in near future.3,4)Usually,
engineering TiAl-based alloys contain several alloying elements for controlling their microstructure and thus improving their mechanical properties. However, the com-patibility between the mechanical property and oxidation resistance has not been well established by alloying addi-tions. Surface treatment is a possible way to obtain sufficient resistance against environmental attack including oxidation without spoiling required mechanical properties. The ion
implantation5,6) enables a considerable enrichment of
addi-tional element in a thin surface layer without changing bulk properties. Almost all the elements can be implanted, and the ion dose and the implantation depth of the element can be well controlled by adjusting the implantation conditions. In this respect, the ion implantation is an excellent research tool.
In a previous study7)it was found that the implantation of
Nb ions significantly improves the oxidation resistance of TiAl. This good result was attributed to the formation of a
thin -Ti phase layer in the implanted area, which was
confirmed by a TEM study.8)In order to confirm and extend
this view we continued TEM observations for the specimens implanted with Fe, Mo, Ta or W. This paper deals with the
results. Nb, Mo, Ta and W are known as strong -phase
former, while Fe is a weak one.
In general, the high-temperature oxidation of TiAl results
in a scale consisting of an outer TiO2 layer and an inner
porous layer which is a mixture of Al2O3 and TiO2.9,10)
Because of such a scale structure, its oxidation resistance is
not enough at high temperatures. The formation of a definite
and continuous Al2O3layer is prerequisite for obtaining the
sufficient oxidation resistance.
2. Experimental
2.1 Specimen
The chemical composition of the TiAl specimen used in this study is shown in Table 1. Its microstructure was shown
elsewhere.8)It consisted of grains and a small fraction of
=2 grains. The grain size ranged widely from a few to
100mm. Coupon specimens for implantation, measuring
about15101in mm, were machined out of a thin slice
of a hot-forged pancake prepared by Ar-arc skull melting. The specimen peripheries were abraded to make an angle of 45 degree so that the whole specimen surface was implanted with two steps: one for front surface and the other for back surface. The ion dose on the slant surface is a little smaller than that on the flat area. However, the oxidation resistance can be clearly evaluated. Before implantation, the whole specimen surface was polished to a mirror finish with a series
of SiC polishing paper and alumina powder of 0.3mmin size.
[image:1.595.303.552.396.423.2]The specimen was then washed in acetone and alcohol ultrasonically. The implantation was carried out using 200 or 400 keV implanter under conditions listed in Table 2, which contains the oxidation resistance obtained for convenience.
Table 1 Chemical composition of the TiAl specimen (mol%).
Al Ti Fe Si C O N H
2.2 Oxidation test
The oxidation resistance was assessed by a cyclic oxidation test in a flow of oxygen, purified by passing it
through towers of silica gel, phosphorous pentoxide and CO2
remover, under atmospheric pressure. A few specimens were placed on an alumina boat and put in a horizontal quartz reaction tube. One cycle consisted of heating to 1200 K in about 3.6 ks, holding at temperature for 72 ks (20 h), and cooling to room temperature in about 5 ks. After each cycle the specimens were weighed and visually inspected, and returned to the reaction tube for the next cycle. A short-period oxidation test was also performed to examine proper-ties of initial oxide scales.
2.3 Specimen characterisation
The implanted specimens and oxidised specimens were characterised by conventional methods including Auger electron spectroscopy (AES), glancing angle X-ray diffrac-tometry (GAXRD) with off-set angle of 2 degree, X-ray diffractometry (XRD), scanning electron microscopy (SEM), electron probe microanalysis (EPMA) and transmission electron microscopy (TEM) with energy dispersive spec-troscopy (EDS). The both X-ray tests were performed using
Cu K radiation. The TEM specimens were thinned using a
focused ion beam (FIB) unit. Before the FIB processing, a thin carbon layer and then a Pt-Pd layer were deposited on the specimen surface to protect it.
3. Results
3.1 As-implanted specimens
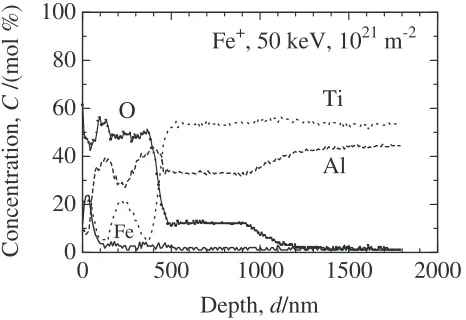
Figures 1(a) to (c) show AES depth profiles of the relevant elements of the specimens implanted with Fe, Mo and W, respectively, as examples. (a) shows the maximum Fe concentration of about 45 mol% at a depth of about 50 nm with the total implantation depth of about 100 nm. The Mo implanted at 340 keV penetrated to a depth of about 170 nm with the maximum concentration of 12 mol%. The W implanted at 100 keV penetrated to about 70 nm from the surface and has a maximum concentration of about 57 mol%
at a depth of about 30 nm.
In general, the implanted element shows a near Gaussian distribution, and the implantation depth increases and the maximum concentration decreases with an increase in the acceleration energy for the same dose. No peak was found for
a dose of1019m 2indicating that this dose gives a low peak
concentration which seems to be below the detection limit of AES. In all the cases, there is slight penetration of oxygen due to the remaining gas in the implanter, although the implantation was carried out under a high vacuum.
Figure 2 shows the GAXRD profile of the specimen
implanted with Mo (200 keV,1021m 2) as an example. The
main peaks correspond to -TiAl and there are low peaks
corresponding to-Ti and2phases. The peaks of-Ti were
[image:2.595.321.535.69.535.2]also detected for the other implanted specimens. This can be explained by the following; for instance, W is known to be a
Table 2 Ion implantation conditions and oxidation resistance. Implanted element Acceleration energy Ion dose Oxidation
keV ions m 2 resistance
Fe 50 1021
40 21021
Mo 50 10
21 }
200 1021 }
340 1021 }
Ta 180 1021 }
1019
W 100 10
20 }
1021 }
180 1021 }
no improvement, good,}excellent
0
50
100
150
0
20
40
60
80
100
Depth,
d
/nm
Concentration,
C
/(mol %)
Fe
+, 50 keV, 10
21m
-2Ti
Al
Fe
(a)
O
C
0
50
100
150
200
250
300
0
20
40
60
80
100
Ti
Al
Mo
O
Depth,
d
/nm
Mo
+, 340 keV, 10
21m
-2Concentration,
C
/(mol %)
(b)
0
50
100
150
20
40
60
80
100
Depth,
d
/nm
Ti
Al
W
O
W
+, 100 keV, 10
21m
-2Concentration,
C
/(mol %)
(c)
[image:2.595.45.291.85.253.2]strong-phase former, and the formation of this phase seems
to be resulted from a very limited solubility of W in
-TiAl.11)To confirm further the formation of-phase by the
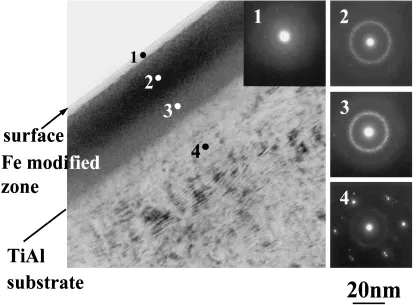
implantation, detailed TEM observations were performed. Figure 3 shows a TEM bright field image of a cross section and diffraction patterns of the specimen implanted with Fe
(50 keV,1021m 2). The number in the figure shows positions
where diffraction patterns were taken and EDS was per-formed. The EDS results are shown in Table 3, where the concentration is normalised for Al, Ti and Fe. The Fe-modified zone is about 60 nm thick, slightly thinner than that observed by AES. The outermost layer (1) of about 5 nm thickness is amorphous. It is noteworthy that this layer contains higher Al concentration than the TiAl substrate. The AES and EDS showed that it contains oxygen along with Al,
Ti and Fe, suggesting the layer to be an oxide. Position (2), about 20 nm from the surface, shows indistinct ring with a
lattice spacing of about 0.214 nm and was identified as TiFe2.
The Fe concentration of this point was about 42 mol% by EDS. This phase was not confirmed by GAXRD probably owing to its small amount. The position (3), about 45 nm deep from the surface, also shows a ring diffraction pattern, however the ring is more distinct and the lattice spacing, about 0.225 nm, is slightly larger than that of position (2).
This corresponds to (110) of -phase, suggesting that it
consists of very fine grains or almost amorphous. Position (4) is the TiAl substrate.
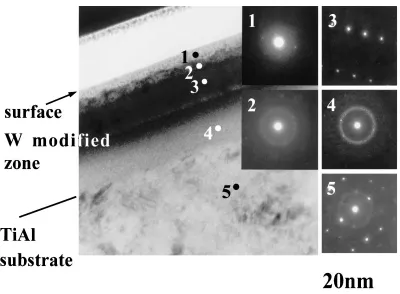
Figure 4 shows a TEM bright field image and diffraction patterns of the specimen implanted with W (100 keV,
1021m 2). The EDS results are shown in Table 4, where
the concentration is normalised for Al, Ti and W. The W-modified zone is about 70 nm thick, which is consistent with the AES result. The outermost thin layer (1) of about 5–10 nm thickness is an amorphous oxide, as same as the case for the
Fe implantation. The next layer (2) was identified as-phase
by the electron diffraction and EDS. It seems to be a mixture of a crystalline phase and an amorphous. The diffraction
20
40
60
80
γ
:
γ
-TiAl
α2
: Ti
3Al
β
:
β
-Ti
Intensity
→
(a.u.)
Mo
+, 200 keV, 10
21m
-2γ γ γ
γ γ
γ γ
γ
γ γ γ
α2
β
β
/ (
π
/180 rad)
2θFig. 2 GAXRD profile of the Mo-implanted specimen.
[image:3.595.57.283.71.218.2]Fig. 3 TEM bright field image and electron diffraction patterns of the Fe-implanted specimen (50 keV,1021m 2).
Table 3 EDS results of the Fe-implanted specimen (mol%).
Position Al Ti Fe Remarks
1 62.5 29.9 7.6 Amorphous
2 28.6 29.5 41.9 TiFe2
3 49.0 46.7 4.3 -phase
[image:3.595.304.550.84.148.2] [image:3.595.91.508.462.767.2]pattern for this layer is nearly the superposition of those for positions (3) and (4). It is again noteworthy that the Al content is significantly higher than the Ti content.
Position (3), about 20 nm from the surface, was identified
as a crystalline -phase. The W concentration was found to
be about 45 mol% by EDS and this position corresponds to W concentration peak in the AES profile. Position (4), about 55 nm from the surface, shows indistinct ring with the lattice
spacing of about 0.227 nm, which corresponds to (110) of
-phase. Position (5) is the TiAl substrate.
The implantation of Mo (340 keV,1021m 2) formed again
a thin layer of-Ti phase near the surface as shown in Fig. 5.
These results agree well with the results of AES and
GAXRD, and clearly show the-phase formation. In all the
cases, the modified zones show dimmed images. This is attributable to the lattice defects and strain induced by the implantation.
3.2 Oxidation behaviour
Figure 6 shows the cyclic oxidation curves of the Fe-implanted and non-Fe-implanted specimens. Duplicate runs
were performed for showing repeatability of the results. The non-implanted specimen shows fast mass gains for 11 cycles, after which mass losses due to partial scale spallation follow. Contrarily, the implanted specimens show much slower mass gains and no scale spallation was observed, indicating an improved oxidation resistance.
The kinetic results for the Mo implantation are summar-ised in Fig. 7, where mass gains are quite small and they decrease to some degree as the implantation energy in-creases, suggesting that wider implanted area gives better oxidation resistance.
The kinetic results for the W implantation are summarised
in Fig. 8. The dose of1019m 2 results in no improvement.
The dose of1020m 2leads to a large improvement, but after
15 cycles slight acceleration in the mass gain was observed. However, the implantation under the other conditions leads to quite small mass gains and no scale spallation. Thus excellent oxidation resistance was obtained. The implantation of Ta gave similar results as those of the implantation of W. The oxidation resistance of all the implanted specimens is summarised in Table 2, where ‘‘excellent’’ means the
formation of virtually Al2O3 scales.
3.3 Metallographic examinations
Figure 9 shows GAXRD profile of the W-implanted
specimen (100 keV, 1021m 2), oxidised for a short period;
i.e. the specimen was heated to 1200 K in oxygen in about
3.6 ks and the furnace was switched off immediately. The
characteristic points are high peaks of -TiAl and Z-phase
(Ti5Al3O2),12)and peaks of-Al2O3and TiO2(rutile). These
indicate that the scale is very thin and consists of -Al2O3
and TiO2. A definite continuous Al2O3 layer was formed
[image:4.595.99.499.67.361.2]Fig. 4 TEM bright field image and electron diffraction patterns of the W-implanted specimen (100 keV,1021m 2).
Table 4 EDS results of the W-implanted (100 keV,1021m 2) specimen (mol%).
Position Al Ti W Remarks
1 59.4 29.8 10.8 Amorphous
2 49.0 37.1 13.9 Amorphous +-Ti 3 27.2 27.9 44.9 -Ti phase
4 49.9 48.6 1.5 -Ti phase
[image:4.595.46.290.431.508.2]according to AES. This will be shown later. The formation of
Z-phase is due to the consumption of Al to form Al2O3and
strong peaks for this phase suggest that the scale is very rich
in Al2O3. The GAXRD profile of the W-implanted specimen
(100 keV,1019m 2) showed higher peaks for TiO2than those
for -TiAl, indicating that the scale consists predominantly
of TiO2with a small amount of Al2O3. This is consistent with
the oxidation result and can conclude that the dose of
1019m 2is insufficient to obtain good oxidation resistance.
Figure 10 is an XRD profile of the W-implanted specimen
(100 keV, with 1021m 2) oxidised for 1440 ks (400 h).
Comparing this figure with Fig. 9, it is certain that the oxide
scale is still very thin and the TiO2 growth is mostly
suppressed during the whole oxidation period. The intensity
ratio of Al2O3to TiO2also suggests this suppression.
Fig. 5 TEM bright field image and electron diffraction pattern correspond-ing to-Ti of the Mo-implanted specimen (340 keV,1021m 2).
0
500
1000
1500
-100 0 100 200
Mass Change,
∆
Oxidation Time,
t
/ks
TiAl
Fe
+Fe
+M
/g m
-2
Fig. 6 Cyclic oxidation curves of the TiAl and Fe-implanted specimens.
0 10 20
Mass Change,
Oxidation Time, t /ks
M
/g m
-2
∆
0 10 20
Mo+, 50 keV, 1021 m-2
0 10 20
Mo+, 200 keV, 1021 m-2
Mo+, 340 keV, 1021 m-2 Mo+, 40 keV, 2 x 10²¹ m-2
0 500 1000 1500
0 10 20
Fig. 7 Cyclic oxidation curves of the Mo-implanted specimens.
0
500
1000
1500
-100
-50
0
50
100
Mass Change,
∆
Oxidation Time,
t
/ks
W+ 100 keV, 1019
100 keV, 1020 100 keV, 1021 180 keV, 1021
M
/g m
-2
Fig. 8 Cyclic oxidation curves of the W-implanted specimens.
20
30
40
50
60
70
80
0
400
800
1200
/ (
π
/180 rad)
Intensity (a.u.)
W
+, 100 keV, 10
21m
-2α R
R γ
γ
Z
α γ
γ γ
R
γγ α
α R
α γ
γ
: -TiAl
: Z -phase : TiO2
: -Al2O3
Z
R α α
γ γ
Z Z Z Z Z
γ,
Z R
2θ
[image:5.595.52.283.70.431.2] [image:5.595.338.518.73.292.2] [image:5.595.330.531.334.474.2] [image:5.595.63.282.487.635.2] [image:5.595.309.546.518.662.2]Figure 11 shows the AES depth profiles of the Fe-implanted specimen oxidised for the short period. This specimen has an oxide scale of about 450 nm thickness. The scale consists of four layers. The outermost thin surface layer is rich in Fe and Ti. The second and fourth layers are virtually
Al2O3 and the intermediate layer is a mixture of Al2O3and
TiO2. Fe is found only in the outermost layer. It means that
implanted Fe is retained in the surface layer during the
oxidation and does not act as a dopant to TiO2 during the
subsequent oxidation. The enrichment of Al2O3in the second
and fourth layers is thought to have resulted in the good oxidation resistance.
The W-implanted specimen (100 keV,1021m 2) oxidised
for the short period has a scale consisting of three layers as
shown in Fig. 12: outer and inner Al2O3 layers, and
intermediate Al2O3/TiO2mixture. W is found in the middle
part of the scale with Ti, strongly suggesting the
incorpo-ration of W in TiO2. The W-implanted specimen (180 keV,
1021m 2) showed a similar feature to this specimen. On the
other hand, the W-implanted specimen with a dose of
1019m 2did not have a definite Al2O3layer in the scale.
There is an Al-depletion layer beneath the scale for all the specimens which have good oxidation resistance as shown in Figs. 11 and 12. Considering the GAXRD results stated above, this layer is predominantly Z-phase and the element
concentration in this layer is almost consistent with the
composition of this phase,i.e.Ti5Al3O2.
Characteristic points for the SEM and EPMA after 1440 ks (400 h) oxidation were as follows. The outer surface of the Fe-implanted specimen contained small oxide nodules
con-sisting of porous mixture of TiO2 and Al2O3, though a
protective Al2O3-rich layer was present beneath it. The
implantation of the other ions with a dose of 1021m 2
resulted in the formation of virtually Al2O3 scales of about
1mmthickness with smooth surfaces. The above results mean
that the Al2O3layer in scale on the Fe-implanted specimen is
not completely dense and thus can not prevent the slight TiO2
growth during the subsequent oxidation. On the other hand,
the growth of TiO2 is significantly suppressed by the
implantation of the other elements with the highest dose during the test period.
4. Discussion
In general, the mass transport through TiO2is much faster
than through Al2O3. Therefore, it is prerequisite to form an
Al2O3scale or at least a dense and continuous Al2O3layer in
the scale for obtaining the sufficient oxidation resistance for TiAl-based materials. The present results clearly show that the implantation of Mo, Ta or W improves the oxidation
resistance of TiAl significantly by forming virtually Al2O3
scales, provided that the ion dose is sufficiently high. The improvement can be explained mainly by the following two
mechanisms: (1) enhancement of Al2O3 formation and/or
stabilising the Al2O3 scale, and (2) suppression of TiO2
growth.
The first mechanism can be related to the formation of-Ti
phase. This was confirmed by GAXRD and TEM observa-tions for the specimens implanted with the highest dose. It is
very probable13,14)that the Al diffusion in the-Ti phase is
much faster than in TiAl, because the former is solid solution while the latter has an ordered structure. Since the diffusivity of Al in TiAl is not available in the literature, it is necessary to confirm this point by a further study.
The enrichment of Al relative to Ti in the outermost layers by the implantation, shown in Tables 3 and 4, seems to
additionally contribute to the enrichment of Al2O3 in the
20
30
40
50
60
70
80
0
400
800
1200
/ (
π
/180 rad)
Intensity
→
(a.u.)
W
+, 100 keV, 10
21m
-2 γ : γ -TiAlα2 : Ti3Al
R : TiO2
α :α-Al2O3
αR α R
γ
α2
Z
α2
Z
αγ
R
γ
α Z Z
α Z Z
Z γ
γ γ
[image:6.595.51.288.75.221.2]2θ
Fig. 10 XRD profile of the W-implanted specimen oxidised, for 20 cycles (400 h).
0
500
1000
1500
2000
0
20
40
60
80
100
Depth,
d
/nm
Concentration,
C
/(mol %)
Al
Ti
O
Fe
Fe
+, 50 keV, 10
21m
-2Fig. 11 AES depth profiles for the Fe-implanted specimen, oxidised for the short period.
0
200
400
600
800 1000 1200
0
20
40
60
80
100
Depth,
d
/nm
Concentration,
C
/(mol %)
Al
Ti
W
O
[image:6.595.310.545.76.234.2]W
+, 100 keV, 10
21m
-2 [image:6.595.54.287.276.436.2]initial scales.
The fact that the implantation of W (180 keV,1021m 2)
showed the best oxidation resistance supports the first mechanism, because the higher acceleration energy resulted in wider penetration depth of W. In other words a thicker
layer of -phase is formed, where more Al atoms can
participate in the Al2O3formation compared with the case of
lower acceleration energy.
The formation of a definite layer of Z-phase12)reflects the
formation of a protective Al2O3 layer, otherwise this layer
would decompose to discrete Al2O3 and2-Ti3Al phases.
The second mechanism is achieved by the so-called doping effect; the incorporation of an element with higher valence
than that of Ti, 4, in TiO2 reduces lattice defects and thus
significantly slows the TiO2 growth.15)Mo, Ta, W and Nb8)
are effective in this respect, whereas Fe has an adverse effect because of its valence of 2 or 3. If Mo and W were in solution
in TiO2 having valence of 6, they may have larger effects
than Nb and Ta. The incorporation of W in TiO2of the initial
scale can be understood by the AES result shown in Fig. 12. However, Fe is present on top of the initial scale as oxide as
shown in Fig. 11, rather than in solution in TiO2. Fe was
found only in the outermost layer of the scale with Ti. Thus implanted Fe is retained in the surface layer and has no or little influence on the subsequent oxidation.
5. Summary
The ion implantation of Mo, Ta or W to TiAl improves its cycle oxidation resistance in a flow of purified oygen under atmospheric pressure with temperature varying between
room temperature and 1200 K. Virtually Al2O3 scales are
formed. They are very adherent to the substrate showing no
spallation. A dose of1021ions m 2 gives the best oxidation
resistance, but a dose of1019ions m 2has no effect. The ion
implantation of Fe has a similar effect but with less degree. The acceleration voltage has a little influence; a hihger voltage results in a deeper modified layer, hence a slight further improvement in the oxidation resistance.
The GAXRD for the Fe-, Mo-, Ta- or W-implanted
specimens and TEM observations for the Fe-, Mo- or W-implanted specimens revealed the formation of a thin layer of
-phase. The excellent oxidation resistance obtained is
explained mainly in terms of (a) formation of -Ti phase,
(b) enrichment of Al relative to Ti in the outermost layer and (c) so-called doping effect of the implanted emelemts to
TiO2. (a) and (b) result in the formation of thin Al2O3-rich
layers in the initial scales and (c) slows the TiO2 growth
making the situation much more favourable to establish a thin
but definite Al2O3 layer. Once this layer is formed, the
subsequent oxygen transport to the substrate becomes very
slow so that Al2O3is enriched at the scale bottom making the
scale virtually Al2O3scale.
REFERENCES
1) T. Noda: Intermetallics6(1998) 709–713.
2) T. Tetsui and S. Ono: Intermetallics7(1999) 689–697.
3) Y.-W. Kim, R. Wagner and M. Yamaguchi: Proc. Gamma Titanium Aluminides, (TMS, 1995).
4) Y.-W. Kim, D. M. Dimiduk and M. H. Loretto: Proc. Gamma Titanium Aluminides, (TMS, 1999).
5) J. S. Williams and J. M. Poate:Ion Implantation and Beam Processing, (Academic Press, New York, 1984).
6) H. Ryssel and I. Ruge:Ion Implantation, (John Wiley & Sons, New York, 1986).
7) S. Taniguchi, K. Uesaki, Y.-C. Zhu, H.-X. Zhang and T. Shibata: Mater. Sci. Eng.A249(1998) 223–232.
8) S. Taniguchi, Y.-C. Zhu, K. Fujita and N. Iwamoto: Oxid. Met.58
(2002) 375–390.
9) S. Taniguchi, T. Shibata and S. Itoh: Mater. Trans., JIM32(1991) 151– 156.
10) S. Becker, A. Rahmel, M. Schorr and M. Schu¨tze: Oxid. Met.38(1992) 425–464.
11) K. Hashimoto, M. Miura and Y. Mizuhara: Intermetallics 6(1998) Issues 7–8, pp. 667–672.
12) N. Zheng, W. Fischer, H. Grubmeier, V. Shemet and W. J. Quadakkers: Scr. Metall. Mater.33(1995) 47–53.
13) M. Koiwa, H. Nakajima and T. Ito: Bull. Japan Inst. Metals28(1989) 723–731. (in Japanese)
14) H. Nakajima and M. Koiwa: ISIJ Inter.31(1991) 757–766. 15) K. Hauffe:Progress in Metal Physics.4, (Pergamon Press, London,