Effect of the Order-Disorder Transition of the bcc Structure
on the Solubility of Be in the Fe-Be Binary System
Hiroshi Ohtani, Yoshiko Takeshita
*and Mitsuhiro Hasebe
Department of Materials Science and Engineering, Kyushu Institute of Technology, Kitakyushu 804-8550, Japan
In the Fe-Be binary system, the solubility of Be in the-Fe phase deviates significantly from the so-called Arrhenius equation near temperatures of 600C. The metastable ordering of the bcc structure in this binary system is expected to play a key role in the phase boundary anomaly. Thus, a thermodynamic analysis of the Fe-Be binary system has been performed considering the ordering behaviour of the bcc phase. The total energies of the ordered structures based on the bcc lattice were obtained usingab initioenergetic calculations. The cluster expansion method was applied to the results, and the free energies at finite temperatures were calculated for the bcc solid solution. The formation energy of thephase was also calculated using band-energy calculations. The results were analysed together with some experimental data using the sublattice model, and the equilibrium phase diagram was calculated. The results support the formation of a metastable (bcc + B2) two-phase region accompanied by an ordering of the bcc structure. This metastable ordering of the bcc phase was the dominant factor governing the anomalous change in the solubility of Be in the higher temperature range.
(Received November 20, 2003; Accepted February 3, 2004)
Keywords: phase diagram, solubility, ab initio energetic calculations, metastable phase separation, order-disorder transition
1. Introduction
It is well known that the solubility of Be in bcc Fe ()
deviates significantly from the Arrhenius equation; i.e., a
proportional relationship exists between the logarithm of the
solubility and the reciprocal of the temperature. Takayamaet
al.1,2) detected this anomaly experimentally in the Fe-Be
binary system and showed that the behaviour could be attributed to the magnetic transition of bcc Fe. According to their thermodynamic analysis, the solubility limit of the
FeBe2() phase in the binary system was approximated using
the following expression
x=¼exp Q
pþQf
RT
; ð1Þ
where Qp and Qf are the paramagnetic and ferromagnetic
terms of the free energy change associated with the
dissolution of the FeBe2 phase into the phase, and are
described by
Qp¼ 1 2½G
form FeBe2
p
þ ½FeBep;
Qf ¼1 2½G
Fe
f þ ½S
Fe
fTBe:
ð2Þ
In eq. (2), ½Gform
FeBe2
p, ½
FeBe
p, ½G
Fe
f, and ½S
Fe f
represent the Gibbs energy of formation for the FeBe2phase,
the interaction energy between Fe and Be atoms in the
paramagneticphase, the ferromagnetic free energy, and the
ferromagnetic entropy of pure Fe, respectively. In terms of eqs. (1) and (2), it can be understood that the solubility limit
deviates from the Arrhenius relation whenTBe, the descent
rate of the Curie temperature with an addition of Be to pure Fe, is highly negative. However, the interpretation of the anomaly in the solubility line on the basis of eq. (1) requires
TBe¼ 1800K,2)which is much more negative than the
experimental result of1250K.3,4)A thermodynamic
analy-sis5) assuming T
Be¼ 1250K cannot reproduce the
solubility of Be in thephase with sufficient accuracy.
On the other hand, the age hardening of this alloy has been investigated experimentally in relation to the anomaly in the
solubility of Be.6–11)The results are summarized in Ref. 12),
and a brief outline of the ageing process of this alloy is as follows. The disordered bcc structure forms in the initial stage, and consequently, the B2-type ordered structure
separates in the bcc phase. Ah100imodulated structure with
changes in concentration was observed in some samples using electron microscopy. This ordering of the bcc structure possibly influences the solubility of Be.
Therefore, in the present study, a thermodynamic analysis of the Fe-Be binary system was carried out considering a metastable ordering of the bcc structure, to clarify the origin of the anomaly in the solubility.
2. Calculation Procedures
The construction of phase diagram calculations based on experiments and thermodynamic analysis are generally referred to as the Calculation of Phase Diagrams (CAL-PHAD) approach. This method provides a very accurate understanding of the properties originating in the macro-scopic character of the material under study. However, a shortcoming of this approach is that it is hard to obtain information on metastable equilibria, or on undiscovered phases, since the thermodynamic parameters from this method can only be evaluated from experimental data. Such serious problems, which are intrinsic to the CALPHAD approach, may be solved with the assistance of the first-principle energetic-calculation method. Thus, in the present study, some thermodynamic quantities for bcc structure
obtained by theab-initioapproach will be introduced in the
conventional CALPHAD-type analysis of the Fe-Be binary system.
*Undergraduate Student, Kyusyu Institute of Technology, Present address:
Hitachi HBM Co. Ltd., Tokyo 140-8502, Japan.
2.1 Ab initiocalculation of the Gibbs free energy
The bcc phase is a metastable phase located in the central part of the phase diagram, and thus, the thermodynamic properties in this region are unknown. To clarify the uncertainty of the thermodynamic properties, the formation energies of some bcc-based ordered structures were calcu-lated using the Full Potential Linearized Augmented Plane
Wave (FLAPW) method. The formation energy of the
(C14) phase was also derived in the same way.
An outline for deriving the Gibbs free energies of the
bcc-based structures incorporating theab initiocalculations is as
follows.
First, a set of superstructures {A-A2, A3B-D03, AB-B2,
AB-B32, AB3-D03, and B-A2} was selected to be
represen-tative of a series of bcc-based ordered phases, the total
energies were calculated using the WIEN2k13) procedure,
based on the FLAPW method. The generalized gradient
approximation (GGA)14) was used for the exchange and
correlation potentials. Muffin-tin radii of 2.0 au for Fe and Be
were assumed, and RKmax was fixed to 9.0, which almost
corresponds to the cut-off energy of 20 Ry.
With the total energies known, the formation energy of the
bcc-based superstructures, Eform , is defined by averaging
the total energy of the elements with chemical composition to the segregation limit, as shown in the following equation
EformðVÞ ¼EtotðVÞ ð1xBeÞEbccFetot ðVFeÞ
xBeEbccBetot ðVBeÞ;
ð3Þ
where denotes the type of superstructure and V is the
volume.
Then, the effective cluster interaction energies, fviðVÞg,
can be extracted from these formation energies using the Cluster Expansion Method (CEM) developed by Connolly
and Williams.15) This leads to a set of
composition-independent parameters, from which the energy of the set of superstructures can be reproduced in terms of a set of
correlation functionsfig,
EformðVÞ ¼X
i¼0
viðVÞ i; ð4Þ
where,viðVÞis the effective interaction energy of thei-point
cluster, andi is the correlation function for clusteriin the
phase . i is defined as the ensemble average of the spin
operator,ðpÞ, which takes values of1, depending on the
atom occupancy of the lattice site,p. The values ofi for the
superstructures considered in this study are summarized in Table 1. The formation energies to the segregation limit for
the Fe-Be binary system in the D03, B2, B32, and A2
structures in the ground state are summarized in Table 2. The
formation energy of the(C14) phase is also listed in Table 2.
The upper limit of the summation in eq. (4),, specifies the
largest cluster that participated in the expansion. In this study, we considered a tetrahedron as being the largest cluster, since in the bcc structure, the tetrahedron forms an irregular shape containing both the first- and second-nearest neighbour distances. The second pair interaction was also taken into account, which leads to the consequence that
mathematically, five should represent six types of cluster.
From Table 1, we can see thatfigis a66matrix, and
that it is a regular matrix. The matrix inversion of eq. (4) yields the effective interaction energies as
viðVÞ ¼X
5
i¼0
ðiÞ1EformðVÞ: ð5Þ
The Gibbs free energies of the metastable bcc-based phase in the Fe-Be binary system were evaluated using the effective cluster interaction energies up to the tetrahedron cluster, including second pair interaction as
E¼X
5
i¼0
[image:2.595.303.549.95.204.2]vii: ð6Þ
Table 1 The values ofi for the bcc superstructures {A-A2, A3B-D03, AB-B2, AB-B32, AB3-D03, B-A2}.
Ordered 0
1 2 3 4 5
structures point n.n.pair n.n.n.pair triangle tetrahedron
A-bcc 1 1 1 1 1 1
A3B-D03 1 1/2 0 1 1 1
AB-B2 1 0 1 1 1 1
AB-B32 1 0 0 1 0 1
AB3-D03 1 1=2 0 1 1 1
[image:2.595.47.551.636.786.2]B-bcc 1 1 1 1 1 1
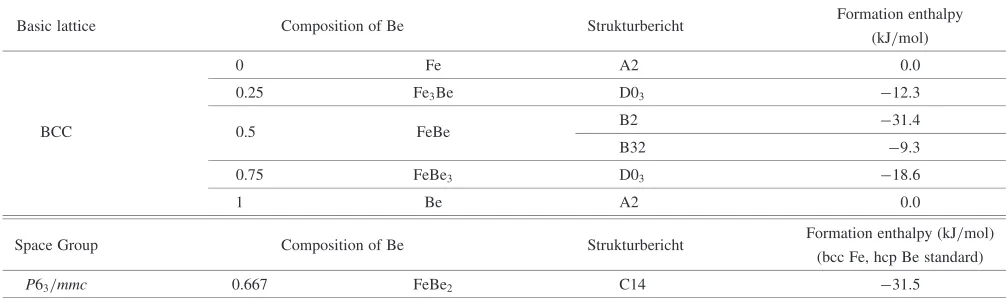
Table 2 The formation energies to the segregation limit for the Fe-Be binary system in the D03, B2, B32, and A2 structures in the ground state. The formation energy of the(C14) phase is also listed.
Basic lattice Composition of Be Strukturbericht Formation enthalpy (kJ/mol)
0 Fe A2 0.0
0.25 Fe3Be D03 12:3
BCC 0.5 FeBe B2 31:4
B32 9:3
0.75 FeBe3 D03 18:6
1 Be A2 0.0
Space Group Composition of Be Strukturbericht Formation enthalpy (kJ/mol) (bcc Fe, hcp Be standard)
P63=mmc 0.667 FeBe2 C14 31:5
At a finite temperature,T, the free energy of a phase of
interest, G, can be obtained by adding a configurational
entropy term,S, to the internal energy, as follows16,17)
G¼ETS: ð7Þ
We used the cluster variation method (CVM) with the tetrahedron approximation to calculate the configurational entropy. For the bcc structure, the entropy formula is
S¼kBln
Q
i;j;k
ðNzijkÞ!
( )12
Q
i
ðNxiÞ!
Q
i;j;k;l
ðNwijklÞ!
( )6
Q
i;j
ðNyijÞ!
( )4
Q
i;j
ðNyijÞ!
( )3;
ð8Þ
wherexi;yij;yij;zijk, and wijkl are the cluster probabilities of
finding the atomic configurations specified by the subscript(s) at a point, the nearest neighbour pair, the second-nearest neighbour pair, the triangle, and the tetrahedron clusters,
respectively, andN is the number of lattice points.
Minimizing the grand potential with respect to all the correlation functions allows for the Gibbs energy of mixing to be obtained as a function of composition at a constant
temperature,T.
2.2 Thermodynamic analysis
The Gibbs energy expression for the terminal solid
solutions (bcc), (fcc), -Be (hcp), and -Be (bcc), the
intermediate phases (C14), (C15), and", and the liquid
phases will be described in this section.
The regular solution approximation was applied to the
liquid, (fcc), -Be, and -Be phases. The molar Gibbs
energy was calculated using the following equation Gm¼xBeGBeþxFeGFe
þRTðxBelnxBeþxFelnxFeÞ
þxBexFeLBe,FeþGmag;
ð9Þ
where Gi denotes the Gibbs energy of element i. This
quantity is called the lattice stability parameter, and is described by the formula
G
i0H
ref
i ¼AþBTþCTlnTþDT
2
þET3þFT7þIT1þJT9;
ð10Þ
where0Href
i denotes the enthalpy of the pure elementiin its
stable state at 298.15 K. The parameter LBe,Fe denotes the
interaction energy between Be and Fe, and has a composi-tional dependency following the Redlich-Kister polynomial as
LBe,Fe¼0LBe,Feþ ðxBexFeÞ 1LBe,Fe
þ ðxBexFeÞ22LBe,Fe:
ð11Þ
To describe the bcc-B2 transition in the thermodynamic modelling, the Gibbs free energy of the bcc phase was
represented according to the two-sublattice model.18) The
Gibbs energy for one mole of phase, denoted as
(Fe,Be)m(Fe,Be)n, was represented by the two-sublattice
model as shown in eq. (12).
G¼y1FeyFe2 GFe:Feþy1Fey2BeGFe:Beþy1Bey2FeGBe:Fe
þy1Bey2BeGBe:BeþRT
m
mþnðy 1 Felny
1 Feþy
1 Belny
1 BeÞ
þ n
mþnðy 2 Felny
2 Feþy
2 Belny
2 BeÞ
þexGþGmag
ð12Þ
The termys
i denotes the site fraction of element i in the
sublattices. The termsmandnare variables denoting the size
of the sublattices, and straightforwardly, the relationships of
m¼0:5andn¼0:5hold for the B2 structure.Gi:jdenotes
the Gibbs energy of a hypothetical compoundij, and terms
relative to the same stoichiometry are identical, whatever the occupation of the sublattice. The excess Gibbs energy term,
exG, contains the interaction energy between unlike atoms,
and is expressed using the following polynomial. exG¼y1
Fey 1 Bey
2
FeLFe,Be:Feþy1Fey 1 Bey
2
BeLFe,Be:Be þy2Fey2Bey1FeLFe:Fe,Beþy2Fey
2 Bey
1
BeLBe:Fe,Be ð13Þ
Li;j:k(orLi:j;k) is the interaction parameter between unlike
atoms on the same sublattice.
The Gibbs energies of the(C14) and(C15) phases were
described using the two-sublattice model assuming m¼
0:333,n¼0:667andm¼0:25,n¼0:75, respectively. The "phase was represented as the stoichiometric line compound, Fe0:1Be0:9.
The magnetic contribution to the Gibbs free energy,Gmag,
was given by the expression
Gmag¼RTfð Þlnðþ1Þ ð14Þ
where
fð Þ ¼11
A
(
79 1 140p þ
474 497
1 p1
3
6 þ 9
135þ 15
600
)
; for <1
ð15Þ
and
fð Þ ¼ 1
A
5
10 þ
15
315 þ
25
1500
; for 1; ð16Þ
and
A¼ 518
1125þ 11692
15975 1
p1
: ð17Þ
The variable is defined asT=Tc, where TC is the Curie
temperature, andis the mean atomic moment expressed in
Bohr magnetons, B. The parameter p depends on the
structure, andp¼0:4for the bcc phase andp¼0:28for the
fcc phase.
3. Discussion
3.1 Thermodynamic analysis of the Fe-Be binary system
An intensive critical assessment of this binary system has
been carried out.5)According to the assessed diagram based
on the work by Aldinger and Petzow,19) the Fe-Be binary
system is composed of the(bcc),(fcc),(C14),(C15),
The liquidus boundaries of the binary system have been
investigated.3,4,20–22)Three invariant reactions concerning the
liquid phase occur, L+, L+-Be, and L +,
as described in detail by Okamoto.5)In addition, the eutectoid
reactions of-Be-Be +, and-Be +"are known
at lower temperature. The solidus boundary for thephase is
not well defined, while the solvus boundary has been
investigated.1,2)The observed trend was in good agreement
with the earlier work.23)The Curie temperatures of Fe-rich
Fe-Be alloys have been determined,3,4) and the Curie
temperature of thephase was changed to1250K based
on these results. The age hardening process of the phase
was studied because of the anomalous change of the solubility line. Several intermediate stages were found before the final equilibrium condition was attained in the age hardening process. The initial stage of the process was a modulation of the homogeneous bcc structure, and the modulations developed into metastable precipitates with structures related to the matrix. It is generally agreed that the modulation gives rise to two phases: the disordered bcc and
the B2 type of metastable ordered phase. The stablephase
then finally precipitates. A metastable phase boundary for the
(bcc + B2) two-phase region has been proposed12) using
several sets of experimental data,24–26) and Ino12) has
proposed a pairwise interaction model to explain the metastable phase relationships.
The information on the experimental data on the phase boundaries and other thermodynamic quantities were ther-modynamically analysed together with the estimated meta-stable quantities of the bcc phase. The evaluated parameters of the Fe-Be binary system are shown in Table 3. The descriptions of the lattice stability parameters for each pure element were obtained chiefly from the Scientific Group
Thermodata Europe (SGTE) data file.27)The Gibbs energies
of mixing in the bcc solid solution at 227 and 727C are
denoted by the square symbols in Fig. 1. For comparison, the values obtained by the present assessment are drawn using the solid lines for the ordered state (BCC B2) and the disordered state (BCC A2), respectively. The convex curva-ture of the free energy in the vicinity of the equiatomic composition corresponds to the formation of the B2 structure. The calculated results of the Fe-Be phase diagram are
compared with the experimental data1,3,4,20,21,23,28,29)in Fig. 2.
The shaded area shown in Fig. 2 is the metastable (bcc+B2) two-phase region, which is accompanied by the ordering of the bcc structure on formation. The dotted line shows the order-disorder transition line, along which the two-phase field expands into the higher temperature range.
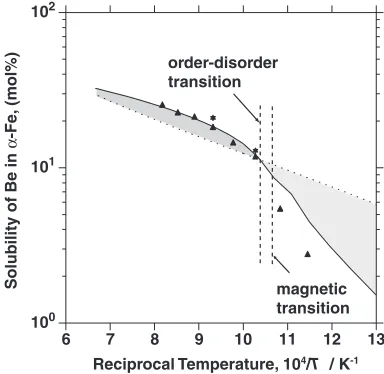
3.2 Effect of the order-disorder transition on the solubility limit
The solubility of Be in thephase is shown in Fig. 3. The
solubility would be denoted by the broken line if there were neither an order-disorder transition nor a magnetic transition in the bcc Fe phase. This is approximated by the straight line following the Arrhenius law for dilute solutions. Thus, the deviation of the solubility from the ideal Arrhenius law is represented by the shaded areas. The dashed lines show the order-disorder transition temperature and the magnetic transition temperature of the bcc Fe phase. The solubility
of Be decreases in the lower temperature region below
650C, while it increases in the higher temperature region.
The decrease in solubility in the lower temperature region can be explained from the viewpoint of the change in
magnetism.1,2) On the other hand, the solubility increases
owing to the order-disorder transition of the bcc phase in the higher temperature range. Figure 4 shows the change in the
order parameter along a solubility line for thephase. The
order parameter was defined by the following equation
¼y1Bey2Be: ð18Þ
The solubility line in Fig. 4(a) intersects the order-disorder
transition line indicated by the dotted line at about 650C. As
can be seen in Fig. 4(b), the order parameter along the
solubility line increases at a higher temperature than 650C,
yielding the progress of the B2 ordering in the bcc disordered phase.
The solubility of Be can be approximated from the equilibrium condition as follows. The chemical potentials of Fe and Be are derived from eq. (12) as eqs. (19) and (20), respectively,
Fe¼GGFe:Fe¼GFe:Feþy1Bey 2 BeGþ
RT
2 ðlny 1 Feþlny
2 FeÞ
þy1Beðy1FeyBe2 þy1Bey2FeÞ LFe,Be:Fe
þy1Bey2Beðy1Bey1FeÞ LFe,Be:Be
þy2Beðy1FeyBe2 þy1Bey2FeÞ LFe:Fe,Be
þy1Bey2BeðyBe2 y2FeÞ LBe:Fe,Be ð19Þ
and
Be¼GGBe:Be¼GBe:Beþy1Fey 2 FeGþ
RT 2 ðlny
1 Beþlny
2 BeÞ
þy1Fey2Feðy1Fey1BeÞ LFe,Be:Fe
þy1Feðy1FeyBe2 þy1Bey2FeÞ LFe,Be:Be
þy1Fey2Feðy2Fey2BeÞ LFe:Fe,Be
þy2Beðy1Fey2Beþy1Bey2FeÞ LBe:Fe,Be; ð20Þ
where the relationship,G¼G
Fe:BeþGBe:FeGFe:Fe
G
Be:Be holds. In deriving eqs. (19) and (20), the magnetic
free energy term,Gmag, was excluded, because a temperature
range higher than the magnetic transition point is considered here. The atomic fractions of the elements on each sublattice are expressed in terms of the order parameter as eq. (21).
y1Fe ¼1xBe 2
y1Be¼xBeþ 2
y2Fe ¼1xBeþ 2
y2Be¼xBe
2 ð21Þ
The equilibrium condition between theand phases is
shown in eq. (22), assuming that the ideal stoichiometry of
thephase is FeBe2.
G¼
Feþ2
Be ð22Þ
Substitution of eqs. (19) and (20) in eq. (22) and assuming LFe,Be:Fe ¼LFe:Fe,BeandLFe,Be:Be¼LBe:Fe,Be, and in addition,
eliminating terms larger than the second power inxBeyields
Element Phase Lattice stability parameter, J/mol Temperature range,C
L GL
FeG bcc Fe
12040:176:55843T3:67515511021T7 25<T<1538
14544:7518:01055T2:29603051031T9 1538<T<5727
G
Fe
Gbcc Fe
1462:4þ8:282T1:15TlnTþ6:4104T2 25<T<1538
1713:815þ0:94001Tþ0:49250951031T9 1538<T<5727
Fe Tc¼1043,¼2:22 25<T<5727
Be GBe Fe G
bcc Fe
3705:78þ12:591T1:15TlnTþ6:4104T2 25<T<1538
3957:199þ5:24951Tþ4:92511030T9 1538<T<5727
G
Fe:FeG bcc
Fe 100000þ34:218T(present work) 25<T<2727
G
Fe:FeGbccFe 225631.931 (present work) 25<T<2727
16065:48917:197431Tþ1:1542962TlnT1:974197103T2þ0:576371106T312646T1 25<T<1254
L GL
BeG hcp
Be 128817:697652:043056Tþ83:9345962TlnT25:899997103T2þ1:535023106T326970699T1 1254<T<1287
126670:571615:444703Tþ78:4982999TlnT22:135851103T2þ1:117948106T327235823T1 1287<T<2727
7477:59428:148507Tþ4:0312159TlnT5:82533710
3T2þ1:12184106T351381T1 25<T<1254
Be
Be
G; Be Be G
hcp
Be 114335:48575:994154Tþ73:9842999TlnT21:078651103T2þ1:119065106T327251743T1 1254<T<1287
118695:885594:274122Tþ76:201923TlnT21:182279103T2þ1:059735106T328502591T1 1287<T<2727
G
BeG hcp
Be 63491:085T 25<T<2727
G
Be:BeG hcp
Be 57001:114T(present work) 25<T<2727
G
Be:BeG hcp
Be 70333:42T(present work) 25<T<2727
System Phase Thermodynamic parameter, J/mol Reference
L LL
Be,Fe¼ 733001:8T ð8500þ5:57TÞ ðxBexFeÞ GBe:Fe0:5Gbcc
Be0:5G bcc Fe
¼ 37100þ9T
G
Fe:Be0:5GbccBe0:5
Gbcc Fe
0L
Be,Fe:Be¼0L
Be:Be,Fe¼ 4T
0L
Fe:Be,Fe¼0L
Be,Fe:Fe¼ 3804T
0L
Be,Fe¼ 71900þ8:1T
Be LBe
Be,Fe¼ ð28450þ27:9TÞ ðxBexFeÞ 340 ðxBexFeÞ
2
Fe-Be G
Be:Fe0:6667G hcp
Be 0:3333GbccFe ¼ 38000þ7:18T Present work
G
Fe:Be0:3333G hcp
Be 0:6667GbccFe ¼143700þ25:9T
LBe,Fe:Be¼ 213450þ68:4T118400 ðy1Bey1FeÞ
LBe:Be,Fe¼L
Fe:Be,Fe¼151010:4Tþ5030 ðy2Bey2FeÞ LBe,Fe:Fe¼ 216250þ67:3T112000 ðy1
Bey1FeÞ
" G" Be:Fe0:9
Ghcp
Be 0:1GbccFe ¼ 12350þ0:38T
G
Be:Fe0:75GbccBe0:25GbccFe ¼ 33050þ5:65T
G
Fe:BeG hcp
Be þ0:75GbccBe0:75GbccFe ¼2657009:07T
L
Be:Be,Fe¼ 60901760 ðy2Bey2FeÞ
Effect
of
the
Order-Disor
der
Transition
of
the
bcc
Structure
on
the
Solubility
of
Be
in
the
Fe-Be
Binary
System
[image:5.595.44.778.63.550.2]-35 -30 -25 -20 -15 -10 -5 0
0.2 0.4 0.6 0.8
Fe
Be
BCC_B2 BCC_A2
227
°
C
-35 -30 -25 -20 -15 -10 -5 0
0.4 0.6 0.8
0.2
BCC_A2
BCC_B2
Fe
Be
ab-initio calculation
Molar Fraction, x
BeMolar Fraction, x
BeGibbs free ener
gy
,
∆
G
/ kJ·mol
-1
Gibbs free ener
gy
,
∆
G
/ kJ·mol
-1
727
°
C
Fig. 1 The Gibbs energies of mixing in thebcc solid solution at 227C and 727C based onab initioenergetic calculations.
200 400 600 800 1000 1200 1400 1600
Fe 10 20 30 40 50 60 70 80 90 Be
γ
L
bcc+B2
Be (mol%)
T
emperature
,
T
/
°
C
16Oes
Oesterheld 29Wev Wever 48Gor Gordon 48Tei Teitel 60Gel Geles 63Heu Heubner 65Ham Hammond 75Ko Ko 16Oes Oesterheld 29Wev Wever
α
ζ
ε δ
Fig. 2 Data for the calculated Fe-Be phase compared with the exper-imental data.
100 101 102
Solubility of Be in
α
-Fe
, (mol%)
6 7 8 9 10 11 12 13
order-disorder transition
magnetic transition
Reciprocal Temperature, 104/T / K-1
Fig. 3 The solubility of Be in thephase.
0 0.1 0.2 0.3 0.4 0.5 0.6
Or
der P
arameter
Fe 10 20 30 40 50 60
Be Contenet in α phase (mol%)
830 °C
650
1000 1190
200 400 600 800 1000 1200 1400
5 10 15 20 25 30 35
Fe
bcc+B2
Be (mol%)
T
emperature
,
T
/
°
C
γ
α
Fig. 4 (a) Enlarged Fe-rich portion of the calculated Fe-Be binary phase diagram. The dotted line shows the order-disorder transition line. (b) Change in the order parameter along the solubility line for thephase. The increase of the value at a higher temperature than 650C yields the progress of the B2 ordering in the bcc disordered phase.
[image:6.595.97.504.74.285.2] [image:6.595.54.288.329.498.2] [image:6.595.330.522.330.517.2] [image:6.595.110.489.560.747.2]the following equation.
fðxBe; Þ ¼ ðGGFe:Fe2GBe:BeÞ
2G4LFe,Be:Feþ 1
4ð3Gþ4LFe,Be:Fe 10LFe,Be:BeÞ2þ ð4Gþ16LFe,Be:Fe
8LFe,Be:BeÞxBe
2RTlnxBeþRT 2xBe
2
¼0 ð23Þ
Defining the solubility of Be to be x0
Be when ¼0, transforms eq. (23) into
fðx0Be;0Þ ¼ ðGFeBe2
G
Fe:Fe2GBe:BeÞ
2G4LFe,Be:Feþ ð4Gþ16LFe,Be:Fe
8LFe,Be:BeÞx0Be2RTlnx 0
Be¼0: ð24Þ
When eq. (24) is subtracted from eq. (23), then the difference is
xBe
x0 Be
¼exp
ð3Gþ4LFe,Be:Fe
10LFe,Be:BeÞ=8RTþ 1 8x2 Be
2
:
ð25Þ
According to the phase diagram, the solubility of Be at
727C can be estimated asxBe¼0:15. Under this condition,
xBe=x0Be¼1:15when¼0:2, andxBe=x0Be¼1:7when¼ 0:4. Thus, it can be understood that the solubility of Be increases with an increase in the magnitude of ordering in the
phase.
3.3 Relationship between ordering accompanied by phase separation and interatomic interactions
The coexistence of ordering and phase separation, as seen in the Fe-Be system, has been explained using pairwise
atomic interactions.12) That is, the ordering occurs in the
crystal lattice owing to the attractive interaction between nearest neighbour atoms. The difference in size of unlike atoms results in a strain energy, which leads to an instability in the system. The atoms change their positions to lower the total energy of the crystal, and consequently, a separation of the ordered and disordered structures develops. The intera-tomic interactions were estimated by expanding the total energies of the ordered structures obtained from the band-energy calculations.
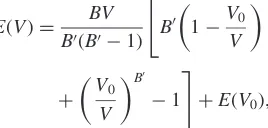
Using the Murnaghan equation of states,30)as shown in eq.
(26), the total energies of the A2, B2, B32, and the D03
structures were expressed as a function of the volume
EðVÞ ¼ BV
B0ðB01Þ "
B0
1V0
V
þ V
0
V
B0 1
#
þEðV0Þ;
ð26Þ
where B, B0, and V0 are the bulk modulus, its pressure
derivative, and the equilibrium volume, respectively, at normal pressures. Table 4 shows the coefficients in eq. (26)
for each ordered structure. In Table 4,EðVÞis the total energy
of each ordered structure in the equilibrium volume of the B2
structure;i.e.,V0¼124:0438(au3). The formation energy of
each structure is represented as Eform, by defining the
average concentration of the total energy of the bcc Fe and the bcc Be phases at the segregation limit. By applying eq. (5)
to these formation energies, the effective interaction,fviðVÞg,
[image:7.595.306.547.94.195.2]corresponding to each cluster was calculated, as shown in Table 5. The positive numbers define the attractive force working between unlike atoms.
In Table 5, v2 represents the interaction energy between
the nearest neighbour atoms, while v3 denotes the
next-nearest neighbour interaction. This qualitative explanation concerning the coexistence of the ordering and phase
separation12) seems to be supported by our calculations.
However, the interaction energy at the next-nearest neigh-bour position is extremely small, and is almost 1/6 that at the nearest neighbour position. Furthermore, according to an-other paper we have published on a thermodynamic analysis
of the Co-Al system,31) the coexistence of the A2 and B2
structures is possible, even in the case where the first- and second-nearest neighbour interactions have positive num-bers. Based on this knowledge, the attractive interaction at the nearest neighbouring position is the predominant factor in the coexistence of the ordering and phase separation, and the contribution of the chemical next-nearest neighbour inter-action may be rather small.
4. Conclusions
A thermodynamic analysis of the Fe-Be binary system was performed to examine the relationship between the anom-alous change in the solubility and the metastable ordering of
the bcc phase. The total energies of the A2, B2, B32, and D03
structures in the ground state were calculated using the FLAPW method. The cluster expansion method was applied to these results, and the effective interaction energies for a tetrahedron cluster were obtained, and the free energies at
Table 4 The coefficient of the Murnaghan equation of states for the bcc superstructures.
Structures B B
0 EðV
[image:7.595.304.548.233.319.2] [image:7.595.103.237.666.730.2]0Þ V0 GPa Ry/au3 Ry au3 Fe (bcc) 334.2450 5.5525 5091:1796 155.5298 Fe3Be (D03) 75.3890 0.7851 3833:1698 144.3524 FeBe (B2) 180.8774 3.6243 2575:1689 124.0438 FeBe (B32) 87.6360 5.9438 2575:1367 122.6823 FeBe3(D03) 81.5496 3.6914 1317:1225 112.6662 Be (bcc) 244.0350 3.0866 59:0657 105.6658
Table 5 The effective interactionfviðVÞgcorresponding to the clusters.
Effective cluster interactions (kJ/mol) Tetrahedron CVM
v1 4:0
v2 28.8
v3 4:8
v4 4.0
finite temperatures were calculated for the metastable bcc
solid solution. The formation energy of thephase was also
calculated using band-energy calculations. The results were analysed together with some experimental data using the sublattice model, and the equilibrium phase diagram was calculated. The results are summarized as follows.
(1) The calculated binary phase diagram was consistent with the experimental data concerning the phase boundaries, thermodynamic quantities, and the Curie point, and also with the metastable Gibbs energy for the bcc phase calculated using the first-principle technique. (2) The solubility of Be decreases at temperatures lower
than 650C from the magnetic transition, while it
increases at higher temperatures owing to the order-disorder transition of the bcc structure.
(3) The predominant factor in the coexistence of the ordering and phase separation, as observed in the Fe-Be binary system, is supposed to be the attractive interaction at the nearest neighbouring position.
Acknowledgments
The authors are grateful to Prof. Tetsuo Mohri, Hokkaido University, Prof. Marcel Sluiter, Tohoku University, and Prof. Ying Chen, University of Tokyo, for helpful discussions about the CVM calculations.
REFERENCES
1) M. Ko and T. Nishizawa: J. Japan Inst. Metals43(1979) 118–126. 2) T. Takayama, M. Y. Wey and T. Nishizawa: Trans. Japan Inst. Metals
22(1981) 315–325.
3) G. Oesterheld: Z. Anorg. Chem.97(1916) 6–40.
4) F. Wever and A. Muller: Mitt. Kaiser-Wilhelm-Inst. Eisenforsch. Dusseldorf11(1929) 193–223.
5) H. Okamoto and L. E. Tanner:Phase Diagrams of Binary Iron Alloys, (ASM International, Materials Park, OH, USA, 1993) Monograph Series on Alloy Phase Diagrams, 49–61.
6) M. V. Dzhibuti and Yu. D. Tyapkin: Krystallografiya.13(1968) 307– 310.
7) Yu. D. Tyapkin, A. V. Gavrilova, V. A. Golikov and V. D. Vasin: 7th Int. Conf. Electronmicrosc., Grenoble, France, (1970) 175–176. 8) J. Higgins, R. B. Nicholson and P. Wilkes: Acta Metall.22(1974) 201–
217.
9) Yu. D. Tyapkin, Y. V. Evtushenko, N. T. Travina and V. I. Kovalenko: Ukr. Fiz. Khim.20(1975) 858–860.
10) Yu. D. Tyapkin, Y. V. Evtushenko and N. T. Travina: Fiz. Met. Metalloved45(1978) 315–326.
11) M. K. Miller, S. S. Brenner, M. G. Burke and W. A. Soffa: Scr. Metall.
18(1984) 111–116.
12) H. Ino: Acta Metall.26(1978) 827–834.
13) P. Blaha, K. Schwarz, G. K. H. Madsen, D. Kvasnicka and J. Luiz: WIEN2k, An Augmented Plane Wave + Local Orbitals Program for Calculating Crystal Properties (Karlheinz Schwarz, Tchn. Universita¨t Wien, Austria), 2001, ISBN 3-9501031-1-2.
14) J. P. Perdew, K. Burke and Y. Wang: Phys. Rev. B54(1996) 16533– 16539.
15) J. W. D. Connolly and A. R. Williams: Phys. Rev. B27(1983) 5169– 5172.
16) M. H. F. Sluiter, Y. Watanabe, D. de Fontaine and Y. Kawazoe: Phys. Rev. B53(1996) 6137–6151.
17) Y. Chen, S. Iwata and T. Mohri: Calphad.26(2002) 583–589. 18) M. Hillert and L.-I. Staffansson: Acta Chem. Scand.24(1970) 3618–
3626.
19) F. Aldinger and G. Petzow: ‘‘Constitution of Beryllium and its Alloys’’ inBeryllium Science and Technology, D. Webster and G. J. London, Ed., 1, (1979) 235–305.
20) R. J. Teitel: US Atomic Energy Comm., Publ.AECD-2251 (1948). 21) S. H. Gelles and J. J. Pickett: US Atomic Energy Comm., NMI-1218,
p. 44 (1960).
22) S. Jonsson, K. Kaltenbach and G. Petzow: Z. Metallkd.73(1982) 534– 539.
23) U. Heubner: Arch Eisenhu¨ttenwes.34(1963) 547–552.
24) M. V. Heimendahl and U. Heubner: Acta Metall.11(1963) 1115–1117. 25) Y. Sumitomo, K. Matsuhiro, M. Ura and F. E. Fujita: Report of the
Annual Meeting of the Japan Inst. Metals (1971). 26) K. Yagisawa: Phys. Status Solidi (a)16(1973) 291–297. 27) A. T. Dinsdale: CALPHAD15(1991) 317–425.
28) P. Gordon: Manhattan Project (1948), unpublished data shown in Reference 20).
29) M. L. Hammond, A. T. Davinroy and M. I. Jacobson: Tech. Rept., AFML-TR-65-223 (AD468484) p. 77 (1965).
30) F. D. Murnaghan: Proc. Nat. Acad. Sci. U.S.A.,30(1944), 244–247. 31) H. Ohtani, Y. Chen and M. Hasebe: to be presented in the Mater. Trans.