Diffusion Analysis across Grain Boundary in Al–3.7 mass%Cu Alloy
Using Analytical Electron Microscopy
Takeshi Fujita, Kenji Kaneko and Zenji Horita
Department of Materials Science and Engineering, Faculty of Engineering, Kyushu University, Fukuoka 812-8581, Japan
An Al–3.7 mass%Cu alloy was subjected to aging treatment at selected temperatures in the range from 453 to 548 K. Diffusion coefficients of Cu in the alloy were then determined from Cu concentration profiles measured across the grain boundary. A high spatial resolution analytical electron microscope (AEM) capable of forming a 1 nm probe was used to measure the concentration profiles. As the aging temperature is lower, the diffusion coefficients tend to deviate from the values extrapolated from the higher annealing temperatures. It is suggested that this deviation is due to the presence of quenched-in excess vacancies. The concentration profiles were also measured for the boundaries having different misorientation angles. It is shown that the concentration profiles are essentially the same regardless of the misorientation angles and of the boundary characters except for the misorientation angles smaller than a few degrees.
(Received January 27, 2003; Accepted April 25, 2003)
Keywords: Al–3.7 mass%Cu alloy, precipitate free zone, misorientation angle, diffusion coefficient, analytical electron microscopy, X-ray microanalysis
1. Introduction
In many age-hardenable alloys, solute concentration changes near grain boundaries. The formation of precipitate free zones (PFZ) is one of the phenomena arising from the depletion of solute concentration. By making use of the solute depletion around grain boundaries, there are some attempts for the determination of diffusion coefficients.1–4) An advantage of such diffusivity measurements is that neither fabrication of diffusion couples nor deposition of radioactive tracers is required and, more importantly, it is possible to determine diffusion coefficients at lower temperatures than the conventional methods. However, because the diffusion is rather limited in short distances, the measurements of concentration profiles require a high-spatial resolution for quantitative micro-chemical analysis.
Most of the diffusivity measurements from solute profiles across the grain boundaries were performed by analytical electron microscopy (AEM).1–5)Since the AEM was devel-oped by combining transmission electron microscopy (TEM) with micro-chemical analysis, it is capable of reducing the beam spreading in the specimen and thus of increasing the spatial resolution. The first application of AEM was reported by Doig and Edington1)who utilized an electron energy loss spectroscopy (EELS) system in the AEM for the determina-tion of diffusion coefficients of solute atoms in Al– 7 mass%Mg and Al–4 mass%Cu alloys. Nicholls and Jones2) employed an energy dispersive X-ray spectrometry (EDS) system in the AEM to determine diffusion coefficients of Zn in an Al–10 mass%Zn alloy. Michael and Williams3) also used an EDS system to examine solute profiles of moving grain boundaries in an Al–4.7 mass%Cu alloy. A compre-hensive review concerning the application of AEM to diffusivity measurement was given by Williams and Eding-ton.5)
In this study, Cu solute profiles are measured across grain boundaries in an Al–3.7 mass%Cu alloy using an advanced AEM system capable of forming a 1 nm probe and of operating a scanning mode to achieve elemental mapping.
The diffusion coefficients of Cu in the alloy are determined from the Cu profiles obtained after aging treatments at lower temperatures. This study also examines the effect of misorientation angle on the Cu profiles.
2. Experimental
An ingot of an Al–3.7 mass%Cu alloy was prepared by melting with an induction furnace and casting into a steel mold with dimensions of 15100150mm3. The ingot was homogenized at 833 K for 18 ks (5 h) in air. The impurity level of the alloy is about 0.02% for each of Fe and In and about 0.01% for any of Si, Ti, Pb and Ga. The ingot was swaged into rods with diameters of 10 mm and cut into lengths of 60 mm. The rods were solution-treated at 823 K for 3.6 ks (1 h) and quenched into iced water. At this stage, TEM observation confirmed no precipitation occurred within grains or at grain boundaries. The rods were cut to thicknesses of 20 mm and each piece was subjected to aging at the conditions shown in Table 1. The aging was always terminated by water quenching. The aged samples were sliced and ground mechanically and finally electropolished in a solution of 20%HNO3 and 80%CH3OH to prepare thin
specimens for TEM and AEM. All specimens were kept in a refrigerator at 255 K to prevent from nucleation and growth of GP zones before electro-thinning for electron microscopy. In this study, a JEM-2010FEF analytical electron micro-scope with a thermal Schottky type of a field emission gun was used at 200 kV. This AEM is capable of forming the
Table 1 Aging conditions.
Temperature,T/K Age time,t/ks (h)
548 1.8 (0.5)
523 1.8 (0.5)
498 3.6 (1)
473 7.2 (2)
453 10.8 (3), 25.2 (7)
electron probe size of about 1 nm and of making elemental mapping analysis using a JEM-2200F X-ray spectral-imaging system in the scanning-TEM (STEM) mode. X-rays were measured using a Si(Li) type of a Noran energy dispersive X-ray spectrometer with an ultrathin window. Specimen drift was automatically corrected by an image-tracking system within the EDS system during each elemental mapping analysis. Specimens were tilted so that all analyzed bound-aries were aligned parallel to the incident beam. No grains were oriented at Bragg diffraction conditions to avoid any dynamical effect. Thin regions were selected to minimize beam spreading. For the measurement of misorientation angles between neighboring grains, Kikuchi-line patterns were recorded by focusing a beam at the individual grains with the diffraction mode. The diffraction patterns were then analyzed to determine the misorientation angles using a system of the Orientation Determination and Crystallograph-ic Analysis (ORCA).6) In addition to the analyses using AEM, microstructural observations were carried out at lower magnifications using a Hitachi-8100 transmission electron microscope operating at 200 kV.
3. Results
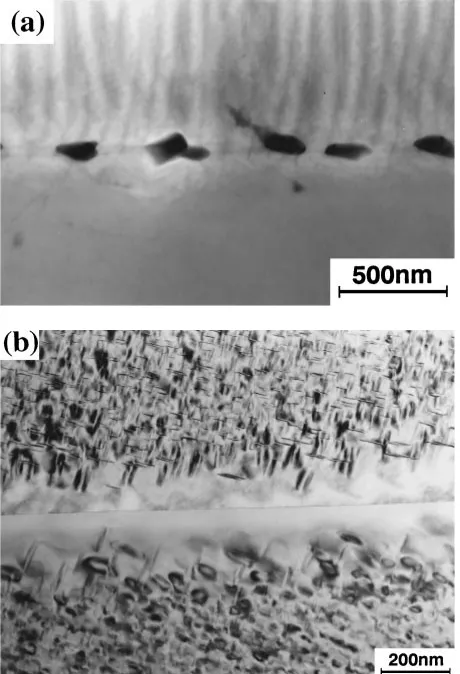
Figure 1 shows microstructures observed using the con-ventional TEM from the specimens (a) aged at 523 K for 1.8 ks (0.5 h) and (b) aged at 453 K for 25.2 ks (7 h). For the
former specimen, particles of a stable phase (Al2Cu) are
visible on the grain boundary with dark contrasts but few particles are present within the grains. It should be noted that the striped contrasts visible in the upper grain were formed during the process of electropolishing for TEM. The latter specimen contains many particles which were identified as metastable 0 (Al
2Cu) precipitates through an electron
diffraction analysis. A PFZ is also clearly visible around the grain boundary. Although the number was very limited, the formation of the stablephase particles was confirmed on some parts of grain boundaries.
X-ray mapping was carried out in the STEM mode for the specimen shown in Fig. 1(a). The results obtained with the Cu Kline and the Al Kline are given in Figs. 2(a) and (b), respectively. Brighter dots represent more inclusions of Cu and Al. With reference to the STEM image observed before the X-ray mapping, Cu-enriched regions and Cu-depleted regions lie along the grain boundary and the former regions correspond to thephase particles. Depletion of Al is visible at the regions where thephase particles are present.
Figure 3 shows (a) an annular dark-field (ADF) image taken in the STEM mode, (b) a Cu Kintensity map and (c) an Al Kintensity map for the specimen shown in Fig. 1(b). In Fig. 3(a), the bright contrasts correspond to Cu-enriched regions and thus, in consistence with the microstructures shown in Fig. 1(b), there are many Cu-enriched0 particles
with elongated shapes. These particles are not present in the vicinity of the grain boundary, thereby indicating the formation of PFZ. The Cu depletion associated with the PFZ is more clearly demonstrated in Fig. 3(b) by the X-ray mapping using the Cu K line, which was taken from the same region as Fig. 3(a). It is apparent that the grain boundary and its vicinity contain less numbers of bright dots. From the Al Kintensity map shown in Fig. 3(c), bright dots are distributed homogeneously throughout the scanned area and there is no region devoid of bright dots along the grain boundary. This indicates that neither depletion of Al nor preferential etching of the sample occurred along the grain boundary.
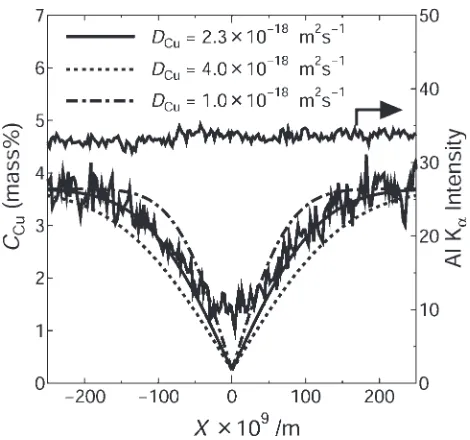
The rectangles are selected as shown in Figs. 2(a) and (b) and the Cu Kand Al Kintensities within the rectangles are integrated in the direction parallel to the grain boundary. These integrated intensities are then plotted in Fig. 4 along the long axes with the position of the grain boundary taken as the origin. Here, the Cu Kintensities are converted to the concentration of Cu by considering the fact that the characteristic X-ray intensity is linearly related to the weight fraction of a constituent element when the X-ray absorption is negligibly small and an analyzed area has an equal thickness. For this study, the absorption of the Cu Kline is less than 1% in the Al–3.7 mass%Cu alloy and the condition of an equal thickness has been fulfilled because the Al Kline has a constant intensity throughout the rectangle. Note that the absorption of the Al Kline is less than 10% in the sample with the thickness up to 600 nm. To determine the propor-tional constant between the Cu K intensity and the Cu concentration, the intensities sufficiently apart from the grain boundary was equated to 3.7 mass% from the equilibrium concentration for Cu. The Cu concentration decreases towards the grain boundary and takes a minimum at the
Fig. 1 TEM micrographs of the specimens (a) aged at 523 K for 1.8 ks (0.5 h) and (b) aged at 453 K for 25.2 (7 h).
[image:2.595.55.285.418.755.2]boundary. The concentration profile is symmetrical with respect to the grain boundary position.
The diffusion coefficients of Cu in the Al–3.7 mass%Cu alloy,DCu, may be determined from the concentration profile measured across the grain boundary through the following Grube equation.7)
CðxÞ ¼C0þ ðC1C0Þerf x 2 ffiffiffiffiffiffiffiffiffiffiDCut
p
ð1Þ Fig. 3 (a) an annular dark-field (ADF) image, (b) a Cu Kline map and (c) an Al Kline map for the specimen aged at 453 K for 25.2 ks (7 h) shown in Fig. 1(b). The rectangles indicate areas where the X-ray intensities are integrated.
Fig. 4 A concentration profile and a variation of the Al Kline obtained from the integration of the X-ray intensities within the rectangular areas shown in Figs. 2(a) and (b) for the specimen aged at 523 K for 1.8 ks (0.5 h). The solid line represents the best-fit curve for the profile delineated withDCu¼2:31018m2s1. The two different dotted lines represent the curves delineated with DCu¼4:01018m2s1 and 1:0
1018m2s1 and they correspond to the upper and lower limits of diffusion coefficient obtained from the best-fit curve.
[image:3.595.312.543.65.598.2] [image:3.595.54.287.72.425.2] [image:3.595.52.287.479.699.2]whereCðxÞis the Cu concentration at the position ofxfrom the grain boundary,C0is the equilibrium Cu concentration at
the aging temperature,C1is the Cu concentration sufficiently
away from the grain boundary, x is the distance from the grain boundary,tis the aging time and erf represents the error function. For the determination ofDCu, Doig and Edington1)
used the condition of erfð1Þ ’0:84 and measured the distance between the grain boundary and the point in the profile corresponding to ðCðxÞ C0Þ=ðC1C0Þ ¼0:84. In this study, however, the value of DCu was determined by fitting eq. (1) to the profile.
For the present alloy, C1 ¼3:7mass% and for the concentration profile given in Fig. 4 obtained after aging at 523 K for 0.5 hours, it follows that t¼1:8ks and it is
estimated from the equilibrium phase diagram that
C0¼0:25mass% at 523 K.3) The solid line represents the best-fit curve for the profile with DCu¼2:31018m2s1.
Two curves are also delineated in Fig. 4 using two different dotted lines with DCu¼4:01018m2s1 and 1:0
1018m2s1. Although the overall profile involves local
zigzag variations of the Cu concentration, such variations fall well within the two dotted curves. Therefore, it is suggested that the corresponding diffusion coefficients may give upper and lower limits of the diffusion coefficient obtained from the best-fit curve.
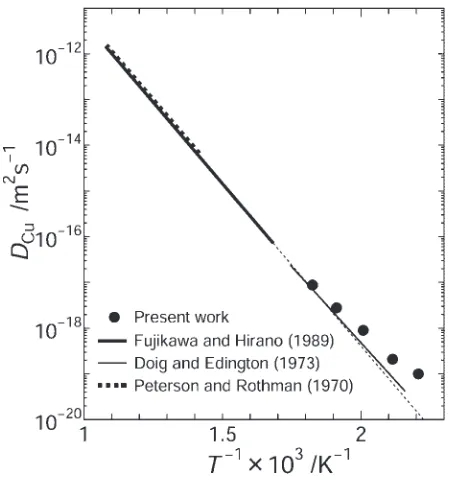
The same procedure was also taken for the determination of diffusion coefficients from the specimens aged at other temperatures and they are plotted in Fig. 5 against the reciprocal temperature. For comparison, Fig. 5 includes impurity diffusion coefficients of Cu in Al published earlier by Peterson and Rothman8) and Fujikawa and Hirano.9) However, the reported data are limited in higher temperature regions as drawn with thick dotted line and thick solid line, respectively, and thus, the relations are extrapolated with fine
dotted line to a lower temperature region covered in this study. Further included in Fig. 5 are the results of Doig and Edington1) obtained at a low temperature range from the analysis of solute profiles across the grain boundary. It is apparent that the diffusion coefficients obtained at higher temperatures in this study stay close to the extrapolated line and the line of Doig and Edington but the present data points deviate gradually from the published results with decreasing the temperature. This deviation reaches almost one order of magnitude at 453 K. The reason for this deviation will be discussed in the later section.
Figure 6 shows the Cu concentration profile and the variation of the Al Kintensity obtained after aging at 453 K for 25.2 ks (7 h). They are drawn from the integration of the Cu Kintensity and the Al Kintensity in the rectangular areas shown in Figs. 3(b) and (c) in the same way as described above. The solid line represents the best-fit curve for the concentration profile whereas the dotted curve is delineated using the diffusion coefficient extrapolated from the high-temperature region to 453 K. It is apparent that the dotted line is far beyond the fitting even if the local zigzag variations are taken into consideration. The constant varia-tion of the Al Kintensity indicates that the Cu depletion is not due to the preferential etching at the grain boundary.
The concentration profile obtained after aging at 453 K for 25.2 ks (7 h) is again shown in Fig. 7 but it is now given as a function of Boltzmann parameter, (¼xt1=2), instead of
distance,x. This is to plot with the profile obtained after aging at 453 K for 10.8 ks (3 h) and to examine any effect of the aging time on the profiles. Despite the fact that the aging time is different by more than a factor of 2, there is no appreciable difference between the two profiles. This plot indicates that the Cu diffusion to the grain boundary occurs in the manner
Fig. 5 The diffusion coefficients of Cu in the Al–3.7 mass%Cu plotted against the reciprocal temperatures. The published data are included from the results of Doig and Edington,1)Peterson and Rothman8)and Fujikawa and Hirano.9)
Fig. 6 A concentration profile and a variation of the Al Kline obtained from the integration of the X-ray intensities within the rectangular areas shown in Figs. 3(b) and (c) for the specimen aged at 453 K for 25.2 ks (7 h). The solid line represents the best-fit curve for the profile delineated with
DCu¼1:01019m2s1 and the dotted line represent the curves delineated withDCu¼1:81020m2s1obtained from the extrapola-tion of the published relaextrapola-tion to 453 K.
[image:4.595.308.544.487.709.2] [image:4.595.57.284.500.740.2]independent of the aging time and the higher diffusion coefficients obtained at lower temperatures are not due to the difference in the aging time.
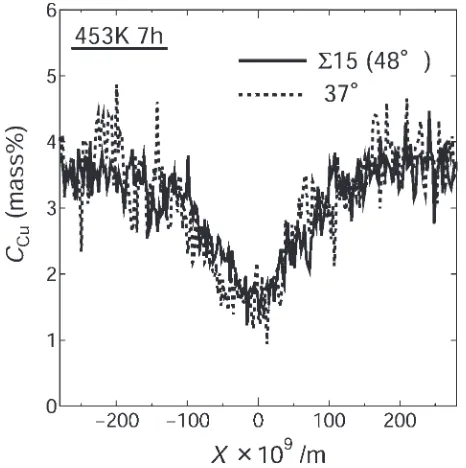
The concentration profile after aging at 453 K for 25.2 ks (7 h) shown in Fig. 6 is further plotted in Fig. 8 together with another profile obtained from a different grain boundary in the same aged specimen. The misorientation angle for the former grain boundary is 37 degrees and that for the latter is 48 degrees. Although both boundaries are of high-angle grain boundaries, the latter corresponds to a15coincidence site
boundary10) whereas the former is a complete random boundary. There is no difference in the profile between the two boundaries despite the difference in the grain boundary character. This result indicates that the Cu diffusion is not affected by the grain boundary character.
A comparison is also made in Fig. 9 for the concentration profiles measured across three different grain boundaries having misorientation angles of 2, 12 and 56 degrees in a specimen aged at 473 K for 7.2 ks (2 h). According to the conventional grouping for low-angle and high-angle bound-aries, the former two boundaries belong to low-angle boundaries and the latter boundary to a high-angle boundary. A detailed analysis showed that the latter boundary is also equivalent to a3concidence site boundary. The formation ofphase particles were confirmed on all boundaries but the formation was more continuous for the 2-degree boundary. The concentration profiles were measured at positions between two neighboring particles on the boundaries. There is no significant difference between the profiles for the 12-degree boundary and the 56-12-degree boundary, both having appreciable depletions of Cu at and near the boundaries. However, no appreciable Cu depletion was detected for the 2-degree boundary and thus, its concentration profile is significantly different from the others. It is considered that the Cu diffusion across the low angle boundary occurs in essentially the same manner as in the lattice due to no significant change in lattice alignment.
4. Discussions
The measurements of concentration profiles across the grain boundaries after aging of the Al–3.7 mass%Cu alloy at lower temperatures has led to a deviation of the diffusion coefficients above the line extrapolated from a high tem-perature range reported in the literature. This deviation was
−2 −1 0 1 2
0 1 2 3 4 5 6
λ
10
9/m s
−1/2C
Cu(mass%)
453K 7h
453K 3h
Fig. 7 Concentration profiles obtained after aging at 453 K for 10.8 ks (3 h) and 25.2 ks (7 h) shown as a function of Boltzmann parameter, (¼xt1=2).
Fig. 8 Concentration profiles obtained after aging at 453 K for 25.2 ks (7 h) from two different grain boundaries having the misorientation angles of 37 degrees and 48 degrees. The latter corresponds to a15coincident site boundary.
Fig. 9 Concentration profiles obtained after aging at 473 K for 7.2 ks (2 h) from three different grain boundaries having the misorientation angles of 2 degrees, 12 degrees and 56 degrees. The latter corresponds to a 3
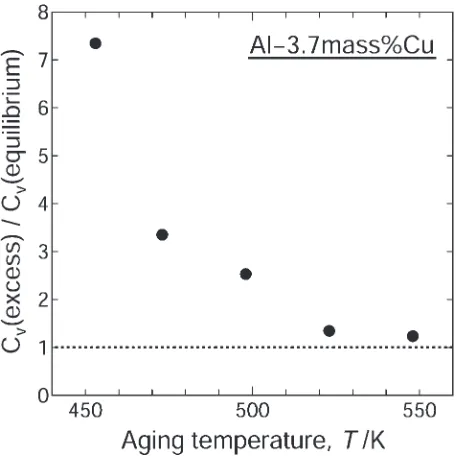
[image:5.595.311.542.70.306.2] [image:5.595.58.284.72.305.2] [image:5.595.53.286.505.739.2]more pronounced with decreasing aging temperature. It is considered that the deviation to higher values is attributed to the presence of excess vacancies formed by rapid quenching following solution treatment. Provided that the enhancement of the diffusion coefficient is due to the presence of excess vacancies, it may be possible to evaluate a variation of the excess vacancy concentration with respect to the aging temperature. It is well established that atom diffusion occurs through exchange of atom sites with vacancies. Since the diffusion coefficient is given by a linear function of vacancy concentration,11)the ratio of the measured diffusivity to the extrapolated value, D(measured)/D(extrapolated), becomes equivalent to the ratio of the excess vacancy concentration to the equilibrium vacancy concentration,CV(excess)/CV
(equi-librium). This ratio is then plotted in Fig. 10 against the aging temperature. The quenched-in excess vacancies are more present as the aging temperature decreases but they are annihilated and the vacancy concentration approaches to the equilibrium vacancy concentration when the aging tempera-ture is higher.
In Fig. 5, the diffusion coefficients reported by Doig and Edington1) lie well on the line extrapolated from the high temperature range and this result is different from the present one. Doig and Edington1) determined the diffusion coeffi-cients from the concentration profiles across grain boundaries in an Al–4 mass%Cu alloy after aging at a temperature in the range from 463 to 573 K. The procedure for the diffusivity determination is very similar to the one employed in this study except that Doig and Edington1)used the condition of erfð1Þ ’0:84 rather than fitting eq. (1) to the profile. However, the more important difference is that the alloy used in their experiments was subjected to quenching to 573 K for 60 s. after solution treatment at 813 K but before quenching into iced water. This step quenching should have been effective in removing excess vacancies and resulted in good agreement with the extrapolated line.
The present study has clearly demonstrated that there is no difference in the concentration profile if the misorientation angle is larger than a few degrees. It has also been demonstrated that the grain boundary character does not affect the concentration profile. These results are well consistent with the earlier reports of Unwin et al.12) and Cornish and Day13)for the measurements of PFZ widths after aging of Al–Zn–Mg alloys. The present experiment con-cludes that the Cu diffusion towards the grain boundary during the aging process of the Al–3.7 mass%Cu alloy is influenced by the excess vacancy concentration but it is not by the boundary character and misorientation angle unless the angle is less than a few degrees.
5. Summary and Conclusions
(1) The diffusion coefficients of Cu in an Al–3.7 mass%Cu alloy were determined from the concentration profiles measured across grain boundaries after aging at selected temperatures in the range from 453 to 548 K. A high-spatial-resolution analytical electron microsco-py was applied for this determination.
(2) The determination of the diffusion coefficients included X-ray mapping, integration of the X-ray intensities, construction of concentration profiles and fitting the Grube equation to the profiles.
(3) The diffusion coefficients tended to deviate to higher values above the line extrapolated from the relationship available in a high temperature range published in the literature. This deviation was more pronounced as the aging temperature is decreased. It was considered that this deviation is attributed to the presence of excess vacancies formed after rapid quenching following solution treatment.
(4) The concentration profiles and thus the resultant diffusion coefficients were affected by neither grain boundary character nor by the grain boundary misor-ientation angle except for the grain boundary having the angle of less than a few degrees.
Acknowledgements
[image:6.595.55.288.71.299.2]One of us (TF) is grateful for the JSPS Research Fellow-ships for Young Scientists. This study was conducted as a part of the Nano-Metals Project coordinated by the Japan Research and Development Center for Metals (JRCM) having a support from the New Energy and Industrial Technology Development Organization (NEDO). This study was also supported by the Light Metals Educational Foundation of Japan and by the Japan Aluminum Associa-tion. We used a JEM-2010FEF analytical electron micro-scope in the HVEM Laboratory of Kyushu University. Our thanks are also to Prof. Syo Matsumura of Kyushu University for providing the X-ray spectral-imaging system installed through the Special Coordination Funds for Promoting Science and Technology on ‘‘Nanohetero Metallic Materi-als’’ provided by the Ministry of Education, Culture, Sports, Science and Technology.
Fig. 10 Ratio of excess vacancy concentration to equilibrium vacancy concentration plotted against aging temperature.
REFERENCES
1) P. Doig and J. W. Edington: Philos. Mag.28(1973) 961–970. 2) A. W. Nicholls and I. P. Jones: J. Phys. Chem. Solids44(1983) 671–
676.
3) J. R. Michael and D. B. Williams:Int. Symp. on Interface Migration and Control or Microstructure, ASM’s Metals Congress and TMS/ AIME Fall Meeting, (American Society for Metals, Metals Park, OH, 1984) p. 1–9.
4) D. R. Frear, J. E. Sanchez, A. D. Romig, Jr. and J. W. Morris, Jr.: Metall. Trans.21A(1990) 2449–2458.
5) D. B. Williams and J. W. Edington: J. Electron Microscopy108(1976) 113–145.
6) S. Zaefferer: J. Appl. Cryst.33(2000) 10–25.
7) L. S. Darken and R. W. Gurry:Physical Chemistry of Metals, (McGraw Hill, New York, 1953).
8) N. L. Peterson and S. J. Rothman: Phy. Rev.B1(1970) 3264–3273. 9) S. Fujikawa and K. Hirano: Defect and Diffusion Forum66–69(1989)
447–452.
10) W. Bollmann:Crystal Defects and Crystalline Interfaces, (Springer-Verlag, New York, 1970).
11) P. G. Shewmon:Diffusion in Solids, (McGraw-Hill, New York, 1963) p. 40.
12) P. N. T. Unwin, G. W. Lorimer and R. B. Nicholson: Acta Metall.17
(1969) 1363–1377.