Effect of Austempering Duration on Erosion Wear Resistance of
ADI by Al
2O
3Particle
Fei-Yi Hung
*, Li-Hui Chen and Truan-Sheng Lui
Department of Mechanical Engineering, National Ping-Tung University of Science and Technology, Ping-Tung, 91201 Taiwan, R. O. China
Effect of the duration of austempering on particle erosion wear resistance of ADI was studied. In short duration (Stage I) region, a fair amount of martensite phase can be recognized, and hence deterioration of erosion wear resistance. In initial Stage II, the austempering region (0.5 hr duration) is free of carbide. If prolonged the austempering duration, the retained austenite amount tend to decrease and hence carbide formation. Even if slightly increase of carbide amount that still can play an important role on debasing wear resistance, resulted from the alternation of erosion behavior. Erosion-induced phase transformation of retained austenite also can be determined that is generality transformed to"-carbide.
(Received June 3, 2003; Accepted September 1, 2003)
Keywords: austempered ductile iron (ADI); Al2O3 particles; erosion; "-carbide; spheroidal graphite cast iron; retained austenite,
transmission electron microscopy (TEM)
1. Introduction
Austempered ductile iron (ADI) encounters particle erosion when it is used in many facilities such as farming tool, blast machine parts, and automatic sand molding
equipment parts.1–4) Reports on the erosion wear of cast
irons indicated that erosion resistance can be improved
through heat treatment.1–6) However, relatively few studies
relating to the effect of austempering duration on erosion
resistance of ADI regarding the investigation of Al2O3
particle erosion can be found readily.1,2,6)Generally,
increas-ing the silicon content in ADI at the given temperature and austempering duration will increase the amount of retained
austenite and suppress the carbide formation.2)However, the
condition must be very precise or otherwise a transformation of retained austenite phase will occur. The effect of silicon content on the mechanical properties and erosion resistance
has been clarified in many previous reports on ADI.1–6)
Therefore, the application of ADI must have controlled the silicon content and retained austenite content to improve the
fracture toughness.2) In this investigation, the erosion
mechanism of Stage I and Stage II ADI with the same chemical composition by varying systematically austemper-ing duration is required to recognize.
2. Experimental Procedure
The carbon content of each sample was controlled at about 3.5 mass% and the Si content was 2.82 mass% that this is a eutectic composition found in a conventional analysis for ADI. Table 1 shows the chemical composition of specimens. Each sample were melted in a 100 Kg high frequency induction furnace. Metallic Si was added to adjust the Si content of each specimen. The melts were cast into a
Y-shaped CO2 sand mold after innoculation and
spheroidiza-tion. The specimens were air cooled to room temperature. In the current investigation, all samples can be verified as a typical ‘‘upper bainitic matrix’’ which will be referred by the coding names of ‘‘UB duration’’ as shown in Table 2.
[image:1.595.47.549.647.734.2]The ADI samples were held at a constant temperature of 1203 K for 1 hour. Then, the samples were rapidly soaked in a salt bath under a constant austempering temperature of
Table 1 Chemical composition of the austempered ductile iron (ADI), in mass%.
C Si Mn P S Mg Fe
ADI 3.45 2.82 0.061 0.032 0.019 0.041 Bal.
Table 2 Mechanical properties vs. quantitative data (before erosion test).
ADI Y.S.(MPa) UTS(MPa) El(%) HRC R.A. (vol.%) M. (vol%) Stage
UB5 min 675 1027 11.6 25 8.1 34.6 I
UB15 min 751 1086 16.5 29 18.2 15.4 I
UB0.5 hr 790 1104 14.7 26 29.4 — II
UB1 hr 817 1130 10.5 27 27.2 — II
UB2 hr 835 1145 8.8 29 16.8 — II
UB3 hr 860 1194 7.8 31 2.1 — II
UTS: ultimate tensile strength (MPa), Y.S.: yield strength (MPa), El(%): elongation, HRC: rockwell hardness, R.A. (vol%): the amount of retained austenite before erosion, M. (vol%): the amount of martensite.
*Corresponding author, E-mail: [email protected] 2003 The Japan Institute of Metals
693 K. The six different austempering duration of the ADI samples were 5 min, 15 min, 0.5 hour, 1 hour, 2 hours, and 3 hours, finally the ADI samples were water cooled to room temperature. The code corresponding to each sample is listed in Table 2.
A sandblasting type erosion tester was used. Figure 1(a) shows a schematic of the test rig. Commercial grade No. 5
Al2O3 sand was selected as the erodent. (The size and the
fraction of mass of Al2O3 particle were listed in Table 3.
Using the Table 3, the average particle size was estimated as
275mm.) As illustrated in Fig. 1(b), Al2O3particles possess
both angular and irregular shapes. They were ejected by a
compressed air flow of 3 kg.cm 2 pressure (0.29 MPa), the
flow capacity of the erosion particles was 1 g s 1, impacting
the test specimen with a specific impact angle (which isin
Fig. 1(a)) in a range between 15 (oblique impact) and 90
(normal impact). This was referred to as the erosion direction, shown as an arrow ‘‘ED’’ in the following figures. In addition, using single-shot high-speed photography, the
average particle velocity was estimated as 73 m s 1.2,6)
The mass loss caused during the erosion test was measured using a microbalance of 0.01 mg accuracy. Before weighing, the specimens were ultrasonically cleaned in acetone. The time period of each erosion test was 9 min, within which
500 g Al2O3, particles were ejected. The wear surface and
subsurface morphologies were observed with SEM. For subsurface observation, the worn specimens were carefully sectioned along the surface normal direction.
Besides the above experiment, a single-particle erosion test was also performed. The specimens in this test were pre-polished with No. 800-grit SiC paper to achieve an identical initial condition and slightly pre-etched in 3% nital. They were eroded by a total mass of about 1 g of solid particles. The surface morphologies after the single-particle erosion test were similar to those of a real eroded surface. The appearances of lips, grooves, pits and concaves are clearly visible after the single-particle erosion test. The wear features not only are used for measuring the length of grooves and the amount of lips but also help to analyze the wear mechanisms. Each erosion rate datum was the average of at least three test results in this experiment. The phase constitution of the
specimen were checked by X-ray diffraction (Cu K), an
image analyzer, SEM and TEM.
3. Results
3.1 Verification of the microstructure and tensile prop-erties of ADI samples
Three typical optical microstructures of ADI are shown in Fig. 2, the effect of austempering duration can be recognized through a significant difference on austenite retained. Relationship between the volume fraction of retained austenite and mechanical properties for ADI are represented in Table 2. As revealed in this table, the amount of the retained austenite initially exhibited a tendency to increase up to 29.4%, then decreases from the maximum value as the austempering duration increases. However, the samples can be divided into two groups, as Stage I ADI group, which coding UB5 min and UB15 min, and the Stage II ADI, which include the samples coding UB0.5 hr, UB1 hr, UB2 hr and
UB3 hr.7,8) From the data as shown in Table 2, the overall
tensile property response can be correlated with the differ-ences of retained austenite. As expected, the yield strength of ADI increases as the austempering duration increased. The lower retained austenite in Stage II region results in lower tensile elongation. The X-ray, an image analyzer and Fig. 2 also exhibit a strong microstructural dependence as shown in Table 2 that the martensitive transformation can be detected in the Stage I ADI specimens (UB5 min and UB15 min).
3.2 Erosion rate
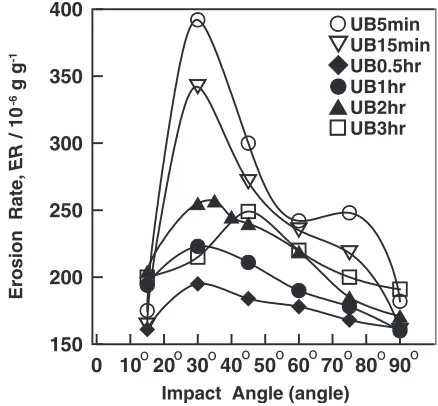
The relation between impact angle and erosion rate of ADI
blasted under an average particle velocity of 73 m s 1 are
(a)
(b)
Fig. 1 (a) Schematic drawing of the erosion test rig (A: compressed air flow, B: erodent supplier, C: erodent nozzle, D: specimen, E: specimen holder, P: pressure gauge,: impact angle): (b)SEM photo of the Al2O3
[image:2.595.57.284.70.486.2]particles.
Table 3 The particle size and fraction of mass of Al2O3particle.
Mesh number #40 #50 #60 #70
[image:2.595.47.292.758.786.2](a)
(b)
(c)
Fig. 2 Optical microstructure of ADI specimens: (a) UB5 min, (b) UB0.5 h, (c) UB3 h.
0 10 20 30 40 50 60 70 80 90 Impact Angle (angle) 150
200 250 300 350 400
Erosion Rate,
ER
/ 10
-6 g g
-1
o o o o o o o o o
UB5min UB15min UB0.5hr UB1hr UB2hr UB3hr
Fig. 3 Effect of austempering duration and erosion impact angle on erosion rate of ADI.
(a)
(b)
Fig. 4 Wear surface morphologies: (a) UB5 min-30impact, (b) UB5
[image:3.595.57.280.68.721.2] [image:3.595.316.535.75.278.2] [image:3.595.315.538.342.758.2]plotted in Fig. 3. Comparing the data of the Stage I ADI (UB5 min and UB15 min), the erosion rate tended to decrease as the austempered duration increased. On the other hand, the erosion rate of the Stage II ADI also increased as the
austempering duration increased. It should be noted that the UB0.5 hr specimen is the most erosion resistant among all other ADI specimens. Although Figure 3 reveals that the impact angle of maximum erosion rate is commonly at
3045for all materials, whereas it is important to note that
a double peak curve of erosion rate curve can be recognized in Stage I sample (UB5 min).
3.3 Morphologies of erosion wear surface and subsur-face
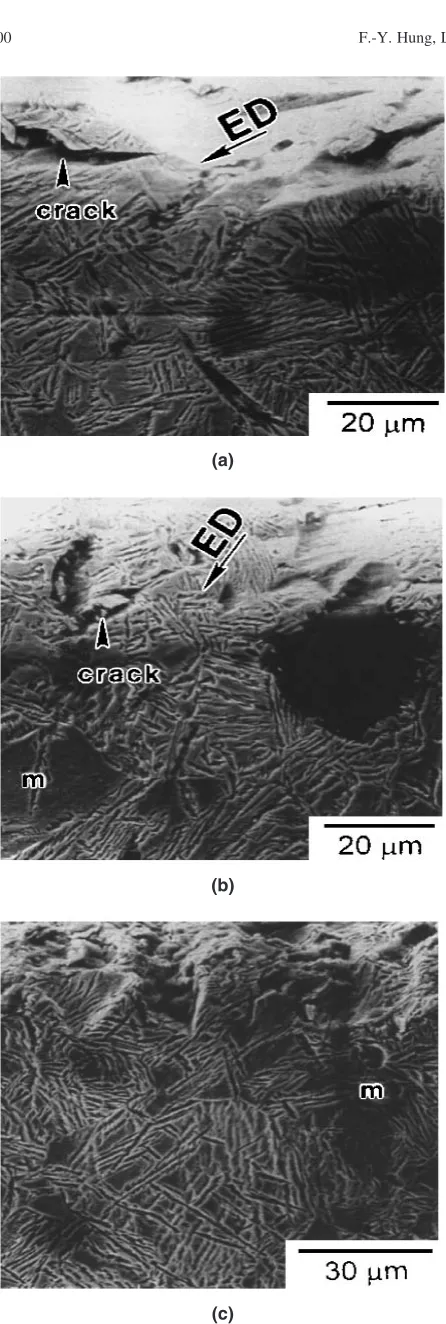
The wear surface morphologies of the Stage I ADI as shown in Figs. 4(a) and (b) reveal a typically brittle fracture feature. Figure 5 illustrate a subsurface feature of UB5 min
specimen eroded under 30, 75 and 90 impact angle. As
depicted, erosion cracks of the materials can be distinguished from the beading of near-surface. UB5 min and UB15 min specimens with an identical erosion test condition, much more cracks can be observed on the wear surface and subsurface. Figure 5 also represents meaningful evidence that the martensite phase precedes the retained austenite phase for crack initiation during erosion test.
(a)
(b)
(c)
Fig. 5 Subsurface observation: (a) UB5 min-30impact, (b) UB5 min-75
impact, (c) UB5 min-90impact (ED: erosion direction).
50
µ
m
(a)
50
µ
m
(b)
Fig. 6 Wear surface morphologies: (a) UB0.5 h-30impact, (b) UB0.5
[image:4.595.57.280.35.697.2] [image:4.595.315.539.72.482.2](a) (b)
Fig. 7 Subsurface observation: (a) UB0.5 h-30impact, (b) UB0.5 h-90impact (ED: erosion direction).
(a)
50
µ
m
(b)
Fig. 8 Wear surface morphologies: (a) UB3 h-30impact, (b) UB3 hr-90impact (ED: erosion direction).
(a) (b)
[image:5.595.80.518.72.278.2] [image:5.595.73.524.310.526.2] [image:5.595.67.531.554.769.2]The wear feature of UB0.5 hr and UB1 hr are similar as shown in Fig. 6, many larger lip formations can be
recognized under 30 oblique impact (Fig. 6(a)). In Fig.
6(b), many erosion cave-in pits were found under 90normal
impact. Figures 7(a) and (b) illustrate the subsurface feature
of UB0.5 hr specimen eroded under 30 and 90 impact.
Grooves on the material were found and no marked erosion cracks existed on the subsurface. The implication is that the effect of retained austenite amount is more pronounced on erosion resistance, the variation of retained austenite actually affects the wear mechanism.
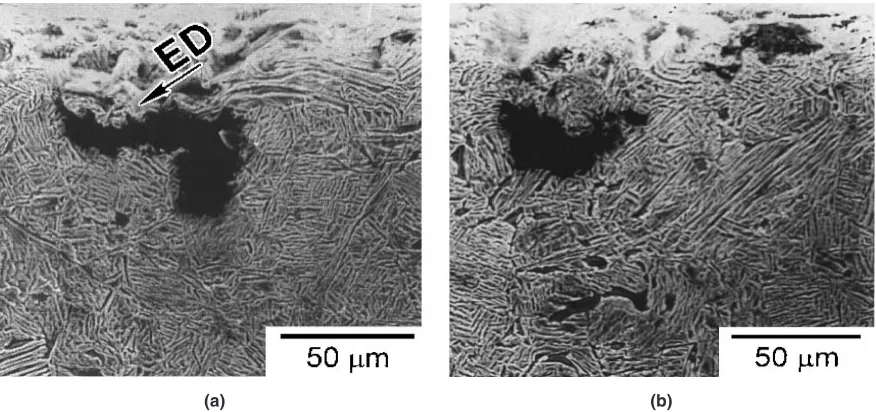
Wear surface of the UB3 hr specimens (Final Stage II) are shown in Fig. 8. Figure 8(a) reveals little evidence of lip
formations under oblique impact (30). Although the UB3 hr
specimens exhibit the wear behavior of brittle fracture mode, and a number of the erosion cracks can be observed especially when eroded under a large-angle impact (Fig. 8(b)). Figure 9(a) illustrate a wear feature examined from the
subsurface of UB3 hr specimen eroded under 30impact, the
metal flow is along the erosion direction, a number of erosion cracks also can be observed from this aspect. On the other
hand, when the impact angle is 60, the typical evidence
confirms that a number of erosion cracks in wear subsurface
were shown in Fig. 9(b). However, the wear behavior of UB3 hr specimen should be correlated with the microstruc-tural changes due to the fact that austempering duration have been prolonged in the cases.
3.4 Erosion induced phase transformation
In order to clarify the effect of erosion induced phase transformation, the microstructure of Stage I ADI and Stage II ADI were examined by TEM before erosion test. A great amount of martensite phase (Table 2) rather than retained austenite phase can be confirmed before the erosion test in Stage I ADI, and the evidence as shown in Fig. 10.
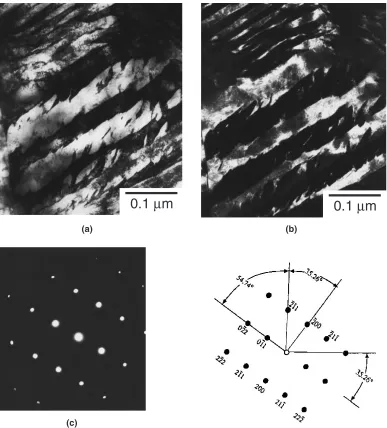
On the other hand, based on the TEM analysis of Stage II specimen (UB0.5 hr) as represented in Fig. 11, which is the most wear resistant sample, revealed that is free of carbides in the matrix before erosion test. X-ray diffraction patterns of
the as-austempered and 90-impacted specimens are
illus-trated in Figs. 12(a) and (b), respectively. Regardless of the austempering condition, no carbide peaks can be discerned from Fig. 12(a). As a consequence, Fig. 12(b) confirms the
formation of"-carbide during the particle impingement. The
volume contents of retained austenite, which were measured
after the Stage II ADI had been eroded by 90 impact as
(a) (b)
[image:6.595.108.487.71.468.2](c)
0.1
µ
m
0.1
µ
m
(b) (a)
[image:7.595.105.492.70.498.2](c)
Fig. 11 Transmission electron micrograph and SADP from Initial Stage II (UB0.5 h) specimen: (a) BF image, (b) DF image and (c) SAED pattern of the (011) zone’s of ferrite in (a).
30 40 50 60
2θ (degree)
Intensity
UB0.5hr
UB1hr
UB2hr
UB3hr
α- (101) 43o γ- (111) 43o α- (110) 45o γ- (220) 51o
O O O O
(a)
30 40 50 60
2θ (degree)
Intensity
ε−carbide (100) 37o
ε−carbide (101) 43o
ε−carbide (102) 57o UB0.5hr
UB1hr
UB2hr
UB3hr
O
O O O
(b)
[image:7.595.76.519.538.767.2]shown in Fig. 13. For comparison, the data of the as-austempered specimens shown in Table 2 are also plotted in this figure. It can be seen from the figure that the erosion will cause substantial amount of the retained austenite to trans-form.
TEM analysis of UB0.5 hr specimen after erosion test as represented in Fig. 14, this evidence can be used to confirm that"-carbides precipitating along the boundaries of lath-like ferrite grains result in a deterioration of wear resistance. TEM data and X-ray diffraction patterns (see Fig. 12) revealed that there was no sign of martensite in the matrix of Stage II ADI after the erosion test.
4. Discussion
The maximum erosion rate of a ductile metal usually
occurs at an oblique impact angle roughly between 2030
when its erosion behavior is governed by ductile mechanisms such as lip. When the erosion of a brittle solid is governed by brittle cracking, its maximum erosion rate usually occurs at
90 normal. For many engineering alloys, the superposed
effect of ductile and brittle wear mechanism frequently the maximum erosion rate to occur at some mid-angle impact.
carbide
0.1
µ
m
0.1
µ
m
(a) (b)
[image:8.595.307.509.69.300.2](c)
Fig. 14 Transmission electron micrograph and SADP of UB1 h specimen after erosion test: (a) BF image, (b) DF image and (c) SAED pattern.
0.0 0.5 1.0 1.5 2.0 2.5 3.0 3.5
Austempered Time,
T
/ h
0 5 10 15 20 25 30 35
Volume Contents of Retained
Austenite,
Vol % R.A.
/
%
29.4 27.2
16.8
2.1 13.1
10.2
4.3
0
as-austempered
[image:8.595.64.285.77.756.2]90o-eroded
ED
[image:9.595.73.526.71.285.2](a) (b)
Fig. 15 Single-particle wear surface morphologies: (a) UB5 min-30impact, (b) UB5 min-90impact (ED: erosion direction).
(a) (b)
[image:9.595.72.526.319.521.2]20
µ
m
50
µ
m
Fig. 16 Single-particle wear surface morphologies: (a) UB0.5 h-30impact, (b) UB3 h-30impact (ED: erosion direction).
Impact Angle (degree)
Er
osion Rate
Stage I with martensite
Stage II without martensite
Impact Angle (degree)
Erosion Rate
Stage II - high carbide vol.%
Stage II - low carbide vol.%
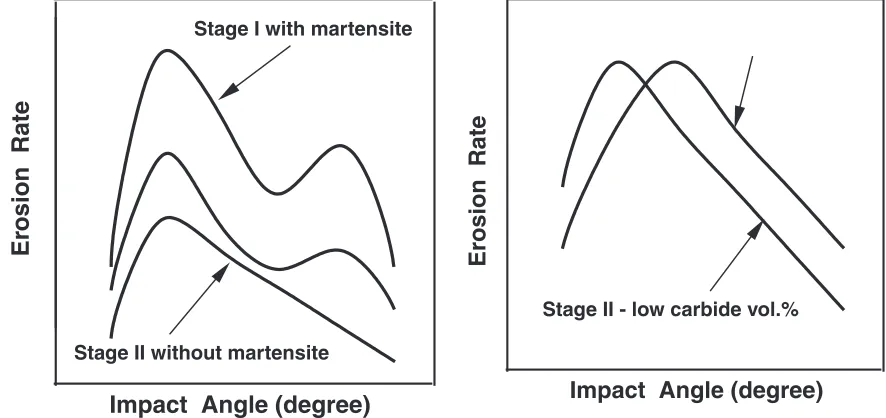
[image:9.595.75.518.558.767.2]If the erosion behavior of the materials is ductile-mechanic, the maximum erosion rate to occur at low-angle impact (Initial Stage II ADI: the peak-angle of UB0.5 and
UB1 hr is 30 as shown in Fig. 3). When the erosion
behavior of the materials is ductile-mechanic to change brittle-mechanic, the angle of the maximum erosion rate will shift to larger impact angle (see Fig. 3, Finial Stage II ADI:
UB2 hr is 35 and UB3 hr is45) or produce the wear
curve of double peak (Stage I ADI: UB5 min, 30 and
75). In the same erosion-condition, the variation in matrix
of the specimen will change the peak angle of erosion wear curve. This study reveals the variation in the austempered duration of ADI to change the type of erosion wear curve.
Based on a single-particle erosion test results, that are only
impacted 1 g of Al2O3particles for the sake of convenience to
examine the wear tracks. A typical track of UB5 min after 30
single-particle erosion as shown in Fig. 15(a). As revealed in this figure, the plastic deformation (grooves) on the erosion surface clearly can be discerned under an oblique impact. Figure 15(b) indicates that it is a cave-in pit of martensite phase. Based on the results of Fig. 4, Fig. 5, and Fig. 15, a specimen containing martensite phase (Stage I ADI) will exhibit a wear feature showing a complex mode of both
ductile and brittle wear behavior.2) Experimental results as
shown in Fig. 3 have confirmed that the UB5 min sample typically exhibit a double peak dependency on the erosion impact angle. This phenomenon should be correlated with the existence of martenite phase. That can be considered as one of the reasons for the specimen showing a lower erosion resistance.
In order to investigate the effect of microstructural changes on erosion wear resistance of Stage II ADI, a general comparison was made by single-particle erosion test. The UB0.5 hr specimen possesses better wear resistance than UB3 hr (see Fig. 3). From the evidences as shown in Fig. 16, a great number of lip formations can be observed in the UB0.5hr specimen but the wear surface of the UB3 hr specimen did not reveal obvious lip mechanism under
oblique impact (30). It should be noted that the matrix of
UB0.5 hr possesses a maximum amount of retained austenite as compared to the other samples (see Table 2), and hence
possessed better erosion resistance.7)On the other hand, even
though only a little carbide existed in the UB3 hr specimen before erosion test, a significant deterioration in the wear resistance can be recognized. That is likely to have resulted from the deterioration of ductility and the erosion cracks can be easily produced. This result showed that prolonged the austempering duration, the retained austenite amount tend to decrease and hence carbide formation. In addition, the carbide promoted the hardness of matrix and induced the erosion crack to decrease erosion resistance during erosion process.
Based on Fig. 3 and Fig. 13, the impact angle of maximum
erosion rate is 30 for the initial stage II ADI with
27vol.% retained austenite. This angle is close to those
observed in ductile erosion of metals. For the other two stage
II ADI specimens, brittle cracking can be found after 90
impact. The smaller the content of retained austenite, the severer the cracking. Consequently, the angle of maximum
erosion rate increases from 35 for the one having
17vol.% retained austenite to 45 for that having
2vol.% retained austenite.
The characteristics of wear behavior are strongly impact angle dependent as shown in Fig. 3. Figure 17 shows a schematic diagram of the explanation of this impact angle-dependent phenomenon. The double peak in the Stage I ADI results from the presence of martensite phase. In addition, the above-mentioned impact angle shifts to a higher impact angle side as shown in Fig. 17(b) results from the presence of carbides due to the samples with prolonged austempering duration.
During the erosion process, the erosion will decrease the contents of retained austenite (see Fig. 13). As a
conse-quence, this study identical confirm the formation of ("
-carbide during the particle impingement. The retained austenite can be transformed by erosion is a question deserving further exploration.
5. Conclusions
(1) The erosion rate of the Stage I ADI tend to increase as the area fraction of martensite phase increases. The brittle martensite phase will cause cracking on the wear surface, and hence deterioration of erosion wear resistance. In addition, an impact angle-dependent double peak curve of erosion rate data can be recognized in the Stage I ADI, it can be manifested as increased the amount of martenite phase.
(2) In the Stage II ADI, the retained austenite amount tends to decrease as prolonged the austempering duration. Even a little presence of carbide in the specimen before erosion test can debase the erosion resistance, the impact angle of maximum wear loss tends to shift to the side of the higher impact angle.
(3) The amount of retained austenite tend to decrease after erosion test, the particle erosion induced phase
trans-formation into"-carbides led to eventual deterioration
of wear resistance of Stage II ADI.
Acknowledgements
The authors are grateful to the National Science Council of Taiwan, R.O.C. for its financial support (Contract: NSC 91-2216-E-006-043).
REFERENCES
1) K. Shimizu and T. Noguchi: Wear.176(1994) 255-260.
2) F. Y. Hung, L. H. Chen and T. S. Lui: Mater. Trans.43(2002) 1748-1757.
3) K. Shimizu, T. Noguchi and S. Doi: AFS Trans.101(1994) 225-229. 4) K. Shimizu, N. Shiramine, N. Fujita and T. Noguchi: BULL. FAC. ENG.
HOKKAIDO UNIV.169(1994) 13-19. (ISSN:0358-602) 5) W. S. Dai, L. H. Chen and T. S. Lui: Wear.239(2000) 143-152. 6) F. Y. Hung, L. H. Chen and T. S. Lui: Wear.252(2002) 985-991. 7) S. C. Lee and C. C. Lee: AFS Trans.96(1988) 827-838.