Environmental Implications of Animal Wastes Pollution
on Agricultural Soil and Water Quality
Christopher O. AKINBILE
1,2, Andrew E. ERAZUA
1, Toju E. BABALOLA
1and Fidelis O. AJIBADE
31Department of Agricultural and Environmental Engineering, Federal University of Technology,
Akure, Nigeria; 2Department of Biological and Agricultural Engineering, Universiti Putra
Malaysia, Selangor, Malaysia; 3Department of Civil and Environmental Engineering,
Federal University of Technology, Akure, Nigeria
Abstract
Akinbile C.O., Erazua A.E., Babalola T.E., Ajibade F.O. (2016): Environmental implications of animal wastes pollution on agricultural soil and water quality. Soil & Water Res., 11: 172−180.
An attempt was made to ascertain the environmental effects of animal wastes pollution on agricultural soil and water quality at the oldest teaching and research farm, Federal University of Technology, Akure, Nigeria. Physical, chemi-cal, and bacteriological analyses of water (shallow well) and soil samples were carried out to determine the present quality status. Fifteen soil samples collected at the centre of the animal wastes dump and at a distance of 5 and 10 m, and three different samplings done on the water source were analyzed. The parameters determined using APHA standard procedures included: turbidity, temperature, pH, alkalinity, sulphide, phosphate, dissolved oxygen, total dissolved solids, total hardness, biochemical oxygen demand, total iron, nitrate, chloride, calcium, and heavy met-als like copper, zinc, and lead. Most of the parameters indicated pollution including heavy metmet-als presence with the exception of Pb, Zn, Mn, Cu, and Cr that were not detected in water samples. Concentrations of nitrate, biochemical oxygen demand, SO42–, PO
43–, and Cl– were 0.20, 3.20, 10.50, 3.5, and 20.4 mg/l respectively, while those of detected
heavy metals such as Mg and Ni were 1.98 and 10.03 mg/l, respectively. Soil water holding capacity, porosity, pH, organic matter, organic carbon, and organic nitrogen ranged from 33.34 ± 3.73 to 59.06 ± 5.69, 34.6 ± 3.28 to 52.43 ± 5.5, 6.56 ± 0.03 to 7.54 ± 0.03, 2.32 ± 0.03 to 5.35 ± 0.03, 1.33 ± 0.01 to 3.11 ± 0.01, and 0.58 ± 0.07 to 1.13 ± 0.03%, respectively. The results showed that the well is strongly polluted with bacteria and pathogens and requires consider-able treatment before use while the soil is suitconsider-able for crop production.
Keywords: animal; pollution; soil; water; wastes
The extent of deterioration of soil and water re-sources due to pollution has assumed a frightening dimension with its attendant effects on global food security, water quality and hygiene and sustainable livelihoods. The downside of utilizing these essential resources is the occurrence of water contamination resulting from its many and varied uses (Akinbile & Ogedengbe 2004). Agriculture alone is the leading source of decreased water quality in both lakes and rivers, and the third largest contributor to estuarine habitat degradation (USEPA 2007). Overland flow from agricultural lands contain nutrients, sediments,
synthetic fertilizers that must be purchased and ap-plied to crops for achieving higher yields (Akinbile & Ogedengbe 2006). The bacterial contamination of groundwater (via leaching or seepage) and surface waters receiving runoff from such lands is a major health concern (Atiribom et al. 2007).
There are variety of uses for animal wastes including a fuel source, animal bedding, animal feed, mulch, organic matter, and plant nutrients (Schwartz et al. 2000) since land application of animal wastes is a common method of utilization. Depending on water content, incorporation of animal waste into the soil profile can be met with multiple benefits which in-clude improvements in soil tilt, water holding capacity, and aeration. These are all reported advantages of manure addition to the soil (Adekunle et al. 2007). Also, land-applied manure can increase soil resist-ance to both wind and water erosion while organic material contained within the waste can improve soil structure as well as infiltration capacity of soil (EPA 2005). Enhanced fertility of the receiving soils is credited to the nutrients present in the animal waste material. As the animal wastes are degraded by indigenous microorganisms, nutrients are slowly released. This slow release conserves the nutrients and allows them to be available to the crop through-out the growing season. However, since the rate of such releases is uncontrollable, this can be viewed as a disadvantage as well (Fučík et al. 2008). Finally, the economic value of manure can be determined by its nutrient content (N, P, and K) and the material can be sold as commercial fertilizer. Therefore, the objectives of this study are to assess the impacts of animal wastes pollution on agricultural soil and wa-ter quality and to recommend the best management practices (BMPs) which would curtail the trend and would be beneficial to the environment.
MATERIAL AND METHODS
Description of the study area. The teaching and research farm of the Federal University of Technol-ogy, Akure (FUTA), Nigeria is located along Malu road (9°18'N, 5°8'E). The farm has different sections (feed mill, cattle, brooding, poultry, and piggery). The farm is located near the staff quarters and post-graduate hostel. FUTA is located in Akure, capital city of Ondo State, south western Nigeria (7°58'0"N, 8°46'0"E). Akure has a tropical humid climate with two distinct seasons, a relatively dry season from November to March and a wet/rainy season from
April to October. Average annual rainfall ranges be-tween 1405 and 2400 mm of which the rainy season accounts for 90% while the month of April marks the beginning of rainfall (Akinbile 2006). High temperature and high humidity also characterize the Akure climate which is influenced by the rain-bearing southwest monsoon winds from the ocean and the dry northwest winds from the Sahara desert. Atmospheric temperature ranges between 28 and 31°C and mean annual relative humidity is about 80% (Akinbile 2006). The soil is made up of ferruginous tropical soils (Ibitoye 2001). Crystalline acid rocks constitute the main parent material of these soils. The main features include a sandy surface horizon underlain by a weakly developed clayey, mottled, and occasionally concretionary sub-soil. The soil is however sensitive to erosion and occasional water logging as a result of the clay sub-soil. The soils have an exceptional clayey texture, but combine good drainage and aeration with good properties of moisture and nutrient retention (en.wikipedia. org/wiki/Akure).
Animals housing and generated wastes. Cattle section is housed by 251 animals (10 per unit), fowl section enrolls 989 birds (mainly of layer species), and 39 animals are kept at the piggery section. The brooding section has well over 2810 chicks while the feed mill, located at 18 m west of the farm, produces the concentrates for fowls feeding. A total average of 680 g of wastes per unit is generated daily at the cattle section while 280 and 87 g are generated at the poultry and brooding sections, respectively. The wastes are removed daily from their respective sec-tions and dumped nearby for ease of movement, being infiltrated into the soil with rainfall. The wastes are not tilled into the soil but merely surface dumped; unfortunately the cropping section is 1.4 km away from the animal farms. Students at all levels (un-dergraduate and postgraduate) scoop considerable quantities of this waste for various analyses while farmers near the University community (with per-mitted access to the farm) usually take large chunk of it as farm yard manure (FYM).
The amounts of wastes generated daily in the re-spective sections were estimated as follows:
Cattle – one unit per 10 animals produces 680 g, waste production of 25 units = 17 000 g; pigs = 133 g; poultry (combined wastes – mature 280 g and brood-ing 87 g) = 367 g in total.
Water sampling and bacteriological analyses. Water samples were collected from the only available well located at about 5m away from the brooding sec-tion using a sterilized plastic bottle and refrigerated at 4°C in accordance with a standard procedure of APHA (2005) until the laboratory analyses. Physi-cal parameters analyzed were odour, taste, colour, turbidity, and temperature. Chemical parameters analyzed were pH, dissolved oxygen (DO), total dis-solved solids (TDS), total hardness (TH), total iron, nitrate, nitrite, chloride, calcium, and heavy metals such as copper, lead, and zinc. A bacteriological analysis was also carried out to ascertain the total coliform counts, Escherichia coli (E. coli) counts, and faecal coliform counts.
HI9828 Multiparameter water quality meter (Hanna Instruments, Capodistria, Slovenia) was used to measure in situ DO, biochemical oxygen demand (BOD), electrical conductivity (EC), TDS, and tem-perature while the heavy metals were determined using an atomic adsorption spectrophotometer (AAS) (Shimadzu AA-7000 series, Kyoto, Japan). Physical parameters such as odour, colour, and taste were at the discretion of the researcher after conducting physi-cal examination on the samples, other parameters such as NO2, NO3, Cl, and Ca were determined using standard laboratory procedures according to APHA (2005), and a turbidimeter (Hanna Instruments) was used for turbidity measurement. Bacteriological assay was used in determining E. coli and faecal coliform inthe water samples (Osuinde & Eneuzie 1999).
Soil sampling and analyses. 500 ± 0.5 g of soil samples were collected from each of the five sections of teaching and research (T&R) farm for analysis. The sections were goat and sheep, cattle, poultry, piggery, and feed mill, at a depth of 30 cm and dis-tance 0, 5, and 10 m respectively per sampling point at each section’s dumpsite. The samples were air dried, sieved using a 2 mm mesh and stored in sam-pling bags for analysis and the following constituents were analyzed: pH, organic matter (OM), organic content (OC), nitrogen (N), phosphorus (P), cal-cium (Ca), magnesium (Mg), copper (Cu), lead (Pb), sodium (Na), and potassium (K). This was done using standard laboratory procedures and analytical meth-ods (APHA 2005). The pH was measured using a pH meter (Mettler Toledo, Columbus, USA) and the soil organic content was determined in the laboratory using a muffle furnace to burn the soil at 440°C for 24 h. The soil porosity, moisture content and water holding capacity were also determined in the
labora-tory using standard procedures (Ibitoye 2001). The physical properties such as moisture content (MC), water holding capacity (WHC), porosity, particle size, and bulk density (BD) were also analyzed. The values were compared with the Food and Agriculture Organization (FAO) standards permissible for ideal agricultural practices and World Health Organiza-tion (WHO) values for water quality.
Statistical analysis. Results obtained were sub-jected to statistical analysis using the SPSS software, Version 19, the descriptive analyses and the analy-sis of variance (ANOVA), least square significance (LSD) and Duncan’s Multiple Range Test (DMRT) at P < 0.05 significance levels.
RESULTS AND DISCUSSION Water analysis
mater caused by dredging or due to the growth of micro-organisms. High turbidity levels can reduce the amount of light reaching lower depths, which can inhibit growth of submerged aquatic plants and consequently affect the ability of fish gills to absorb dissolved oxygen (EPA 2005). At no time can turbid-ity (cloudiness of water) go above 5 nephelometric units (NTU) (USEPA 2007). The water pH value is 6.70 which falls within the range of WHO and FAO permissible values (6.0–8.5 and 6.5–8.5 respectively), it is acidic (indicating the presence of metals, though a number of metals (such as lead, copper, manganese, chromium iron, and zinc) were not detected), and thus it is tolerable for municipal and domestic use (Friedlová 2010). The tolerable pH limit for fish and other aquatic animals is 9.0 above which the BOD5 and DO would be reduced thereby endangering the aquatic lives. The pH findings from this study agreed with the values obtained by Akinbile (2012). Values
of 9.5 and above indicate high alkalinity while values of 3 and below indicate acidity. Low pH values help in effective chlorination but cause problems with cor-rosion. This indicates that the well water is slightly polluted and will require minimal treatment to attain level permitting human and animal consumption (especially due to the presence of EC and PO4 which could increase chances of abortion in crops), but the water source is now applicable for irrigation purposes. Presence of heavy metals in the water samples. Table 2 contains the results of heavy metals analysis of water from the shallow well in the farm. Out of the eight heavy metals investigated in the water samples, only two (Ni and Mg) were detected and their con-centrations were well below the guideline values of both the FAO and WHO. Other metals, such as Pb, Cu, Zn, Fe, Mn, and Cr, were not present at all in the water samples meaning the water is non-toxic or does not contain poison (absence of Pb), no underly-ing rock formation near the well location (Cr, Cu, and Mn) and no disposal near the farm.
[image:4.595.304.533.126.267.2]Bacteriological analysis of the water samples. The results of bacteriological assay of the farm water samples are presented in Table 3. Very high values of total coliform, faecal coliform, and E. coli were recorded which gave credence to the fact that the water is severely polluted with bacteria infested
Table 2. Heavy metals in comparison with WHO and FAO standards (in mg/l)
Parameter WHO FAO Well water
Fe 0.5–50 0.5–50 –
Zn 3.0 3.0 –
Ni 0.02 0.02 0.03
Pb 0.01 0.01 –
Cu 1.0 1.0 –
Mn 0.5 0.5 –
Mg 150 – 1.98
Cr3– 0.05 0.05 –
[image:4.595.64.290.398.697.2]– not detected
Table 3. Bacteriological analysis in comparison with WHO and FAO water standards (in 1/100 ml)
Parameters WHO FAO Well water
Total coliform 0 1 200
Faecal coliform 0 0 120
Eschericha coli 0 1 11.60
Table 1. Physicochemical parameters of water sample analyzed with WHO and FAO standards (unless otherwise stated, all values are in mg/l)
Parameters WHO FAO Well Water Colour colourless colourless clear Odour odourless odourless mild Taste tasteless tasteless tasteless
Temperature (ºC) 25 25 25
pH 6.0–8.5 6.5–8.5 6.70
Turbidity (NTU) 0.5–5 5.0 0.02
Alkalinity 100 200 23.00
EC (µs/cm) 300 3.0 960
DO 0.3 2.0 7.80
BOD5 5.0 10 3.20
Cl– 200 2000 20.40
NO3 50 30 0.20
SO4 150 0.05 10.50
TSS 10 20 19.37
TS 500 100 31.60
TDS 0.5 30 12.23
TH 200 200 22.00
PO4 0.3 0.3 3.5
NTU – nephelometric turbidity unit; EC – electrical conduc-tivity; DO – dissolved oxygen; BOD – biochemical oxygen demand; Cl– – chloride; TSS – total suspened solids; TS –
[image:4.595.304.532.693.757.2]materials. The high values could be attributed to the dumping of animal waste directly on the soil surface. During rainfall, these pathogens, micro-organisms are washed into the well either through the little openings between the lined materials, by infiltration, percolation and seepage (Osuinde & Eneuzie 1999). The result of the sample analyzed showed 200, 120, and 11.60/100 ml water for total coliform, faecal coliform, and E. coli, respectively. The values were far above 1/100 ml approved by the WHO guidelines for drinking water quality which indicate the presence of organisms from faecal mate-rial and intestinal pathogens. The huge presence of E. coli underscored its status as essential indicator of pollution by faecal material of human or animal origin. The E. coli count obviously emanated from the improper handling of the animal wastes in the farm in relation to its dumpsite located near the shallow well which negates Sangodoyin’s (1991) postula-tion that a dumpsite like this should be located 30 m radially away from any water source.
Physicochemical analyses of the soil samples
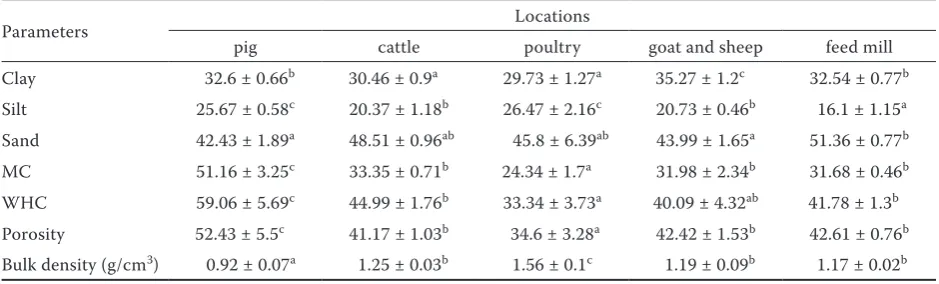
Tables 4 and 5 showed the physical and chemical properties of the soil at different sections of the teaching and research (T&R) farm. Soil samples from all the sections were analyzed while the USDA textural triangle was used for classifying the soils and it was found to be sandy clay loam for all the sections (Table 4). The high value of sand in feed mill section accounts for reduction in the organic matter content (Table 5) and this could be attributed to the fact that there is no form of animal droppings
[image:5.595.63.533.584.726.2]in that section. Ibitoye (2001) made similar obser-vations in his study which indicated a decrease in sand within the refuse dump area as the soil depth increased and no significant difference was observed (P < 0.05) within all the sections. The mean moisture contents for piggery, cattle, goat, and feed mill were 51.16 ± 3.25, 33.35 ± 0.71, 24.34 ± 1.7, 31.98 ± 2.34, and 31.68 ± 0.46%, respectively, meaning that MC decreased from the waste point with increasing distance at each location except feed mill and cat-tle sections where it was random and this could be attributed to the fact that there is no specific dump area for the cattle and no animal waste dump at the feed mill section. This is similar to the observations made by Molden (2007). The moisture content within the refuse and dump (centre) was higher as this was associated with the increased activity of organisms and high organic matter. The mean water holding capacity is 59.06 ± 5.69% for piggery section, 44.99 ± 1.76% for cattle section, 33.34 ± 3.73% for poultry, 40.09 ± 4.32% for goat and sheep, and 41.78 ± 1.3% for feed mill section. WHC was high due to high organic matter content in the soil samples at each location and clay content distribution though there was an exception at the poultry location which had the lowest WHC and this could be attributed to the soil structure and the terrain here. It was also noticed that during the sample collection in poultry section, the soil was more compacted than at the other places. Mean porosity values of the soil from piggery section, cattle section, poultry section, goat and sheep section, and feed mill section were 52.43 ± 5.5, 41.17 ± 1.03, 34.6 ± 3.28, 42.42 ± 1.53, and 42.61 ± 0.76%, respectively (Table 4). Porosity ranged from 34 to 58%, which indicates a high percentage
Table 4. Physical properties of soil samples analyzed at different locations (all values are in % except where otherwise stated)
Parameters Locations
pig cattle poultry goat and sheep feed mill Clay 32.6 ± 0.66b 30.46 ± 0.9a 29.73 ± 1.27a 35.27 ± 1.2c 32.54 ± 0.77b
Silt 25.67 ± 0.58c 20.37 ± 1.18b 26.47 ± 2.16c 20.73 ± 0.46b 16.1 ± 1.15a
Sand 42.43 ± 1.89a 48.51 ± 0.96ab 45.8 ± 6.39ab 43.99 ± 1.65a 51.36 ± 0.77b
MC 51.16 ± 3.25c 33.35 ± 0.71b 24.34 ± 1.7a 31.98 ± 2.34b 31.68 ± 0.46b
WHC 59.06 ± 5.69c 44.99 ± 1.76b 33.34 ± 3.73a 40.09 ± 4.32ab 41.78 ± 1.3b
Porosity 52.43 ± 5.5c 41.17 ± 1.03b 34.6 ± 3.28a 42.42 ± 1.53b 42.61 ± 0.76b
Bulk density (g/cm3) 0.92 ± 0.07a 1.25 ± 0.03b 1.56 ± 0.1c 1.19 ± 0.09b 1.17 ± 0.02b
of clay content for a low sand proportion. Poultry section has the highest mean bulk density and this could also be compared with the low porosity value of the soil at the same section. It was evident that the lower the porosity, the higher the bulk density and this can also cause water hindrance down the profile. Yusuf (2007) made similar observations in his studies and the compacted nature of the soil could also be the reason for the high value of bulk density.
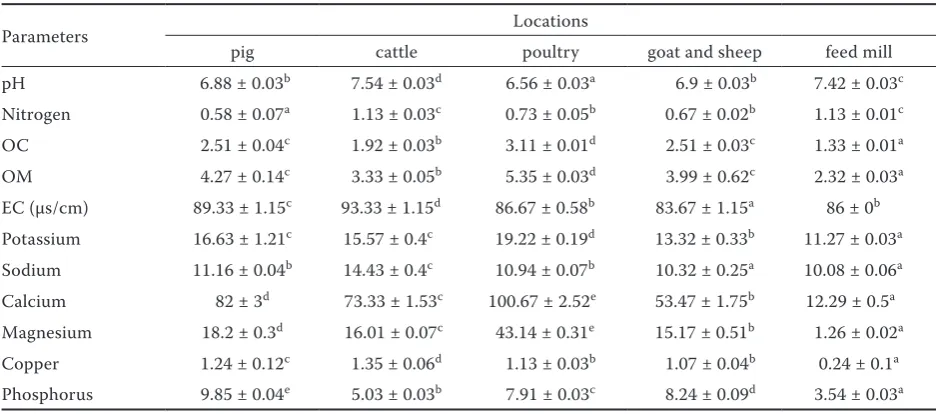
Table 5 shows the chemical properties of the soil analyzed and the mean values of pH are 6.88 ± 0.03, 7.54 ± 0.03, 6.56 ± 0.03, 6.9 ± 0.03, and 7.42 ± 0.03 in all the sections, respectively. There were no significant differences between the samples from piggery and goat section which could be due to similarities in their feeds. For each of the section replicates, pH decreased with the increasing distance from the waste dump. This could be a result of high exchangeable bases content around the waste dump (Akinbile 2012). Mean values of ni-trogen were 0.58 ± 0.07, 1.13 ± 0.03, 0.73 ± 0.05, 0.67 ± 0.02, and 1.13 ± 0.01% in all the sections respectively. There were no significant differences between the soil samples from poultry and goat sections but they were significantly different from those of the other three loca-tions. Also, soil from piggery section was significantly different from the samples from the other locations. OM mean values were 4.27 ± 0.14, 3.33 ± 0.05, 5.35 ± 0.03, 3.99 ± 0.62,and 2.32 ± 0.03% for all the sections and it decreased with the increasing distance from the
centre of the dump (CD). High OM around CD favoured increased MC, WHC, and permeability. Water is able to enter and percolate downward through the soil with pollutants (Rangwala et al. 2007). The levels of OM in other sections except feed mill were considerably high and this indicated the effect of animal waste on the soils around the feed mill where the animal waste dump is situated.
[image:6.595.63.533.519.726.2]Mean values for organic carbon (OC) in all the sections were 2.51 ± 0.04, 1.92 ± 0.03, 3.11 ± 0.01, 2.51 ± 0.03, and 1.33 ± 0.01%, respectively (Table 5). Poultry has the highest OC value while the feed mill section has the least OC and the possible reason behind this could be that there is no animal wastes dump within the section. Nitrogen content decreased with the increasing distance from the waste dump with each location’s replicates except for cattle and feed mill sections (Table 5). It was evident that there was no concentrated area for animal wastes dump as it was observed during sampling. This is similar to the findings of Akinbile (2012). Mean values for phosphorus concentrations at each location were 9.85 ± 0.04, 5.03 ± 0.03, 7.91 ± 0.03, 8.24 ± 0.09, and 3.54 ± 0.03 mg/kg, respectively and they decreased with the increasing distance from the CD and also for the replicates. For all the locations except the feed mill, high calcium content was observed. The reason could be the salt content in the animal concentrates. The mean values were 82 ± 3.00, 73.33 ± 1.53, 100.67 ± 2.52, 53.47 ± 1.75, and 12.29 ± 0.5 mg/kg respectively
Table 5. Chemical properties of soil samples analyzed at different locations (all values are in mg/kg except where other-wise stated)
Parameters Locations
pig cattle poultry goat and sheep feed mill pH 6.88 ± 0.03b 7.54 ± 0.03d 6.56 ± 0.03a 6.9 ± 0.03b 7.42 ± 0.03c
Nitrogen 0.58 ± 0.07a 1.13 ± 0.03c 0.73 ± 0.05b 0.67 ± 0.02b 1.13 ± 0.01c
OC 2.51 ± 0.04c 1.92 ± 0.03b 3.11 ± 0.01d 2.51 ± 0.03c 1.33 ± 0.01a
OM 4.27 ± 0.14c 3.33 ± 0.05b 5.35 ± 0.03d 3.99 ± 0.62c 2.32 ± 0.03a
EC (µs/cm) 89.33 ± 1.15c 93.33 ± 1.15d 86.67 ± 0.58b 83.67 ± 1.15a 86 ± 0b
Potassium 16.63 ± 1.21c 15.57 ± 0.4c 19.22 ± 0.19d 13.32 ± 0.33b 11.27 ± 0.03a
Sodium 11.16 ± 0.04b 14.43 ± 0.4c 10.94 ± 0.07b 10.32 ± 0.25a 10.08 ± 0.06a
Calcium 82 ± 3d 73.33 ± 1.53c 100.67 ± 2.52e 53.47 ± 1.75b 12.29 ± 0.5a
Magnesium 18.2 ± 0.3d 16.01 ± 0.07c 43.14 ± 0.31e 15.17 ± 0.51b 1.26 ± 0.02a
Copper 1.24 ± 0.12c 1.35 ± 0.06d 1.13 ± 0.03b 1.07 ± 0.04b 0.24 ± 0.1a
Phosphorus 9.85 ± 0.04e 5.03 ± 0.03b 7.91 ± 0.03c 8.24 ± 0.09d 3.54 ± 0.03a
(Table 5) which also shows each location’s mean values of other exchangeable parameters such as sodium, potassium, and magnesium. As for heavy metals, Pb was not detected at all, and just traces of Cu were found out at the five locations. Cu mean values were 1.24 ± 0.12, 1.35 ± 0.06, 1.13 ± 0.03, 1.07 ± 0.04, and 0.24 ± 0.1 mg/kg, respectively. Low values of heavy metals in all the sections indicate little or no toxic pollution and could be the reason why most of the heavy metals were not detected in the water sample analyzed from the same study area.
Correlations of physical and chemical parameters in all the sections
The significance of the observed correlation co-efficients for chemical and physical parameters is shown in Tables 6 and 7, respectively. Out of a total 55 correlations found between two parameters at a
[image:7.595.62.534.112.297.2]significant level of 0.05, 14 were found to be significant at R > 0.8 which indicated strong correlations, two were found to be significant at 0.7 < R < 0.8, eight were found to be significant at 0.5 < R < 0.7 with four of them greater than five and less than six. Similarly, 20 negative correlations were also found (Table 6). Table 7 shows that silt had a significant nega-tive relationship with clay (R= –0.27) which menas that silt decreases as clay increases. Sand also had negative correlation coefficient between clay and silt (–0.36 and –0.72 respectively). MC had a low signifi-cant relationship between clay and silt (0.31 and 0.22 respectively) and a negative correlation between sand (–0.43). This is evident in that the moisture content lowers as sand increases. However, there was a high significant relationship between WHC and MC (0.97) which indicated an increase in MC when there was a corresponding increase in WHC. In all the parameters tested using t-test correlation analysis, there were
Table 6. Correlation coefficient of different soil samples of chemical variables from the study data
Variable pH N OC OM EC K Na Ca Mg Cu P
pH 1
Na 0.86 1
OC –0.91 –0.79 1
OM –0.86 –0.71 0.97 1
EC 0.48 0.39 –0.17 –0.08 1
K –0.63 –0.44 0.82 0.87 0.33 1
Na 0.49 0.43 –0.11 –0.05 0.89 0.29 1
Ca –0.61 –0.53 0.86 0.88 0.35 0.96 0.37 1
Mg –0.77 –0.48 0.90 0.92 0.01 0.91 0.07 0.88 1
Cu –0.31 –0.43 0.65 0.64 0.49 0.71 0.60 0.85 0.56 1
P –0.80 –0.96 0.82 0.77 –0.16 0.58 –0.21 0.67 0.53 0.62 1
OC – organic carbon, OM – organic matter, EC – electrical conductivity
Table 7. Correlation coefficients of different soil samples of physical variables from the study data
Variables Clay Silt Sand MC WHC Porosity BD
Clay 1
Silt –0.27 1
Sand –0.36 –0.72 1
MC 0.31 0.22 –0.43 1
WHC 0.26 0.17 –0.39 0.97 1
Porosity 0.49 0.07 –0.42 0.94 0.95 1
BD –0.58 0.15 0.30 –0.90 –0.89 –0.95 1
[image:7.595.62.539.608.736.2]significant differences considered at 95% confidence interval also confirming the presence of pollutants at irregular concentrations in all the soil samples.
CONCLUSIONS
A fundamental discovery from the study was that water from the shallow well serving the entire farm did not meet minimum requirements given by the WHO and FAO standards. It was also revealed that concentrations of animal waste materials in the study area had systematically increased some important soil nutrients as well as polluted groundwater over time. The effect of the pollution declined with distance from the polluting source which implied that contamination of groundwater was more dependent on the proximity to the dump sites. However, the results indicated very poor sanitation and damaging effects on the health of both humans and animals if the well water is used for domestic and agricultural purposes. Similarly, the effect of waste disposal on soils is damaging because when the chemical elements are absorbed by soils, toxins pass into the food chain through grazing animals which affects their productivity. Evidently, improper dumping of animal wastes should be discouraged, especially within the farm vicinity for healthy living of both human and animals and sustained productive use of soils for increased productivity. Urgent treatment of the well water before use and composting rather than indiscriminate dumping are to be encouraged for optimum crop production.
Acknowledgements. The authors are grateful to The World Academy of Science (TWAS) for providing Dr. C.O. Akin-bile (FR No. 3240275076) three months Visiting Scholar fellowship and to the University Putra Malaysia (UPM) that enabled him to utilize the fellowship.
References
Adekunle I.M., Adetunji M.T., Gbadebo A.M., Banjoko O.B. (2007): Assessment of groundwater quality in a typical rural settlement in Southwest Nigeria. International Journal of Environmental Research and Public Health, 4: 307–318.
Akinbile C.O. (2006): Hawked water quality and health implications in Akure, Nigeria. Botswana Journal of Tech-nology, 15: 70–75.
Akinbile C.O. (2012): Environmental impact of landfill on groundwater quality and agricultural soils in Nigeria. Soil and Water Research, 7: 18–26.
Akinbile C.O., Ogedengbe K. (2004): Impact of industrial pollutants on quality of ground and surface waters at Oluyole industrial estate, Ibadan, Nigeria. Nigerian Jour-nal of Technological Development, 4: 139–144.
Akinbile C.O., Ogedengbe K. (2006): Disposal effects of animal wastes (poultry & swine) as manure on soil fertility and growth performance of Amaranthus spp. Journal of Agricultural and Environmental Engineering Technol-ogy, 2: 1–8.
APHA (2005): American Water Works Association, Water Pollution Control Federation. Standard Methods for the Examination of Water and Waste Water. 21st Ed.
Wash-ington DC, American Public Health Association. Atiribom R.Y., Ovie S.I., Ajayi O. (2007): Bacteriological
quality of water and fish samples from Kainji Lake and the effects of animal and human activities. In: Proc. Conf. Fisheries Society of Nigeria (FISON), Kebbi, Nov 12–16, 2007: 209–218.
EPA (2005): Protecting Water Quality from Agricultural Runoff. Fact Sheet No. EPA-841-F-05-001, EPA. FAO (2007): Food and Agricultural Organisation coping
with water scarcity. In: 2007 World Water Day, March 22, 2007. Available at http://www.fao.org/nr/water7docs/ wwd07brochure.pdf
Friedlová M. (2010): The influence of heavy metals on soil biological and chemical properties. Soil and Water Research, 5: 21–27.
Fučík P., Kvítek T., Lexa M., Novák P., Bílková A. (2008): Assessing the stream water quality dynamics in connec-tion with land use in agricultural catchments of different scales. Soil and Water Research, 3: 98–112.
Ibitoye A.A. (2001): Effects of municipal refuse dump on soil and water quality in Akure Metropolis. Journal of Applied Soil Science, 2: 16–24.
Molden D. (ed.) (2007): Water for Food, Water for Life: A Comprehensive Assessment of Water Management in Agriculture. Sterling, Earthscan/IWMI.
Osuinde M.I., Eneuzie N.R. (1999): Bacteriological analysis of ground water. Nigeria Journal of Microbiology, 13: 47–54. Rangwala S.C., Rangwala K.S., Rangwala P.S. (2007): Water Supply and Sanitary Engineering: Environmental Engi-neering. 22nd Ed., Anand, Charotar Publishing.
Rejšek K. (2006): The quantitative estimate of bioavail-able inorganic phosphorus content in forest soils by the modification of the anion-exchange resin method. Soil and Water Research, 1: 117–126.
Sangodoyin A.Y. (1991): Ground and surface water pollution by open refuse dump in Ibadan, Nigeria. Discovery and Innovation, 3: 37–43.
Philadelpia. Journal of Epidemiology and Community Health, 54: 45–51.
USEPA (2007): Municipal Solid Waste Generation, Recy-cling and Disposal in the United States: Facts and Figures for 2006. EPA-530-F-07-030. Available at http://www.epa. gov/osw//nonhaz/municipal/pubs/msw06.pdf
WHO (2004): Guidelines for Drinking Water Quality. Vol. 1, Recommendation, 3rd Ed. Geneva, WHO.
Yusuf K.A. (2007): Evaluation of groundwater quality char-acteristics in Lagos-City. Journal of Applied Science, 7: 1780–1784.
Received for publication February 6, 2015 Accepted after corrections November 9, 2015 Published online May 24, 2016
Corresponding author: