Weld Penetration and Marangoni Convection with Oxide Fluxes in GTA Welding
6
0
0
Full text
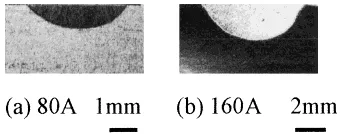
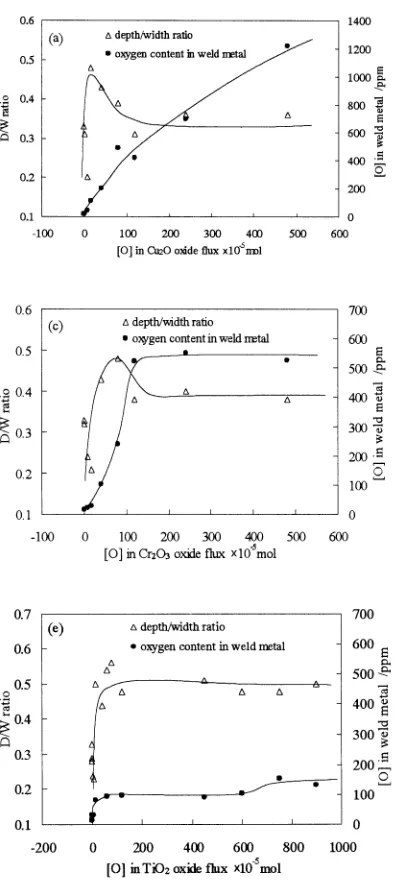
(2) Weld Penetration and Marangoni Convection with Oxide Fluxes in GTA Welding. measured. The oxygen content in the weld metal was analyzed by an oxygen/nitrogen analyzer (HORIBA, EMGA520). Samples for the oxygen measurement were prepared as follows: first of all, the slag on the bead surface was removed by 400# abrasive paper grinding, and then the weld metal was cut out directly as the oxygen analysis specimen for the bead welded at 160 A. Since the size of the weld manufactured at 80 A is too small to be cut directly, we cut out the weld metal together with the substrate around the weld, and measured the average oxygen content in the specimen. Based on the volume Table 2 Welding parameters. Parameters. Value. Electrode type Diameter of electrode Vertex angle of electrode Shield gas and flow rate Arc length Bead length Spot time Welding current Welding speed. DCEN, W-2%ThO2 1.6 mm 60◦ Ar, 10 L·min−1 3 mm 50 mm 3s 80 A, 160 A 2 mm/s. Fig. 1. Fig. 2. Schematic of the SUS304 plate used in GTAW.. Weld cross-section without flux. (a) 80 A, (b) 160 A.. Fig. 3. 2927. ratio of the weld metal in the specimen, the oxygen content in the weld metal was then calculated. 3. Results and Discussion 3.1 Weld cross-sections Cross-sections of the welding beads made using different oxide fluxes of different quantities were photographed. The fusion zone shapes without flux, and with a different single component flux welded at 80 A and 160 A are shown in Figs. 2, 3 and 4, respectively. Compared with the fusion zone shape without flux in Fig. 2, all the five oxide fluxes, Cu2 O, NiO, Cr2 O3 , SiO2 and TiO2 , increases the penetration significantly in a certain range of flux quantity. For a selected single flux, Fig. 4 illustrates the large variation in penetration as a result of the different quantities of fluxes used. Except for TiO2 , the penetration depth with the other oxides in the experiment increases first, followed by a decrease with the increasing oxide quantity. However, the penetration depth is still deep with the TiO2 flux even at the high quantity of 450 × 10−5 mol, at both 80 A and 160 A. 3.2 Weld D/ W ratio and oxygen analysis Based on the cross-section pictures, the dimensions and depth/width ratio of the fusion zone were calculated for all the samples. After that, the weld was cut out for the oxygen analysis using the HORIBA EMGA-520. The depth/width ratio and oxygen content in the weld after welding are plotted versus the oxygen quantity in the covered flux before welding in Figs. 5 and 6. Since the solidification speed of the small liquid pool is very high, the oxygen in the weld pool cannot flow out too much in the short solidification process. We consider that the oxygen content in the weld metal measured under solid state is nearly same as the oxygen content in the liquid weld pool. It is clear that the weld D/W ratio initially increases sharply, followed by a decrease as the oxygen quantity increases for the Cu2 O, NiO, Cr2 O3 and SiO2 fluxes. For the TiO2 flux, the weld D/W ratio increases sharply first and then remains nearly constant with the quantity of flux. The measured oxygen value in the weld after welding is increased with the oxide flux quantity covered before welding for the fluxes Cu2 O, NiO and SiO2 , while for the Cr2 O3 and TiO2 , the oxygen content in the weld first increases then remains approximately constant to 500 ppm and 120 ppm, respectively.. Weld cross-sections with Cu2 O and TiO2 oxide at 80 A. (a) Cu2 O, (b) TiO2 ..
(3) 2928. S. P. Lu, H. Fujii, H. Sugiyama, M. Tanaka and K. Nogi. Fig. 4 Weld cross-sections with different oxides at 160 A. (a) Cu2 O, (b) NiO, (c) Cr2 O3 , (d) SiO2 , (e) TiO2 .. Fig. 5. D/W ratio and oxygen content in weld vs. flux quantity at 80 A. (a) Cu2 O, (b) TiO2 .. Compared with the Cu2 O and NiO fluxes, Cr2 O3 and TiO2 are more stable and hence the decomposition is relatively difficult in the same welding process. Therefore, the oxygen in the weld metal from the decomposition of the flux cannot be increased continuously as Cu2 O and NiO. Weld penetration in GTAW was determined by the fluid flow mode in the weld pool, which is driven by the electromagnetic force, surface tension gradient, buoyancy force and impinging force of the arc plasma. Among them, the surface tension gradient on the welding pool surface is the prin-. ciple variable that changes the convection mode. Generally, the surface tension decreases with the increasing temperature, ∂σ/∂ T < 0, for pure metal and many alloys. In the weld pool for such materials, the surface tension is higher in the relatively cooler part of the pool edge than that in the pool center under the arc, and hence the fluid flows from the pool center to the edge. The heat flux is easily transferred to the edge and the weld pool shape is relatively wide and narrow as shown in Fig. 7(a). Heiple and Roper12, 14, 21, 22) proposed that surface active elements such as oxygen, sulfur and selenium.
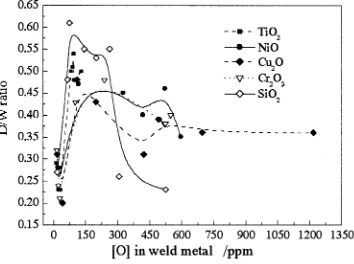
(4) Weld Penetration and Marangoni Convection with Oxide Fluxes in GTA Welding. 2929. Fig. 6 D/W ratio and oxygen content in weld vs. flux quantity at 160 A. (a) Cu2 O, (b) NiO, (c) Cr2 O3 , (d) SiO2 , (e) TiO2 .. can change the temperature coefficient of the surface tension for iron alloys from negative to positive, ∂σ/∂ T > 0, and further change the direction of the fluid flow in the weld pool as illustrated in Fig. 7(b). In that case, a relatively deep and narrow weld was produced. In our experiments, the oxygen in the weld from the decomposition of the oxide flux played the important role as an active element and changed the Marangoni convection mode of the liquid weld pool. The conclusion by Taimatsu and Nogi23) showed that oxygen was an active element in pure liquid iron in the range of 150–350 ppm. In this range, the temperature coefficient of the surface tension of the Fe–O alloy is positive, while out of the range, the temperature coefficient of the surface tension became to negative or nearly zero. It can be assumed that the oxygen in the stainless steel weld pool has the same effect. As the oxygen content in the weld increased with the oxide flux quantity, the Marangoni convection mode changes from outward to inward first, and then the inward convection becomes weaker or changed to the outward direction as the oxygen content increases in the weld. For that reason, the D/W ratio increases initially, followed by a decrease with the oxygen in the weld metal as shown in. Figs. 5 and 6. Since the oxygen in the weld for TiO2 is lower than 200 ppm, the penetration does not decrease even when using a large quantity of flux. There are certain quantities of alloy elements such Ni and Cr in the stainless steel, which may affect the oxygen range for a positive ∂γ /∂ T different from that in the pure iron of 150–350 ppm. In our experiments, it is found that when the oxygen content in the weld is in the range of 70–300 ppm, the penetration of the weld pool was deep as shown in Fig. 8. 3.3 Bead morphology Comparing the results of the Cu2 O flux with that of the TiO2 flux in Figs. 5 and 6, it is found that there is a narrow range for the Cu2 O quantity for which the D/W ratio was higher than 0.4, while there is a substantial range of TiO2 quantity ([O] in TiO2 > 100 × 10−5 mol) for which the D/W ratio is independent of the TiO2 quantity. This significant difference is related to the chemistry-physical properties of the oxides. As mentioned above, from the Ellingham diagram (∆G ◦ −T ), the Cu2 O oxide is unstable and easily decomposed under the arc. The decomposed oxygen would dissolve in the weld pool and quickly increase the oxygen content in the.
(5) 2930. S. P. Lu, H. Fujii, H. Sugiyama, M. Tanaka and K. Nogi. Fig. 9 Molten flux during welding with large quantity of TiO2 .. Fig. 7 Marangoni convection mode by surface tension gradient in welding pool. (a) ∂∂σT < 0; (b) ∂∂σT > 0.. Fig. 10 Bead morphologies with large quantity of TiO2 . (a) 120×10−5 mol, (b) 450 × 10−5 mol, (c) 750 × 10−5 mol.. Fig. 8. D/W ratio vs. [O] in weld.. weld. If the oxygen content is too high, the inward Marangoni convection becomes weak or changes to the outward direction and the weld pool penetration decreases again. However, the TiO2 oxide is stable and not decomposed completely under the arc, which caused the oxygen content in the weld pool to be relatively low and the Marangoni convection mode is maintained in the inward direction. Based on observations of the molten pool surface, as the TiO2 oxide quantity in the 5 mm × 0.1 mm × 50 mm slot is over 120 × 10−5 mol, the majority of the TiO2 flux melts into a liquid ball just in front of the arc and moves forward together with the arc as shown in Fig. 9. The size of the liquid flux ball increases gradually as the new flux melts. Eventually the liquid ball would be broken under the arc and leave a pit on the bead surface as shown in Fig. 10 (arrow position). Because of this, the majority of TiO2 has no function in increasing the oxygen in the weld. This phenomenon does not exist for the other oxides used in these experiments. From the results, it is shown that deep penetration is not sensitive to. the TiO2 flux quantity covered before welding, but sensitive to the Cu2 O flux quantity. Therefore, the TiO2 flux is a good recommended active flux in GTAW for deep penetration. 4. Conclusions (1) In GTA welding, the quantity of the oxide flux has a significant effect on the weld penetration. The weld depth/width ratio initially increases, followed by a decrease with the increasing flux quantity for Cu2 O, NiO, Cr2 O3 and SiO2 . (2) The oxygen from the decomposition of the flux alters the surface tension gradient on the weld pool surface and hence changes the Marangoni convection direction and the weld pool penetration. As the oxygen content in the weld is in the range of 70–300 ppm, the weld depth/width ratio is increased by 1.5 to 2 times. Too low or too high oxygen content in the weld does not increase the depth/width ratio. The Marangoni convection in the welding pool plays an important role in changing the weld pool convection mode and the weld penetration. (3) The weld D/W ratio is not sensitive to the TiO2 quantity. Therefore, TiO2 is a highly recommended active flux for.
(6) Weld Penetration and Marangoni Convection with Oxide Fluxes in GTA Welding. deep penetration for real GTAW applications. Acknowledgements This work is the result of “Development of Highly Efficient and Reliable Welding Technology”, which is supported by the new Energy and Industrial Technology Development Organization (NEDO) through the Japan Space Utilization Promotion Center (JSUP) in the program of Ministry of Economy, Trade and Industry (METI). REFERENCES 1) S. M. Gurevich and V. N. Zamkov: Avtom. Svarka. 1966 (12), 13–16. 2) P. J. Modenesi, E. R. Apolinario and I. M. Pereira: J of Mater. Proc. Tech. 99 (2000) 260–265. 3) S. Kou and Y. H. Wang: Weldg. J. 65 (1986) 63s–70s. 4) M. Tanaka, T. Shimizu, H. Terasaki, M. Ushio, F. Koshi-ishi and C. L. Yang: Sci. & Tech. of Weld. & Join. 5 (2000) 397–402. 5) D. S. Howse and W. Lucas: Sci. & Tech. of Weld. & Join. 5 (2000) 189–193. 6) H. C. Ludwig: Weldg. J. 47 (1968) 234s–240s. 7) Ding Fan, Ruihua Zhang, Yufen Gu and M. Ushio: Trans. JWRI. 30. 2931. (2001) 35–40. 8) S. Sire and S. Marya: Proc. of the 7th Int. Symp. JWS (2001) pp. 113– 118. 9) S. Marya and S. Sire: Proc. of the 7th Int. Symp. JWS (2001) pp. 107– 112. 10) T. Ohji, A. Miyake, M. Tamura, H. Inoue and K. Nishiguchi: J. of Japan Weld. Soc. 8 (1990) 54–58. 11) C. R. Heiple and J. R. Roper: Weldg. J. 61 (1982) 97s–102s. 12) C. R. Heiple, J. R. Roper, R. T. Stagner and R. J. Aden: Weldg. J. 62 (1983) 72s–77s. 13) H. Fujii, N. Sogabe, M. Kamai and K. Nogi: Proc. of the 7th Int. Symp. JWS (2001) pp. 131–136. 14) C. R. Heiple and J. R. Roper: Weldg. J. 60 (1981) 143s–145s. 15) S. Kou and D. K. Sun: Metall. Trans. A. 16 (1985) 203–213. 16) S. Kou and Y. H. Wang: Weldg. J. 65 (1986) 63s–70s. 17) C. Limmaneevichitr and S. Kou: Weldg. J. 79 (2000) 324s–330s. 18) Y. Wang and H. L. Tsai: Metall. Mater. Trans. 32B (2001) 501–515. 19) Y. Wang, O. Shi and H. L. Tsal: Metall. & Mater. Trans. 32B (2001) 145–161. 20) G. M. Oreper, T. W. Eagar and J. Szekely: Weldg. J. 62 (1983) 307s– 312s. 21) C. R. Heiple and P. Burgardt: Weldg. J. 64 (1985) 159s–162s. 22) J. R. Roper and D. L. Olson: Weldg. J. 57 (1978) 103s–107s. 23) H. Tamatsu, K. Nogi and K. Ogino: J. High. Temp. Soc. 18 (1992) 14– 19..
(7)
Figure


+2
Related documents
• Describe scope definition, problem analysis, requirements analysis, logical design, and decision analysis phases in terms of information system building blocks.. • Describe
Our research shows that long-term gradual cutting by tree-length system in wintertime in mixed conifer stands on podzolic soils in the middle taiga, on skid - ding trails and
Our future work concerns the following topics: (i) im- prove the efficiency of the model selection and parameter estimation procedures in order to scale up to very large data
However, we find the diagonal of Hilbert matrix have significant impact illumination and reflectance on color image and its detected components for color image
melanogaster are exposed to chemical o r physical mutagens (radiation), these agents may be homogeneously distributed in the oocyte sample to be analyzed, o r there
Comparative fecal load calibration curves developed for each observer for the dry and wet season trials that were used to predict fecal deposit dry weight from observer rank, n = 15
