Nutritional and net energy value of fermented olive
wastes in rations of lactating ewes
V. Christodoulou
1, V.A. Bampidis
1, P.H. Robinson
2, C.J. Israilides
3,
A. Giouzelyiannis
1, A. Vlyssides
41Animal Research Institute, National Agricultural Research Foundation, Giannitsa, Greece 2Department of Animal Science, University of California, Davis, CA, USA
3Institute of Technology of Agricultural Products, National Agricultural Research Foundation, Lycovrissi Athens, Greece
4Department of Chemical Engineering, National Technical University, Athens, Greece
AbstrAct: In an experiment with 18 lactating Chios ewes, the replacement of barley grain, wheat grain, sugar
beet pulp and lucerne meal with fermented olive wastes (FOW), maize grain and soybean meal was used to formu-late diets that allowed the net energy (NE) for lactation (NEl) density of FOW to be calculated. In the experiment, which lasted 8 weeks, ewes were allocated, after equal distribution for milk yield, body weight (BW) and lactation number, into three treatments of 6 ewes each in a Youden square experimental design with 4 consecutive periods of 14 days. Ewes in all groups were offered a concentrate mixture ad libitum (1.12 kg/ewe/day, dry matter (DM) basis) and lucerne hay (0.90 kg/ewe/day, DM basis). FOW were added to the concentrate mixture at inclusion levels (on an as-fed basis) of 0, 100 and 200 kg/t for treatments FOW0, FOW100 and FOW200, respectively. There were no differences among groups in milk protein (60.0 g/kg), lactose (53.0 g/kg) or ash (9.6 g/kg) contents, but milk fat content increased linearly (P < 0.01) with increasing dietary levels of FOW. Average milk yield (1 137 g/day) and yields of components tended (P < 0.10) to decrease with increased FOW feeding. The best estimate of the NEl density of FOW was 2.55 MJ/kg DM at 2.7×M NE intake, a value only slightly lower than that of 2.62 at 2.7×M based upon a Van Soest et al. (1984) discount from equations of Van Es (1978), who suggested 3.00 MJ/kg DM at 1.1×M of NE intake. FOW is a low protein, high fibre and low NEl feedstuff that will be of limited value in rations of high producing lactating ewes.
Keywords: fermented olive wastes; Chios ewes; milk yield; milk composition
Greece is, after Spain and Italy, the third highest olive oil producing country in the world. About 3 500 olive mills operate in Greece, and most of them are scattered in the countryside of Crete, Peloponnese, Ionean islands and Lesvos. The ope-ration of olive oil mills is seasonal, primarily from November to March. About 214 kg olive oil, 496 kg crude olive cake, 40 kg of leaves and 1 633 kg of olive mill wastes water (OMWW) are produced from 1 tonne of fresh olives (Vlyssides et al., 2004). The high amount of OMWW produced during olive oil extraction occurs because water is added in quan-tities that exceed the weight of fresh olives. Olive stone wooden residue (OSWR) is a by-product of
the crude olive cake industries and is the remai-ning residue after the solvent extraction of stone oil. The OMWW, which amounts to 1.5 million tonnes annually, is considered toxic and may cause serious environmental problems, mainly due to its high phe-nolic content (Israilides et al., 1997).
addi-tion of OMWW to maintain favourable moisture levels. This product is free from heavy metals (e.g. Pb, Cd) and aflatoxins, has an 80% lower phenolic content, and is a good soil conditioner and ferti-lizer (Israilides et al., 2000). However, fermented OSWR with OMWW, called fermented olive wastes (FOW), can be further dried to approximately 900 g/kg dry matter (DM) and, because of its che-mical composition, can provide the ruminant indu-stry with an alternative feedstuff.
In Greece, intensive sheep production is based on diets high in cereal grains and a protein supple-ment, with soybean meal (SBM) being the most common. However, using the old equations of Van Es (1978) based upon in vivo research, FOW would contain only 3.00 MJ/kg DM of net energy (NE) for lactation (NEl) at about 1.1 times maintenance (M) NE intake (i.e. 1.1×M). If true, this low level would preclude the use of FOW at substantive levels in most rations of production ruminants. However no data is available on the NEl value of modern FOW.
The objective of this study was to determine the NEl concentration of modern FOW by feeding it to lactating Chios ewes, using diets containing barley grain, wheat grain, sugar beet pulp and lucerne meal.
MAteriAl ANd Methods
Fermented olive wastes
The experiment was conducted at the Animal Research Institute, National Agricultural Research Foundation (N.AG.RE.F.), in Giannitsa (Greece). FOW (Table 1) were obtained from the Institute of Technology of Agricultural Products (N.AG.RE.F.) in Lycovrissi, Athens (Greece). FOW were placed to a depth of 2 cm in 100 cm × 80 cm × 5 cm metal pans, and sun dried for 72 h. Due to its geographical position, the weather in Greece is fairly uniform and has mild winters and warm summers charac-terized by sunshine and very little rainfall. The final DM content of FOW after drying generally de- pends on air temperature and humidity. The amount of FOW that was exposed to the drying process was finally dried to 922 g/kg (Table 1).
lactating ewe experiment
[image:2.595.73.533.472.702.2]The NEl level of FOW was calculated by par-tial replacement of barley grain, wheat grain and sugar beet pulp with FOW, maize grain and SBM in rations of lactating ewes with 18 Chios dairy
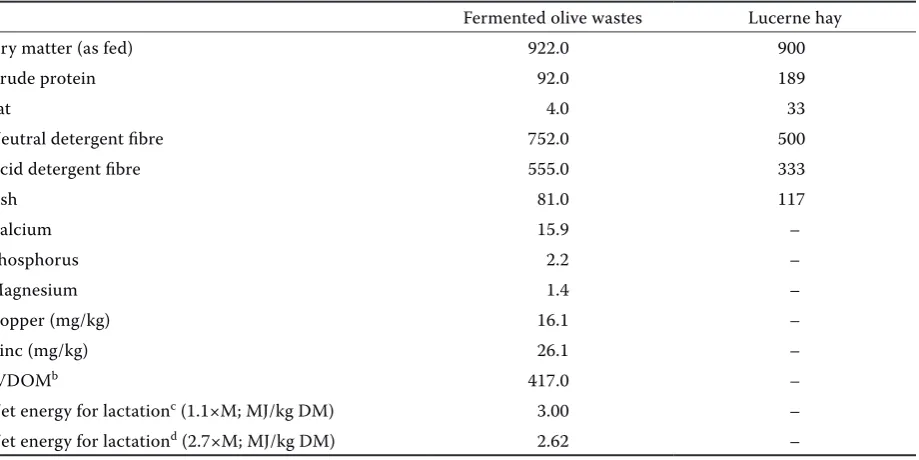
Table 1. Chemical compositiona (g/kg) of fermented olive wastes and lucerne hay (dry matter (DM) basis)
Fermented olive wastes Lucerne hay
Dry matter (as fed) 922.0 900
Crude protein 92.0 189
Fat 4.0 33
Neutral detergent fibre 752.0 500
Acid detergent fibre 555.0 333
Ash 81.0 117
Calcium 15.9 –
Phosphorus 2.2 –
Magnesium 1.4 –
Copper (mg/kg) 16.1 –
Zinc (mg/kg) 26.1 –
IVDOMb 417.0 –
Net energy for lactationc (1.1×M; MJ/kg DM) 3.00 –
Net energy for lactationd (2.7×M; MJ/kg DM) 2.62 – avalues represent duplicate assays of two samples for each material
bin vitro digestibility of organic matter
ccalculated from the equations of Van Es (1978)
ewes. All ewes were cared for according to appli-cable recommendations of the USA NRC (1996). Milk yield and body weights (BW) of the ewes were recorded both after parturition and immediately before the commencement of the study. Ewes were allocated at weaning, on day 42 after parturition, after equal distribution relative to milk yield, BW and lactation number (i.e. 2 or 3), into three groups of 6 ewes each and accommodated in six individual floor pens/groups. The mean BW at the beginning of the experiment was 53.3 ± 1.9 kg, and the milk yield
was 1 351 ± 54 g/day. All 18 pens were essentially
identical, with the same direction and covered area
(3 m2/ewe), and were equipped with similar troughs
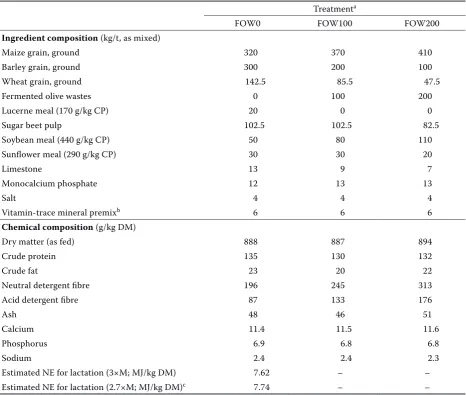
for feeding grain concentrates, hay and water. In a Youden square experimental design of four consecu-tive periods of 2 weeks each, all ewes were offered a concentrate mixture ad libitum with 0.90 kg/ewe/day (DM basis) of lucerne hay according to applicable nutrient requirements of sheep (NRC, 1985). The concentrate mixture (Table 2) for treatment FOW0 (control) had no FOW, while those for treatments FOW100 and FOW200 included 100 and 200 kg/t of FOW (on an as-fed basis), respectively.
[image:3.595.65.532.292.687.2]BWs were measured at the start and at the end of each period, and BW change was calculated. Feed
Table 2. Concentrate composition of rations for lactating ewes
Treatmenta
FOW0 FOW100 FOW200
ingredient composition (kg/t, as mixed)
Maize grain, ground 320 370 410
Barley grain, ground 300 200 100
Wheat grain, ground 142.5 85.5 47.5
Fermented olive wastes 0 100 200
Lucerne meal (170 g/kg CP) 20 0 0
Sugar beet pulp 102.5 102.5 82.5
Soybean meal (440 g/kg CP) 50 80 110
Sunflower meal (290 g/kg CP) 30 30 20
Limestone 13 9 7
Monocalcium phosphate 12 13 13
Salt 4 4 4
Vitamin-trace mineral premixb 6 6 6
chemical composition (g/kg DM)
Dry matter (as fed) 888 887 894
Crude protein 135 130 132
Crude fat 23 20 22
Neutral detergent fibre 196 245 313
Acid detergent fibre 87 133 176
Ash 48 46 51
Calcium 11.4 11.5 11.6
Phosphorus 6.9 6.8 6.8
Sodium 2.4 2.4 2.3
Estimated NE for lactation (3×M; MJ/kg DM) 7.62 – – Estimated NE for lactation (2.7×M; MJ/kg DM)c 7.74 – –
aFOW0 = control treatment, FOW100 = treatment with 100 kg/t fermented olive wastes, FOW200 = treatment with 200 kg/t
fermented olive wastes
bpremix contained 390 g/kg Ca and 81 g/kg P and supplied/kg of concentrate: 9 000 I.U. vitamin A; 3.75 mg vitamin B 1;
1 400 I.U. vitamin D3; 24.5 mg vitamin E; 0.5 mg Co; 2 mg Cu; 1.2 mg I; 30 mg Fe; 52 mg Mn; 0.24 mg Se; 80 mg Zn
intake was measured daily for each ewe. Ewes had free access to water and were machine milked twice daily at 7.00 and 18.00 h with a 2 × 24 DeLaval (Thessaloniki, Greece) milking machine. Milk yield was recorded daily for the morning and afternoon milking during days 9 to 14 for each period. Milking was conducted at a vacuum level of 42 kPa, pul-sation rate of 90/min and pulpul-sation ratio of 60/40. During 6 morning and afternoon milkings (days
9 to 14 of each period), samples for chemical ana-lyses were collected from each ewe.
chemical analyses
FOW, lucerne hay, and concentrate mixtures were analyzed for DM by drying at 102°C for 16 h
[image:4.595.64.535.251.667.2]in a forced air oven, and for crude protein (CP),
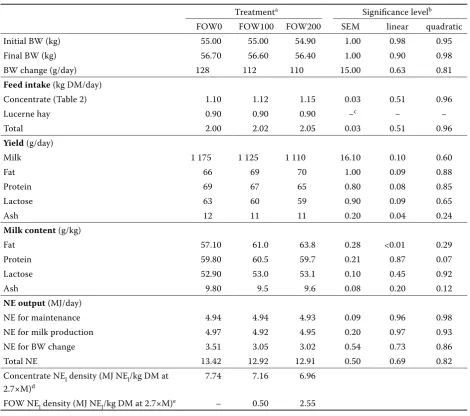
Table 3. Body weight (BW), BW change, feed intake, daily milk yield of ewes, milk composition, net energy (NE) output and concentrate NE for lactation (NEl) density during the experiment
Treatmenta Significance levelb
FOW0 FOW100 FOW200 SEM linear quadratic
Initial BW (kg) 55.00 55.00 54.90 1.00 0.98 0.95
Final BW (kg) 56.70 56.60 56.40 1.00 0.90 0.98
BW change (g/day) 128 112 110 15.00 0.63 0.81
Feed intake (kg DM/day)
Concentrate (Table 2) 1.10 1.12 1.15 0.03 0.51 0.96
Lucerne hay 0.90 0.90 0.90 −c − −
Total 2.00 2.02 2.05 0.03 0.51 0.96
Yield (g/day)
Milk 1 175 1 125 1 110 16.10 0.10 0.60
Fat 66 69 70 1.00 0.09 0.88
Protein 69 67 65 0.80 0.08 0.85
Lactose 63 60 59 0.90 0.09 0.65
Ash 12 11 11 0.20 0.04 0.24
Milk content (g/kg)
Fat 57.10 61.0 63.8 0.28 <0.01 0.29
Protein 59.80 60.5 59.7 0.21 0.87 0.07
Lactose 52.90 53.0 53.1 0.10 0.45 0.92
Ash 9.80 9.5 9.6 0.08 0.20 0.12
Ne output (MJ/day)
NE for maintenance 4.94 4.94 4.93 0.09 0.96 0.98
NE for milk production 4.97 4.92 4.95 0.20 0.97 0.93
NE for BW change 3.51 3.05 3.02 0.54 0.73 0.86
Total NE 13.42 12.92 12.91 0.50 0.69 0.82
Concentrate NEl density (MJ NEl/kg DM at
2.7×M)d 7.74 7.16 6.96
FOW NEl density (MJ NEl/kg DM at 2.7×M)e – 0.50 2.55
aFOW0 = control treatment, FOW100 = treatment with 100 kg/t fermented olive wastes, FOW200 = treatment with
200 kg/t fermented olive wastes
bnumbers are probability values
cdue to the equal limit feeding among treatments, no statistical analysis was done dassumes NE
l of lucerne hay to be 5.32 MJ/kg DM at 3×M and 5.45 MJ/kg DM at 2.7×M eassumes NE
l of concentrate feeds to be the same as those used to estimate the NEl level of the control concentrate in Table 2,
fat and ash according to methods 976.06, 920.39, and 942.05 of AOAC (1990), respectively. Neutral detergent fibre (NDF) and acid detergent fibre (ADF) were determined according to Van Soest et al. (1991). NDF was analyzed without sodium sulphite or alpha amylase, and NDF and ADF were expressed without residual ash. FOW were also analyzed for Ca, Cu, Mg and Zn according to method 968.08 and for P according to method 965.17 of AOAC (1990).
In vitro digestibility of organic matter (OM) in DM (IVDOM) of FOW was determined according to Tilley and Terry (1963), as modified by O’Shea and Wilson (1965), for 96 h.
Milk samples were analyzed for fat, protein, lactose and solids-not-fat (SNF) with IR spectros-copy (Milkoscan 4000; TESCO, Denmark) accor-ding to method 972.16 of AOAC (1990). Ash was calculated as SNF minus protein and lactose.
energy calculations
The NEl content of FOW was calculated by the equations of Van Es (1978) to be 3.00 MJ NEl/kg DM at approximately 1.1×M. However, based upon a Van Soest et al. (1984) discount of 0.08 per unit maintenance (estimate from feeds with similar NDF levels) from equations of Van Es (1978), the NEl content of FOW was calculated to be 2.62 MJ NEl/kg DM at 2.7×M.
The NE requirements of lactating ewes (i.e. NE for maintenance, NE for milk production and NE for BW change) were estimated according to McDonald et al. (1990). For the milk production NE requirement, the average day in milking used was 70.
The NEl density of the control diet (Table 2) was calculated using the NEl values of concentrate feeds based upon the most recent NRC (2001) feed tables at 3×M, and increased slightly to 2.7×M by extra-polating the values listed at 3×M and 4×M, as this was the actual average NE intake of the ewes in the study.
The NEl density of lucerne hay was estimated from NRC (2001) tables by matching its NDF, ADF and CP values to table values which suggested the NEl value of 5.32 MJ/kg DM at 3×M and 5.45 MJ/kg DM at 2.7×M. Based upon the measured NE output of the ewes and the NEl estimate of the lucerne hay, the actual NEl density of the concentrate was esti-mated. The calculated and estimated NEl density
of the concentrate was 7.74 MJ/kg DM from both procedures, which allowed the NEl density of FOW in both FOW diets to be estimated by assuming that the NEl values of all other feeds in the FOW100 and FOW200 diets were the same as in the FOW0 diets, and that residual NEl could be attributed to the FOW. These values are listed by treatment (i.e. FOW100 and FOW200) in Table 3.
statistical analysis
Performance of ewes, milk composition, NE output and concentrate NEl density were statis-tically analyzed by one-way analysis of variance. Differences between treatment means were tested using linear and quadratic contrasts at the 5% pro-bability level (Steel and Torrie, 1980). Statistical analysis used the SPSS (1999).
results
Analysis of feeds and diets
The chemical composition of FOW is in Table 1, and that of lucerne hay is consistent with NRC (2001) values. The diets were formulated to be similar in all nutrients, but this was not possible due to the high NDF level of FOW. However, due to the NEl estimation technique used for FOW, this was not essential and increases in NDF and ADF occurred as the levels of added FOW increased.
lactating ewe experiment
There were very few feed refusals, and the feed consumption of the concentrate and lucerne was similar among diets with increasing FOW inclusion levels (Table 3).
Overall BW and BW change of the ewes were not affected by treatments (Table 3), and milk, fat, pro-tein and lactose yield, and milk propro-tein, lactose and ash content were not affected either (Table 3). In contrast, milk ash yield decreased linearly (P = 0.04) and milk fat content increased linearly (P < 0.01) with increasing level of FOW in the concentrate.
discussioN
FOW are a low CP feed that has high NDF and ADF levels and can be a good source of Ca, Mg, Cu and Zn, and a moderate source of P. Although it is known that the microbial fermentation of feeds can enrich them with vitamins, enzymes and growth factors (Israilides et al., 1994), this was not exa-mined.
The measured performance parameters of ewes were largely unaffected by increasing the feeding level of FOW, maize grain and SBM in replacement for barley grain, wheat grain, sugar beet pulp and lucerne meal. However, milk, protein and lactose yields tended (P < 0.10) to decrease linearly.
The estimated NEl density of FOW differed between the FOW100 diet, where it was calcu-lated to be only 0.50 MJ/kg DM, and the FOW200 diet where it was calculated to be 2.55 MJ/kg DM (both at 2.7×M). The technique we used to estimate the NEl density of feeds allocates all unaccounted NE output to the unknown feed (in this case FOW) and so the error associated with the NEl estimate tends to be reduced as the level of the unknown feed in the diet increases. However low-quality feeds, similarly like unknown feeds, may substanti-ally reduce the animal’s intake and/or performance if included in the diet at levels that are too high, and so impact the estimated NE output by causing high losses of BW. As the calculation technique is designed to estimate the NEl of the unknown feed, as its NEl density is not known a priori, its most appropriate levels to add to the diet can only be surmised. In this case, it would appear that the FOW100 diet contained a too low incorporation level to gain an accurate estimate of the NEl value of FOW, while the incorporation level of FOW in the FOW200 diet may have been more appropriate.
coNclusioNs
Partial replacement of barley grain, wheat grain, sugar beet pulp and lucerne meal with fermented olive wastes, maize grain and soybean meal in diets of lactating ewes resulted in similar productive per-formance, although there were trends to reducti-ons. There is no evidence that the calculation of 3.00 MJ/kg DM at approximately 1.1×M NE intake for FOW (or 2.62 MJ/kg DM at 2.7×M assuming a 0.08 discount per unit maintenance (estimate from feeds with similar NDF levels as listed by Van Soest
et al., 1984)) based upon the equations of Van Es (1978) is too low for modern FOW, as the best esti-mate from this study is 2.55 MJ/kg DM at 2.7×M NE intake. FOW will likely be of limited value in rations of high producing lactating ewes due to its low protein, high fibre and low NEl levels.
Acknowledgements
The authors thank the staff of the Animal Re-search Institute, N.AG.RE.F. (Giannitsa, Greece), and especially Mr. K. Liapoura for help during this study. The authors also thank Mrs. Efi Theodoridou (MEVGAL, SA, Koufalia, Thessaloniki, Greece) for help in milk analysis.
reFereNces
AOAC (1990): Official Methods of Analysis of the AOAC. Helrich K. (ed.): 15th ed. Association of Official
Ana-lytical Chemists, Inc., Arlington, VA, USA.
Israilides C.J., Iconomou D., Kandylis K., Nikokyris P. (1994): Fermentability of sugar beet pulp and its acceptability in mice. Bioresour. Technol., 47, 97–101. Israilides C.J., Vlyssides A.G., Mourafeti V.N., Karrouni
G. (1997): Olive oil wastewater treatment with the use of an electrolysis system. Bioresour. Technol., 61, 163–170.
Israilides C.J., Vlyssides A.G., Pashalides C., Dimirkou A., Papadopoulos P., Couloubis P., Iconomou D., Papayan-nopoulou D., Giouzelyannis A., Christodoulou V. (2000): Utilization of composted olive stone wooden residue with olive mill waste waters as a soil conditioner. In: Inter. Conf. Protection and Restoration of the Environment. 3–6 July, Thassos, Greece, 561–568. McDonald P., Edwards R.A., Greenhalgh J.F.D. (1990):
Animal Nutrition. 4th ed. Longman Scientific and
Tech-nical, Essex, England, 368.
NRC (1985): National Research Council. Nutrient Requirements of Sheep. 6th rev. ed. National Academy
Press, Washington DC, USA.
NRC (1996): National Research Council. Guide for the Care and Use of Laboratory Animals. National Aca-demy Press, Washington DC, USA.
NRC (2001): National Research Council. Nutrient Requirements of Dairy Cattle. 7th rev. ed. National
Aca-demy Press, Washington DC, USA.
SPSS (1999): Statistical Package for the Social Sciences. Release 10.0. SPSS Inc., Chicago, USA.
Steel R.G.D., Torrie J.H. (1980): Principles and Procedu-res of Statistics. A Biometrical Approach. 2nd ed.
McGraw-Hill Book Co., New York, USA.
Tilley J.M.A., Terry R.A. (1963): A two-stage technique for the in vitro digestion of forage crops. J. Brit. Grsld. Soc., 18, 104–111.
Van Es A.J.H. (1978): Feed evaluation for ruminants. I. The systems in use from May 1977 onwards in the Netherlands. Livest. Prod. Sci., 5, 331–345.
Van Soest P.J., Fox D.G., Sniffen C.J. (1984): Discounts for net energy and protein. In: 4th ed. Proc. Cornell
Corresponding Author
Dr. Vladimiros F. Christodoulou, Animal Research Institute, National Agricultural Research Foundation, 58 100 Giannitsa, Greece
Tel. +30 2382 031700, fax +30 2382 032 332, e-mail: [email protected]
Nutr. Conf. Feed Manuf. Dept. of Anim. Sci., Cornell University, Ithaca, USA, 121–136.
Van Soest P.J., Robertson J.B., Lewis B.A. (1991): Methods for dietary fiber, neutral detergent fiber, and nonstarch polysaccharides in relation to animal nutrition. J. Dairy Sci., 74, 3583–3597.
Vlyssides A.G., Loizides M., Karlis P.K. (2004): Integrated strategic approach for reusing olive oil extraction by-products. J. Cleaner Prod., 12, 603–611.