Central Europe is not frequently thought of as a particularly drought-prone region in the European context, perhaps with an exception of the Panonian basin. The latter covers, among other areas, Eastern Austria, parts of Southern Slovakia and a large part of Hungary. A high vulnerability to the devastat-ing effects of droughts is typically associated with arid climatic regions, (e.g. Mediterranean, African Sahel, or, recently, Australia), but rarely with the Czech Republic. However, we should be aware that in Central Europe drought episodes have played an important role since the early Neolith when relatively short drought periods significantly influenced the location of early settlements (Kalis et al. 2003), and have been a part of our climate up to present time (Blinka 2005, Tolasz et al.2007). In the past 100 years, this region faced so-called
“green droughts”. These droughts are associated with relatively ample annual rainfall amounts (es-pecially compared to the arid regions) but reduced agricultural productivity due to poorly timed rains. The most severe drought was recorded in 1947; less pronounced ones appeared in 1976 and 1935 (Možný 2004). A recent wave of drought episodes was experienced throughout Central Europe dur-ing 2000, 2001 and 2003. The drought of 2000 was relatively short in duration (covering the months of April and May) but had a significant impact, especially on the early-sown spring crops. The last event of 2003, which was even much more pronounced in neighboring regions of Germany, Switzerland and Austria, clearly demonstrated that prolonged periods of rainfall deficit, combined with extremely high summer temperatures, might
Agricultural drought and spring barley yields
in the Czech Republic
M. Trnka
1, P. Hlavinka
1, D. Semerádová
1, M. Dubrovský
2, Z. Žalud
1, M. Možný
31
Institute of Agrosystems and Bioclimatology, Mendel University of Agriculture
and Forestry in Brno, Czech Republic
2
Institute of Atmospheric Physics, Academy of Sciences of the Czech Republic, Prague,
Czech Republic
3
Agrometeorological Observatory in Doksany, Czech Hydrometeorological Institute,
Prague, Czech Republic
ABSTRACT
The relationship between detrended district yields of spring barley (1961–2000) and meteorological drought was as-sessed by Palmer Z-index. We found that the seasonal water balance (April–June) significantly (P = 0.05) influences the spring barley production in 51 out of 62 evaluated districts. Coefficients of correlation varied in individual dis-tricts from 0.19 to 0.70, with the highest values being found in southern Moravia. Data analysis revealed the pres-ence of six distinct groups of districts with a specific drought-yield relationship. The most drought-sensitive cluster included five districts in the South East of the country. On the other hand, the districts in Northern Moravia and Silesia belong among the least sensitive to agricultural drought. The study also defined threshold values of seasonal drought (sums of relative Palmer Z-index lower than –8 and –10, respectively), below which medium to severe spring barley yield reductions are very likely, regardless of the district of occurrence.
Keywords:Hordeum vulgare L.; Palmer Z-index; climatic conditions; yield; drought
influence the full range of ecosystem services. The scope of such influence may vary from the elimination of fodder production (Schaumberger et al. 2006) to the negative carbon sequestration of European biosphere (Ciais et al. 2005).
While the effects of droughts are relatively well known, a proper working definition of drought is less clear. A drought is a complex phenomenon that is difficult to accurately describe because its definition is both spatially variant and con-text-dependent. Based on the prevailing impacts, drought can be classified into four categories: meteorological, agricultural, hydrological and socio-economical (e.g. Heim 2002). In this paper, we focus mainly on the agricultural drought. We adopt a concept, as introduced by Palmer (1965) and Quiring and Papakryiakou (2003), which de-fines agricultural drought as “an interval of time, generally on the order of months or whole season, when the moisture supply of a region consistently falls below the climatically appropriate moisture supply required for crop production. This results in adverse effects on farming activities”.
In most of the studies some type of drought index is employed to quantify the dryness of the evaluated periods. These quantifications can de-tect the onset and measure the severity of drought events in time, and allow a comparison of moisture supply conditions between regions (Alley 1984). Drought indices can be useful tools for providing information for decision-makers in business and government, and also to public stakeholders. Thus, numerous drought indices have been developed (see e.g. Heim 2002 for review, Keyantash and Dracup 2002, Quiring and Papakryiakou 2003). The most credible indices used worldwide include the Standardized Precipitation Index (SPI, de-veloped by McKee et al. 1993), and the Palmer Drought Severity Index and Palmer Z-index
(PDSI and Z-index, respectively), developed by Palmer (1965). Based on previous research (e.g. Brázdil et al. 2007, Tolasz et al.2007), as well as on the results of other authors (e.g. Quiring and Papakryiakou 2003, Scian 2004), we chose the Z-index as the most appropriate indicator for measuring agricultural drought on a monthly and seasonal basis in the Czech Republic.
We are aware that crop production might be nega-tively affected by the moisture deficit on a scale shorter than seasons or months, but this will be a part of separate investigation using a very different set of tools (e.g. mechanistic or parsimonious crop models). The main objective of this study is to assess whether an occurrence of a seasonal agricultural drought has
any quantifiable influence on the production of the major spring cereal (i.e. spring barley) in various regions of the Czech Republic.
MATERIAL AND METHODS
Z-index description
The Z-index was developed by Palmer (1965) and has been widely used in various regions of the world (Alley et al.1984, Karl et al. 1987, Ntale and Gan 2003, Tolasz et al. 2007). The Z-index is derived using a soil moisture/water balance algorithm that requires a time series of monthly air temperature and precipitation data and information on the maximum soil water holding capacity (MSWHC) in the rooting zone. Soil moisture is handled by dividing the soil into two layers. The top layer has a retention capacity of 25 mm and moisture is not transferred to the second layer until the top one is saturated. Runoff does not occur until both soil layers are saturated. Potential evapotranspiration (PE) is calculated using the Thornthwaite (1948) method and water is extracted from the soil by evapotranspiration when PE > P (where P is the precipitation for the month). Evapotranspiration loss from the soil surface layer (Ss) is always as-sumed to take place at the potential rate. It is also assumed that the evapotranspiration loss from the underlying layer of the soil (Su) depends on the initial moisture conditions in the layer, PE, and the combined available water content in both layers.
The Z-index is a measure of the monthly moisture anomaly and reflects the departure of moisture con-ditions from normal (or climatically appropriate) moisture conditions in a particular month (Heim 2002). The first step in calculating the monthly moisture status (Z-index) is to determine the mean values of evapotranspiration, runoff, and soil moisture loss, and recharge rates based on at least a 30-year time series. A water balance equation is subsequently applied to derive the expected precipitation. The monthly departure from this expected level of soil moisture, d, is determined by comparing the expected precipita-tion to the actual precipitaprecipita-tion. The Z-index, Zi, is then the product of d and a weighting factor K
for the month i.
Zi = di.Ki (1)
and then adjusted by a regional correction factor. The original method of Z-index calculation relies on empirical constants, soil property assumptions, and climate characteristics. The index was derived by Palmer in 1965 using data from nine stations in Kansas and Iowa (USA). In this study, the so-called self-calibrated version (Wells et al. 2004) of the Z-index was used, in which the original Palmer’s model is modified to automatically adjust the former empirical constants according to the input data uniquely derived from each studied location.
Data
The present study takes advantage of the cli-matological dataset collected during the period 1961–2000 at 233 stations (Figure 1a) that was used in the Climate Atlas of Czechia (Tolasz et al. 2007). This dataset resulted from a concerted effort between the Czech Hydrometeorological Institute and the National Climate Program of the Czech Republic. The final set of 233 stations (1 per 335 km2) was selected from the total of 782 stations according to the quality and com-pleteness of observations. The data were homog-enized and checked for consistency before being included in the Climate Atlas of Czechia (Tolasz et al. 2007). The stations are spread in altitudes between 157 and 1490 m above sea level with the mean altitude of the stations being 435 m. This is close to the country’s mean altitude (430 m) recorded in the Czech Statistical Office yearbook (2005). The warmest month is usually July, while January or February being the coldest. The summer season (June–August) is typically characterized with the highest precipitation amounts accounting for 37% of annual totals (ranging from 27 to 43%) on average. Conversely, winter months are those with lowest rainfall, which accounts for around 18% of the annual precipitation (from 11 to 28%). Winter is followed by fall and spring with respect to sum of precipitation.
The climatological data were complemented with values of the MSWHC with 1 km2 resolution. This parameter was estimated using a combination of digitalized maps of soil types (Tomášek 2000) and detailed soil physics data from 1073 soil pits collected during the Czech National Soil Survey. For each of the 25 soil types, a mean value of MSWHC was determined as an average of the maximum water holding capacities of all soil pits of a particular soil type in the database. The
MSWHC of the individual soil types ranges from 137 to 302 mm and was determined at each soil pit by the weighed soil water holding capacities of individual soil horizons, up to the maximum rooting depth.
The Z-index values used in the study were cal-culated for each of the 233 stations for the period 1961–2000 using the modification proposed by Trnka et al. (2007). In order to better describe drought climatology of a particular region, the calculation procedure of the Palmer Z-index was modified and is referred to as the “relative Z-index” (rZ-index). In this version the empirical coefficients (namely the K value) are based on 9320 years of data, i.e. a set of all monthly-observed values from 233 stations covering the Czech Republic during the period 1961–2000. In the following step, the departure from normal moisture levels (d) was calculated for each station. The resulting rZ-in-dex value enabled us to distinguish differences between drought severities of a particular event at individual sites from the perspective of the whole Czech Republic for the 1961–2000 period. For each month in the series (a total of 480 months in the 1961–2000 period), the value of the Z-index was interpolated for the whole territory of the Czech Republic using a co-krigging interpolation tech-nique (with altitude and MSWHC as additional co-variables). The monthly value of the rZ-index for each individual district, and only for the grids of arable land, was then calculated as the spatial average of the rZ-index values. The extension of the arable land was based on the Corine land cover 2000 (EEA 2005), while the altitude was derived from SRTM 3 arc second digital raster elevation (http://srtm.usgs.gov).
Spring barley (Hordeum vulgare L. conv. distichon
Figure 1a. Map of the 233 climatic stations (dots) used for the calculation and interpolation of monthly rZ-index values. The color shading depicts the maximum soil water holding capacity (mm) used for the rZ-index calcula-tions
Figure 1b. Map of 77 districts (and their abbreviated names). The light shaded area stands for the arable land in each district (NUTS4) that was only considered for subsequent climate related analyses. The dark-gray shaded regions were excluded completely as spring barley yields data were available either only for small portion of the evaluated period or on the insignificant acreage
[image:4.595.96.512.413.697.2]the methodology for collecting spring barley data at CSO did not substantially change throughout the whole period.
The original yield data were detrended by regress-ing the average annual yield against the year-of-harvest for each crop district (Figure 2). However, the two driest and the two wettest seasons were al-ways excluded from the trend calculations. Positive trends in annual yield up to 1990 might be explained mostly by increasing fertilization, plant breeding and farm innovation (Chloupek et al. 2004). The overall yield decline in the 1990’s was most likely influenced by a range of factors related to the overall transformation of the farming industry. This transformation was driven mainly by lower demand for fodder and the associated decrease in the production intensity (i.e. lower levels of fertilization and plant protection etc.) and is be-yond the scope of this study. The characteristics of time trends were very similar in all districts, and were in all cases highly significant (r = 0.62–0.93). The detrending procedure resulted in values of unstandardized residuals (hereafter referred to as yield departures) calculated for each district that were used in the subsequent analyses.
Evaluation of the agricultural drought
The analysis of the agricultural drought was carried out in two stages. During the first step a growing season rZ-index variable was created by summing up monthly values of the index from
April to June. Although other combinations of drought index variables were tested, including those related to antecedent moisture conditions (during the winter/spring prior to planting) and peak summer (July and August) moisture condi-tions, none of these combinations significantly improved the spring barley models. Our results are in accordance with findings reported by Arora et al. (1987), Petr et al. (1987), Quiring and Papakryiakou (2003) and Zimolka et al. (2006) who determined that spring cereal yield is sensitive to moisture stress during emergence, shooting, heading and early soft dough stages that usually take place in the period of April to June. The growing season drought index variable was used to develop the 2nd order polynomial regression-based spring barley yield models for each crop district (i.e. 62 individual crop models). Each model was de-rived using a second-order polynomial fitted to the data, where the independent variable was a grow-ing season rZ-index and the dependent variable was the yield departure for that crop district. The regression function (using a second order poly-nomial) was used to determine the spring barley yield models because it closely approximates the nature of the crop-yield water relationship (Ash et al. 1992). Further tests showed no improvement of the model results when higher order polyno-mials were used and are in accordance with the findings of Yamoah et al. (2000) and Quiring and Papakryiakou (2003).
[image:5.595.135.461.508.714.2]The relationship between agricultural drought and spring barley yields was then evaluated using
Figure 2. Spring barley yield (kg/ha) for Znojmo district (1961–2000). The dotted line indicates the trend (R2 = 0.65), which was removed from the yield data prior to analysis. The gray circles represent detrended yield
departures used in the subsequent analyses
Fig_2
Page 1 R2 = 0.65
a simple regression technique, with the goal of testing whether drought does or does not contrib-ute significantly to yield variability. At first, the districts where agricultural drought could explain significant part of yield departures were determined using one of the most common approaches of the coefficient of determination (R2) and its second root (Pearson correlation coefficient). The R2 de-scribes the proportion of the total variance in the observed data that can be explained by the rZ-index value with rather straightforward meaning (an
R2 of 0.3 indicates that variability of the drought index explains 30% variability in the observed data). We realize that although R2 and r-values are frequently used, they are by no means a fail-proof method as they are sensitive to outliers (Willmott 1984, Legates and McCabe 1999). This was taken into account during evaluation of the results. The critical values of Pearson correlation coefficient were based on the Student t distribution and were determined at α = 0.01 and α = 0.05 using a well-known technique (e.g. Nosek 1972).
To better assess local differences in the drought-yield relationship, an additional technique was used. All 62 districts with substantial spring barley production were grouped into six homogenous groups according to the time series of the
rZ-in-dex during April–June of 1961–2000. (We used a well-established hierarchical clustering method known as Ward’s minimum variance, as it is avail-able in the SPSS v. 14.0 software package). In each group, the yield departures were ranked in ascending order and the mean values from these ranks were calculated for the three driest years on the record in each cluster. If the district yields are negatively influenced by drought the mean of the ranks would tend to be close to 1, while a neutral influence of drought over the yield would result in the mean of ranks being close to 20. This analysis was followed by an attempt to establish an effect of the severe drought episodes on the spring barley yields using the pooled data from all 62 districts analyzed.
RESULTS AND DISCUSSION
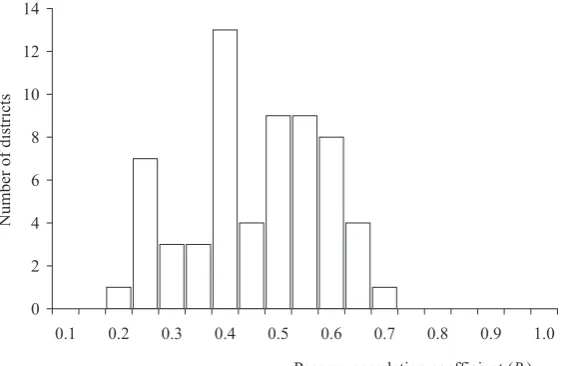
[image:6.595.96.505.446.718.2]The key results for all 62 districts included in the analysis are summarized in Figure 3. In 51 out of 62 districts we found a statistically significant correlation at α = 0.05 between the rZ-index value (summed up from April to June) and the spring bar-ley yield departures. In 35 districts this correlation is significant at α = 0.01. As Figure 4 shows, most
Figure 3. The map represents a spatial distribution of the districts in which spring barley yield departures are statistically significantly correlated with the rZ-index values
Not analyzed
No statistical significance
P = 0.05; r = 0.312–0.401
P = 0.01; r = 0.402–0.500
of the Pearson correlation coefficient values range between 0.4 and 0.7. However, only in 23 cases the seasonal rZ-index is capable of explaining more than 25% of the yield departure variability. Only in the Brno-venkov district more than 50% of this variability is explained. Two thirds of the districts where no correlation between the rZ-index and yield departures was found are situated in the north-eastern part of the country. This region ranks among the key spring barley growing areas, accounting for about 15% of total acreage, and is highly suitable for malting barley production (Zimolka et al. 2006). Despite a relatively weak correlation, Figures 3 and 4 illustrate that seasonal fluctuations of water balance exert some influence over the variability of spring barley yield depar-tures. However, the variability explained by water stress is rather low and suggests the influence of other factors. An obvious conclusion is that other factors than a seasonal lack of soil moisture are limiting production. These will probably include other weather variables (e.g. suboptimum or ex-tremely high temperatures), soil fertility, quality and timing of the main field operations, the pres-ence or abspres-ence of pest/diseases and/or the amount of fertilizers applied. Our findings are contrary to those reported by Quiring and Papakryiakou (2003) and Scian (2004) for drier climatic regions, where rather crude drought indicators could be used to reliably predict yields. On the other hand, the presented results clearly demonstrate that, at least in some areas of the CR, drought remains an important factor and that some form of continuous
monitoring of this hydrometeorological condition should be introduced.
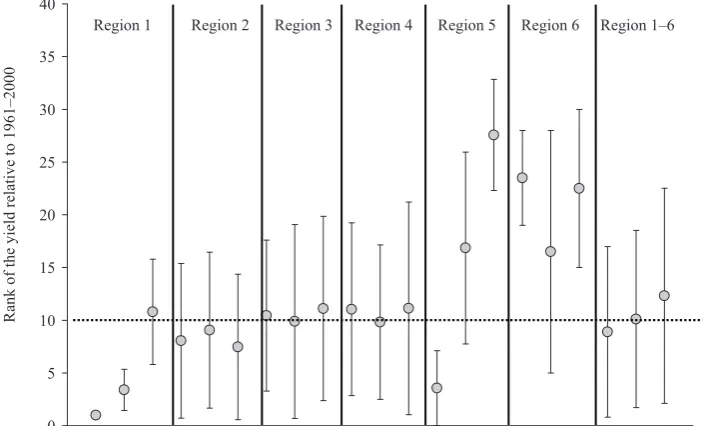
[image:7.595.161.443.512.695.2]Figure 3 also depicts startling differences between regions. This is caused mostly by the local vari-ability in climate, soil conditions and the overall level of agriculture practice during the evaluated period. The non-existent or very low correlations between the rZ-index and yield departures in the north-east and north-central regions are associated with comparably higher precipitation totals and a much lower probability of significant drought occurrence in these regions generally (Trnka et al. 2007, Tolasz et al. 2007). In order to capture the varying effects of drought in different regions, we carried out a specific analysis consisting of assigning the individual districts (Figure 5a) into six clusters. These regions show a relatively high degree of internal similarity in their drought pat-terns. Figure 5b shows that in Region 1, the highest negative yield departures were associated with the driest season in all districts. Also, the second and third driest season lead to a pronounced de-crease of the yield. Somewhat similar behavior was found in the case of Regions 2–4, where three driest seasons on record were, in general, asso-ciated with below average yields. However, the effect was by no means as severe as in Region 1. Region 5, representing the northern Moravia and Silesia regions, shows rather specific behavior; the drought exerted here a strong influence over the yield departures only in the driest season (i.e. year 2000), while in the other two evaluated dry seasons the grain production was mostly above
Figure 4. The histogram shows the distribution of Pearson correlation coefficients (r) obtained when corre-lating rZ-index and spring barley yield departures in individual districts. In the majority of the districts the spring barley yield departures are significantly correlated with the drought both at α = 0.05 (51 out of 62) and at α = 0.01 (35 out of 62)
0 2 4 6 8 10 12 14
0.1 0.2 0.3 0.4 0.5 0.6 0.7 0.8 0.9 1.0
Pearson correlation coefficient (R)
N
average. It is not surprising that Region 6 (rep-resenting the wettest and coldest regions in the database) shows only marginal influence of dry years on spring barley yields. In some seasons the spring barley yields in Region 6 are actually favored by a drought occurrence, as this usually
means higher seasonal global radiation (and higher temperatures) that might enhance spring barley growth (Lekeš et al. 1985).
[image:8.595.94.497.61.313.2]The final analysis focused on the effect of the most extreme events, rather than assessment of drought-yield relationship in individual districts Figure 5a. Regionalization of the 62 districts with significant spring barley production according to their drought characteristics (based on the time series of rZ-index during the period 1961–2000)
Figure 5b. Mean rank of the yield departures in three driest seasons during the 1961–2000 period in each district in individual regions. The values close to 1 signal that the most negative yield departures (i.e. extremely low yields) are obtained during dry seasons. The values close to 20 signal that even during three driest seasons in the district no significant change of the mean yield levels is to be expected. The values above 30 indicate that yields during dry years tend to be significantly higher than average
0 5 10 15 20 25 30 35 40
Region 1 Region 2 Region 3 Region 4 Region 5 Region 6 Region 1–6
R
an
k o
f t
he
y
ie
ld
re
la
tiv
e t
o 1
96
1–
20
[image:8.595.122.475.472.685.2]Figure 6b. Mean spring barley yield departure for each category of drought during the period 1961–2000 in 62 districts with significant spring barley growing area
(Figure 6). As the probability of extreme events is by nature low, data for the whole period were pooled together to create a sufficiently large da-tabase (n = 2480 – i.e. 40 seasons at 62 districts). This type of analysis enables us to demonstrate that finally, under the present climate conditions, only extremely dry seasons lead to a significant reduc-tion of the spring barley yields. This is underscored in Figure 6a, which indicates a sharp increase in probability of the significant yield departures when the rZ-index of April–June sum is lower than –8. When the rZ-index drops below –10 (as
happened only in 6 cases out of 2480), crop failure at the district level seems to be inevitable. Even though the frequency of such extreme drought in the record is low, the effect on the spring barley yield tends to be detrimental. Figure 6b demon-strates the decreasing trend of the mean yield departures with increasing intensity of drought. The higher intensity of drought leads not only to extremely high negative yield departures, but also to a decrease in the variability of the yield response as severe droughts impair spring barley production under any soil conditions. In general, Figure 6a. Probability of spring barley yield departure below three given thresholds for different drought intensi-ties (based on the data collected in1961–2000)
Pr op or tio n of y ie ld s w ith th e gi ve n yi el d de pa rt ur e (% ) 0 10 20 30 40 50 60 70 80 90 100 < –1 0 –9 to – 10 –8 to – 9 –7 to – 8 –6 to – 7 –5 to – 6 –4 to – 5 –3 to – 4 –2 to – 3 –1 to – 2 –1 to 0
Yield departure by more than 500 kg/ha
Yield departure by more than 1000 kg/ha
Yield departure by more than 1500 kg/ha
the tendency for lower yields becomes clear when the district value of rZ-index drops below –5, and is particular obvious for values lower than –8. The analyses presented in Figures 5 and 6 underscore that, despite the finding that drought is not a decisive factor determining crop yield in most of the seasons, it can cause crop failure even under the generally favorable climate conditions of the Czech Republic.
The importance of the presented results for farm-ers, and decision-makers in general, becomes more obvious when we take into account the present and expected trends in the main weather variables that influence drought frequency and severity. The detailed analysis of drought trends across a large number of weather stations in the Czech Republic (Trnka et al. 2007, Brázdil et al. 2007) showed the tendency for more intensive droughts at the majority of the analyzed stations. According to most climate change scenarios, an increase of air temperature over Central Europe (which is accom-panied by lower precipitation in summer months in some cases) should be anticipated (e.g. Dubrovský et al.2005a). Therefore, it is very likely that the frequency of drought spells and their severity will increase, at least during some years. As is shown by Dubrovský et al.(2005b) and Brázdil et al.(2007), the probability of the rZ-index sum (April–June) being lower than –10 will have increased many-fold by 2050 compared to the 1961–2000 period. It will have adverse consequences for some farm-ing activities, will counteract the expected posi-tive effects of a longer growing season or higher ambient CO2 concentrations, and will lead to an undesired decrease in yield stability and a higher chance of crop failure.
Acknowledgements
The authors sincerely thank Mgr. Peter Štěpánek Ph.D. for preparation of the necessary monthly weather series for initial Z-index calculations, and Bc. Iveta Horáková for her diligent control of statistical data and her help in data analysis, and to an anonymous reviewer whose suggestions contributed to the text clarification.
REFERENCES
Alley W.M. (1984): The Palmer drought severity index: limitations and assumptions. J. Clim. Appl. Meteorol.,
23: 1100–1109.
Arora V.K., Prihar S.S., Gajri P.R. (1987): Synthesis of a simplified water use simulation model for predicting wheat yields. Water Resour. Res., 23: 903–910. Ash G.H.B., Shaykewich C.F., Raddatz R.L. (1992):
Moisture risk assessment for spring wheat on the eastern prairies: a water-use simulation model. Clim. Bull., 26: 65–78.
Blinka P. (2005): Climatological evaluation of drought and drought episodes in the Czech Republic between 1876 and 2002. Meteorol. J., 58. (In Czech)
Brázdil R., Kirchner K., Voženílek V. (eds.) (2007): Atlas of Extreme Events in the Moravia and Silesia. (submitted) (In Czech)
Chloupek O., Hrstkova P., Schweigert P. (2004): Yield and its stability, crop diversity, adaptability and re-sponse to climate change, weather and fertilization over 75 years in the Czech Republic in comparison to some European countries. Field Crop Res., 85: 167–190.
Ciais P., Reichstein M., Viovy N., Granier A., Ogée J., Allard V., Aubinet M., Buchman N., Bernhofer C., Carrar A., Chevallier F., De Noblet N., Friend A.D., Fiedlingstein P., Grünwald T., Heinesch B., Keronen P., Knohl A., Krinner G., Loustau D., Manca G., Mat-teucci G., Miglietta F., Ourcival J.M., Papale D., Pi-legaard K., Rambal S., Seufert G., Soussana J.F., Sanz M.J., Schulze E.D., Vesala T., Valentini R. (2005): Eu-rope-wide reduction in primary productivity caused by the heat and drought in 2003. Nature, 437: 529–533. Czech Statistical Office (2005): Statistical Yearbook of
the Czech Republic. Scientia, Praha.
Dubrovsky M., Nemesova I., Kalvova J. (2005a): Un-certainties in climate change scenarios for the Czech Republic. Clim. Res., 29: 139–156.
Dubrovsky M., Trnka M., Svoboda M., Hayes M., Wil-hite D., Zalud Z., Semeradova D. (2005b): Drought Conditions in the Czech Republic in Present and Changed Climate. In: EGU 2005, Vienna.
European Environmental Agency (2005): Corine Land Cover 2000 – Mapping a Decade of Change. EEA Publishing Office, Copenhagen.
Heim RR. (2002): A review of twentieth-century drought indices used in the United States. B. Am. Meteorol. Soc., 83: 1149–1165.
Kalis A.J., Merkt J., Wunderlich J. (2003): Environmental changes during the Holocene climatic optimum in central Europe – human impact and natural causes. Quarternary Sci. Rev., 22: 33–79.
Karl T., Quinlan F., Ezell D.S. (1987): Drouht termina-tion and amelioratermina-tion: its climatological probability. J. Appl. Clim., 26: 1198–1209.
Legates D.R., McCabe G.J. (1999): Evaluating the use of “goodness-of-fit” measures in hydrologic and hy-droclimatic model validation. Water Resour. Res.,
35: 233–241.
Lekeš J. (ed.) (1985): Barley. SZN, Prague. (In Czech) McKee T.B., Doesken N.J., Kleist J. (1993): The
rela-tionship of drought frequency and duration to time steps. Preprints. In: 8th Conf. Applied Climatology,
Anaheim, California: 179–184.
Možný M. (2004): Evaluation of drought in the Czech Republic. In: Rožnovský J., Litchman T.: Weather and Climatic Extremes. Brno, 11.3.2004. Available at: http://www.chmi.cz/meteo/CBKS/index.htm. (In Czech)
Nosek M. (1972): Methods in Climatology. Academia, Prague. (In Czech)
Ntale H.K., Gan T.Y. (2003): Drought indices and their application to East Africa. Int. J. Climatol., 23: 1335–1357.
Palmer W.C. (1965):Meteorological drought. Office of Climatology Research Paper No. 45, U.S. Weather Bureau: 58.
Petr J. (ed.) (1987): Weather and Yields. SZN, Prague. (In Czech)
Quiring S.M., Papakryiakou T.N., (2003): An evalua-tion of agricultural drought indices for the Canadian prairies. Agr. Forest Meteorol., 118: 49–62.
Schaumberger A., Trnka M., Eitzinger J., Formayer H., Bartelme N. (2006): Monitoring drought impact over Austria grasslands using GIS based modeling. In: EGU 2006, Vienna.
Scian B.V. (2004): Environmental variables for model-ing wheat yields in the southwest pampa region of Argentina. Int. J. Biometeorol., 48: 206–212. Thornthwaite C.W. (1948): An approach towards
a rational classification of climate. Geogr. Rev., 38: 55–94.
Tolasz R., Míková T., Valeriánová A., Voženílek V. (eds) (2007): Climatic Atlas of Czechia. ČHMÚ, Prague: 256. (In Czech)
Tomášek M. (2000): Soils of the Czech Republic. In: 2nd ed. Czech Geological Service, Prague. (In
Czech)
Trnka M., Dubrovský M., Svoboda M., Semerádová D., Hayes M., Žalud Z., Wilhite D. (2007): Developing a regional drought climatology for the Czech Repub-lic. Int. J. Climatol. (submitted).
Wells N., Goddard S., Hayes M. (2004): A self-cali-brating palmer drought severity index. J. Clim., 17: 2335–2351.
Willmott C.J. (1984): On the evaluation of model perfor-mance in physical geography. In: Gaile G.L., Willmott C.J. (eds.): Spatial Statistics and Models. D. Reidel, Norwell, MA.
Yamoah C.F., Walters D.T., Shapiro C.A., Francis C.A., Hayes M.J. (2000): Standardized precipitation in-dex and nitrogen rate effects on crop yields and risk distribution in maize. Agr. Ecosyst. Environ., 80: 113–120.
Zimolka J. (ed.) (2006): Barley-Forms and Future Trends in the Czech Republic. Profi-Press, Prague: 200. (In Czech)
Received on December 20, 2006
Corresponding author:
Ing. Mgr. Miroslav Trnka, Ph.D., Mendelova zemědělská a lesnická univerzita v Brně, Ústav agrosystémů a bioklimatologie, Zemědělská 1, 613 00 Brno, Česká republika