Salt stress is recognized as a major factor that limits plant growth, physiology and productivity, mainly by inducing osmotic effects, ion-specific effects and oxidative stress (Okhovatian-Ardakani et al. 2010). Moreover, membrane stability, chloro-phyll biosynthesis, carbon and nitrogen metabo-lism and rates of photosynthesis and respiration are also seen to be significantly hampered due to high salinity (Ashraf 2004). High-salt stress disrupts homeostasis in water potential and ion distribution at both the cellular and the whole plant levels (Errabii et al. 2007). Excess of Na+ and
Cl− ions may lead to conformational changes in
the protein structure, while osmotic stress leads to turgor loss and cell volume change (Errabii et al. 2007). However, the precise mechanisms underly-ing these effects are not fully understood because the resistance to salt stress is a multigenic trait (Errabii et al. 2007). To achieve salt tolerance, plant cells evolve several biochemical and physiological pathways. These processes are thought to operate
additively to ensure plants and cells survival, and they include the exclusion of Na+ ions and their
compartmentation into vacuoles as well as accu-mulation of compatible solutes such as proline, glycinebetaine and polyols (Errabii et al. 2007).
Mechanisms of salt tolerance, not yet clear, can be, to some extent, explained by stress adaptation effectors that mediate ion homeostasis, osmo-lytic biosynthesis, toxic radical scavenging, water transport and long-distance response coordination (Jaleel et al. 2007).
Undoubtedly, plant breeders have made a signifi-cant achievement in the past few years, improving the salinity tolerance in a number of potential crops using artificial selection and conventional breed-ing approaches. However, most of the selection procedures were based on differences in agronomic characters (Ashraf and Harris 2004). Agronomic characters represent the combined genetic and environmental effects on plant growth and include the integration of the physiological mechanisms
Salt resistance of tomato species grown in sand culture
M. Dogan
1, R. Tipirdamaz
2, Y. Demir
31
Harran University, Department of Biology, Şanlıurfa, Turkey
2Hacettepe University, Department of Biology, Ankara, Turkey
3
Ataturk University, Education Faculty, Department of Biology, Erzurum, Turkey
ABSTRACT
In this study, Na+, Cl–, K+, Ca2+, chlorophyll and proline levels and the rate of lipid peroxidation level in terms of
malondialdehyde (MDA), were investigated in tissues of 15 different tomato cultivars in salt tolerance. As a mate-rial, 15 different tomato genotypes were used during a 28-day period and 150 mmol NaCl was applied in sand cul-ture. While one of tomato genotypes was a wild type belonging to Lycopersicum peruvianum, the others were local genotypes belonging to Lycopersicum esculentum L. Better NaCl-stress tolerance in salt-tolerant cultivars as com-pared to salt-sensitive cultivars observed during the present investigation might be due to restriction of Na+
accu-mulation and ability to maintain high K+/Na+ ratio in tissue. The chlorophyll level decreased more in salt-sensitive
than in salt-resistant cultivars, whereas proline level increased more in salt-sensitive than in salt-resistant cultivars. The exposure to NaCl induced a significant increase in MDA level in both salt-resistant and salt-sensitive cultivars; yet, MDA level was higher in salt-sensitive cultivars. As a result, exclusion or inclusion of Na+, Cl–, K+ and Ca2+
MDA levels, chlorophyll and proline levels may play a key protective role against stress and these features can be used as identifiers for tolerance to salt.
conferring salinity tolerance. Typical agronomic selection parameters for salinity tolerance are yield, survival, plant height, leaf area, leaf injury, relative growth rate, and relative growth reduction (Ashraf and Harris 2004, Okhovatian-Ardakani et al. 2010). Many scientists suggested that selection is more convenient and practicable if the plant species possess distinctive indicators of salt tol-erance at the whole plant, tissue or cellular level (Ashraf and Harris 2004). Physiological criteria are able to supply more objective information than agronomic parameters or visual assessment when screening for component traits of complex char-acters (Ashraf and Harris 2004). Some researches suggested that plant physiologists could improve the salt tolerance of plants only by defining genes or characters for geneticists or breeders to exploit (Ashraf and Harris 2004). However, knowledge of heritability and the genetic mode of salinity tolerance is lacking because few studies have yet been conducted in these areas. Indeed, genetic information is lagging behind the physiological information (Ashraf and Harris 2004). Despite a great deal of research into salinity tolerance of plants, mainly on water relations, photosynthesis and accumulation of various inorganic ions and organic metabolites (Ashraf and Harris 2004), the metabolic sites at which salt stress damages plants and, conversely, the adaptive mechanisms utilized by plants to survive saline stress are still not well understood. The main enigma is that there are no well-defined plant indicators for salinity tolerance that could practically be used by plant breeders for improvement of salinity tolerance in a number of important agricultural crops. This is partly due to the fact that the mechanisms of salt tolerance are so complex that variation occurs not only among species but, in many cases, also among cultivars within a single species (Ashraf and Harris 2004).
During the recent years, tissue culture has gained importance in the development of plants against various abiotic stresses as well as in elucidating mechanisms operating at the cellular level by which plants survive under various abiotic stresses includ-ing salinity (Jain et al. 2001). Plant tissue culture allows to control the stress homogeneity and to characterize the cell behaviour under stress condi-tions, independently of the regulatory systems that take place at the whole plant level (Lutts et al. 2004).
The objective of the present investigation was to study the effect of salinity stress on Na+, Cl–,
K+, Ca2+ and proline contents, the rate of lipid
peroxidation level in terms of malondialdehyde (MDA) and chlorophyll content in salt-sensitive
and -tolerant tomato cultivars in order to evalu-ate the relative significance of these parameters in imparting tolerance to NaCl oxidative stress.
MATERIAL AND METHODS
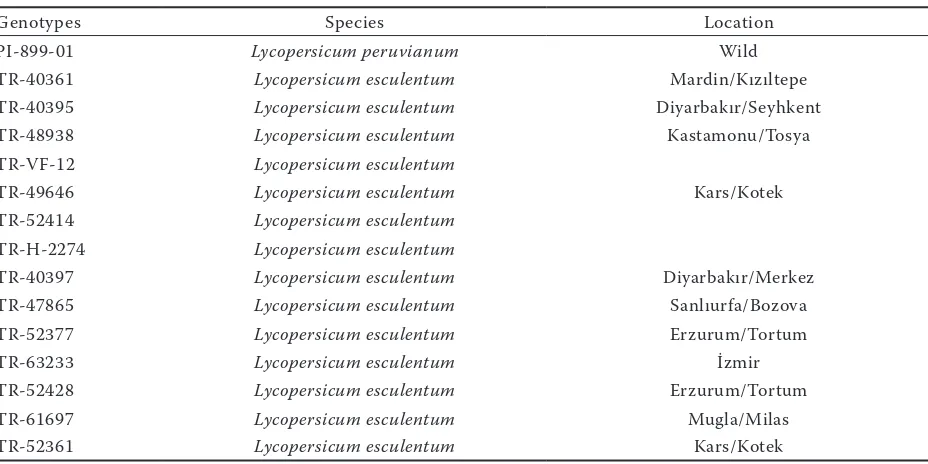
In the experiment, the seeds of 15 tomato geno-types, 14 of which belonged to local Lycopersicum esculentum species (Table 1) and the other one belonged to Lycopersicum peruvianum wild species (PI-899-01), were used. The seeds were cleaned from bacteria and fungi by applying the superficial sterilization method of Ellis et al. (1988). Plants were placed in a climate chamber at 25 ± 2°C and 65 ± 5 % humidity under 16/8 light/dark, 13 500 lux (90% fluorescent, 10% incandescent) in sand culture (with Arnon and Hoagland solution). When the root length of the seedlings reached 1 cm, magentas were placed in a 16 h light/8 h dark photoperiod. They were left to grow for 28 days in a media containing 150 mmol NaCl. At the end of the 28th day, the
tissues harvested were kept in a deep freezer at –80°C and homogenized into liquid nitrogen for the analyses.
A randomized parcels experimental design was carried out with three replications in the facto-rial order. Time, one of these three factors, has a replicated measurement quality. The factors were compared by the repeated measurement variance analysis from the view point of the properties concerned. The differences between the levels of the factors were examined by the least important difference (LID) multiple comparison method. The calculations were made by using MINITAB 13.0 statistical packet program. Statistica V.6.0 packet program was used for the multiple comparisons of the properties.
For ion measurements, tissues were first rinsed for 5 min with cool distilled water in order to remove free ions from the apoplasm without sub-stantial elimination of cytosolic solutes. Tissues were oven-dried at 80°C for 48 h and then were ground. The dry matter obtained was used for mineral analysis. The major cations were extracted after digestion of dry matter with HNO3. The extract was filtered prior to analysis. Na+ and K+
concentrations were determined using a flame spectrophotometer (Eppendorf flame photometer, PHF 90D, LeMans, France). The Ca2+
concen-tration was quantified by an atomic absorption spectrophotometer (Shimadzu AA-6200, Kyoto, Japan) (Guerrier and Patolia 1989). For Cl− content
water (80°C) during 2 h. Chloride was determined (Buchler-Cotlove chloridometer) as described by Taleisnik et al. (1997).
One plant per replicate was used for chlorophyll determination. Prior to extraction, fresh leaf sam-ples were cleaned with deionized water to remove any surface contamination. Chlorophyll extraction was carried out on fresh fully expanded leaf mate-rial; 1 g leaf sample was ground in 90% acetone using a pestle and mortar. The absorbance was measured with a UV/Visible spectrophotometer (Pye Unicam SP6-550, UK) and chlorophyll con-centrations were calculated using the equation proposed by (Luna et al. 2000).
Lipid peroxidation in leaf tissue was colorimetri-cally determined by measuring malondialdehyde (MDA), a major thiobarbituric acid reactive spe-cies (TBARS) and product of lipid peroxidation according to Lutts et al. (1996). Levaes (0.2 g) were ground in 5 ml of trichloroacetic acid (TCA, 0.1%, w/v). The homogenate was centrifuged at 12 000 g for 20 min and 3 ml of the supernatant was added to 3 ml 0.5% thiobarbituric acid (TBA) in 20% TCA. The mixture was heated at 95°C for 30 min, and the reaction was stopped by putting the reaction tubes in an ice bath. The samples were then centrifuged at 12 000 g for 20 min. Absorbance of the supernatant was measured at 532 nm and the amount of nonspecific absorption at 600 nm was subtracted from this value using a spectrophotometer (Analytic Jena 40 Model). The amount of MDA was calculated from the extinc-tion coefficient of 155 mmol/cm.
Proline was also determined spectrophotometri-cally following the ninhydrin method described by Bates et al. (1973) using l-proline as a standard. 0.2 g of leaf sample was homogenized in 10 ml of 3% (w/v) aqueous sulphosalicylic acid and filtered. In 2 ml of the filtrate, 2 ml of acid ninhydrin was added, followed by the addition of 2 ml of glacial acetic acid and boiled for 60 min. The mixture was extracted with toluene, and the free proline was quantified spectrophotometrically at 520 nm from the organic phase using a Shimadzu spec-trophotometer (Duisburg, Germany).
Tables indicate mean values ± SE. Differences between the values for control and treated leaves were analyzed by one-way ANOVA, taking
P < 0.001 as significance level, according to LSD
multiple range tests.
RESULTS
In the absence of stress, in all tissues, the Na+
level differed significantly (P < 0.001) among the cultivars and was lower in resistant than in salt-sensitive cultivars. The exposure to NaCl induced a significant increase in Na+ (Table 2) levels in
both salt-resistant and salt-sensitive cultivars; yet, Na+ levels were higher in salt-sensitive cultivars.
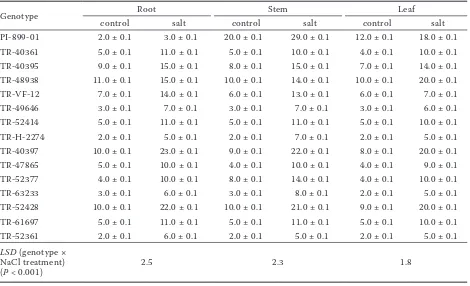
In the absence and present of stress, in all tissues, Cl− level differed significantly (P < 0.001) among
the cultivars. The exposure to NaCl induced a significant increase in Cl− (Table 3) levels in both
[image:3.595.66.530.75.307.2]salt-resistant and salt-sensitive cultivars. Table 1. Salt tolerant and sensitive species used in the experiment, respectively
Genotypes Species Location
PI-899-01 Lycopersicum peruvianum Wild
TR-40361 Lycopersicum esculentum Mardin/Kızıltepe
TR-40395 Lycopersicum esculentum Diyarbakır/Seyhkent
TR-48938 Lycopersicum esculentum Kastamonu/Tosya
TR-VF-12 Lycopersicum esculentum
TR-49646 Lycopersicum esculentum Kars/Kotek
TR-52414 Lycopersicum esculentum TR-H-2274 Lycopersicum esculentum
TR-40397 Lycopersicum esculentum Diyarbakır/Merkez
TR-47865 Lycopersicum esculentum Sanlıurfa/Bozova
TR-52377 Lycopersicum esculentum Erzurum/Tortum
TR-63233 Lycopersicum esculentum İzmir
TR-52428 Lycopersicum esculentum Erzurum/Tortum
TR-61697 Lycopersicum esculentum Mugla/Milas
In the absence of stress, in all tissues, the K+
level differed significantly (P < 0.001) among the cultivars and was lower in salt-sensitive than in
salt-resistant cultivars. The exposure to NaCl in-duced a significant increase in K+ (Table 4) levels
[image:4.595.65.532.89.372.2]in both salt-resistant and salt-sensitive cultivars, Table 2. Na+ (mg/g dry weight) contents in root, stems and leaves of the Lycopersicum esculentum species in the
presence of 150 mmol NaCl. Results are expressed as mean ± SE (n = 3)
Genotype Root Stem Leaf
control salt control salt control salt
PI-899-01 3.8 ± 0.4 5.0 ± 0.6 3.6 ± 0.3 4.5 ± 0.6 3.3 ± 3 4.2 ± 0.4 TR-40361 4.5 ± 0.8 7.2 ± 1.3 4.2 ± 0.7 6.8 ± 1.2 4.0 ± 7 6.4 ± 1.0 TR-40395 8.8 ± 0.3 12.0 ± 0.6 8.3 ± 0.3 11.3 ± 0.5 7.8 ± 3 11.5 ± 0.5 TR-48938 10 ± 0.3 16.0 ± 0.4 9.4 ± 0.3 15.0 ± 0.4 8.8 ± 2 14.0 ± 0.4 TR-VF-12 9.9 ± 0.2 15.9 ± 0.3 9.3 ± 0.2 14.8 ± 0.2 8.8 ± 1 14.0 ± 0.2 TR-49646 8.0 ± 0.5 12.8 ± 0.8 7.5 ± 0.4 12.0 ± 0.7 7.1 ± 4 11.3 ± 0.7 TR-52414 5.5 ± 0.2 8.8 ± 0.4 5.2 ± 0.2 8.3 ± 0.4 4.9 ± 2 7.8 ± 0.3 TR-H 2274 11 ± 0.7 17.8 ± 1.0 11.0 ± 0.5 16.0 ± 1.0 8.9 ± 4 12.9 ± 0.9 TR-40397 11 ± 0.3 18.0 ± 0.5 11.0 ± 0.3 17.0 ± 0.5 9.9 ± 3 16.0 ± 0.4 TR-47865 7.9 ± 0.4 12.6 ± 0.6 7.4 ± 0.3 11.8 ± 0.5 6.9 ± 3 11.0 ± 0.5 TR-52377 6.8 ± 0.5 10.9 ± 0.8 6.4 ± 0.5 10.3 ± 0.8 6.0 ± 5 9.7 ± 0.7 TR-63233 11 ± 0.4 15.8 ± 0.6 9.9 ± 0.4 14.8 ± 0.6 8.3 ± 4 11.8 ± 0.6 TR-52428 10 ± 0.4 16.4 ± 0.6 10.0 ± 0.1 15.5 ± 0.6 9.4 ± 1 14.5 ± 0.5 TR-61697 6.8 ± 0.6 10.9 ± 1.0 6.4 ± 0.6 10.0 ± 0.9 6.0 ± 5 9.6 ± 0.9 TR-52361 8.5 ± 0.3 13.6 ± 0.4 8.0 ± 0.2 12.8 ± 0.4 7.5 ± 2 12.0 ± 0.4 LSD (genotype ×
NaCl treatment)
(P < 0.001) 2.2 2.3 2.64
Table 3. Cl– (mg/g dry weight) contents in root, stems and leaves of the Lycopersicum esculentum species in the
presence of 150 mmol NaCl. Results are expressed as mean ± SE (n = 3)
Genotype Root Stem Leaf
control salt control salt control salt
PI-899-01 2.0 ± 0.1 3.0 ± 0.1 20.0 ± 0.1 29.0 ± 0.1 12.0 ± 0.1 18.0 ± 0.1 TR-40361 5.0 ± 0.1 11.0 ± 0.1 5.0 ± 0.1 10.0 ± 0.1 4.0 ± 0.1 10.0 ± 0.1 TR-40395 9.0 ± 0.1 15.0 ± 0.1 8.0 ± 0.1 15.0 ± 0.1 7.0 ± 0.1 14.0 ± 0.1 TR-48938 11.0 ± 0.1 15.0 ± 0.1 10.0 ± 0.1 14.0 ± 0.1 10.0 ± 0.1 20.0 ± 0.1 TR-VF-12 7.0 ± 0.1 14.0 ± 0.1 6.0 ± 0.1 13.0 ± 0.1 6.0 ± 0.1 7.0 ± 0.1 TR-49646 3.0 ± 0.1 7.0 ± 0.1 3.0 ± 0.1 7.0 ± 0.1 3.0 ± 0.1 6.0 ± 0.1 TR-52414 5.0 ± 0.1 11.0 ± 0.1 5.0 ± 0.1 11.0 ± 0.1 5.0 ± 0.1 10.0 ± 0.1 TR-H-2274 2.0 ± 0.1 5.0 ± 0.1 2.0 ± 0.1 7.0 ± 0.1 2.0 ± 0.1 5.0 ± 0.1 TR-40397 10.0 ± 0.1 23.0 ± 0.1 9.0 ± 0.1 22.0 ± 0.1 8.0 ± 0.1 20.0 ± 0.1 TR-47865 5.0 ± 0.1 10.0 ± 0.1 4.0 ± 0.1 10.0 ± 0.1 4.0 ± 0.1 9.0 ± 0.1 TR-52377 4.0 ± 0.1 10.0 ± 0.1 8.0 ± 0.1 14.0 ± 0.1 4.0 ± 0.1 10.0 ± 0.1 TR-63233 3.0 ± 0.1 6.0 ± 0.1 3.0 ± 0.1 8.0 ± 0.1 2.0 ± 0.1 5.0 ± 0.1 TR-52428 10.0 ± 0.1 22.0 ± 0.1 10.0 ± 0.1 21.0 ± 0.1 9.0 ± 0.1 20.0 ± 0.1 TR-61697 5.0 ± 0.1 11.0 ± 0.1 5.0 ± 0.1 11.0 ± 0.1 5.0 ± 0.1 10.0 ± 0.1 TR-52361 2.0 ± 0.1 6.0 ± 0.1 2.0 ± 0.1 5.0 ± 0.1 2.0 ± 0.1 5.0 ± 0.1 LSD (genotype ×
NaCl treatment)
[image:4.595.64.534.478.764.2]yet K+ levels were higher in salt-resistant
cul-tivars and K+ variation was lower than that of
Na+, Cl− and Ca2+.
In the absence of stress, in all tissues, the Ca2+
[image:5.595.65.532.90.374.2]level differed significantly (P < 0.001) among the cultivars and was lower in salt-sensitive than in Table 4. K+ (mg/g dry weight) contents in root, stems and leaves of the Lycopersicum esculentum species in the
presence of 150 mmol NaCl. Results are expressed as mean ± SE (n = 3)
Genotype Root Stem Leaf
control salt control salt control salt
PI-899-01 4.2 ± 0.1 6.7 ± 0.1 4.0 ± 0.1 6.2 ± 0.1 3.8 ± 0.1 5.8 ± 0.1 TR-40361 2.3 ± 0.1 3.6 ± 0.1 2.1 ± 0.1 3.4 ± 0.1 2.2 ± 0.1 3.2 ± 0.1 TR-40395 2.1 ± 0.1 3.4 ± 0.1 1.9 ± 0.1 3.3 ± 0.1 1.8 ± 0.1 3.1 ± 0.1 TR-48938 1.8 ± 0.1 2.9 ± 0.1 1.7 ± 0.1 2.7 ± 0.1 1.6 ± 0.1 2.5 ± 0.1 TR-VF-12 2.7 ± 0.1 4.2 ± 0.1 2.6 ± 0.1 4.0 ± 0.1 2.4 ± 0.1 3.7 ± 0.1 TR-49646 2.1 ± 0.1 3.3 ± 0.1 1.9 ± 0.1 3.1 ± 0.1 1.8 ± 0.1 2.9 ± 0.1 TR-52414 2.8 ± 0.1 4.5 ± 0.1 2.6 ± 0.1 4.2 ± 0.1 2.5 ± 0.1 3.9 ± 0.1 TR-H-2274 1.8 ± 0.1 3.0 ± 0.1 1.7 ± 0.1 2.7 ± 0.1 1.6 ± 0.1 2.5 ± 0.1 TR-40397 1.8 ± 0.1 2.9 ± 0.1 1.7 ± 0.1 2.7 ± 0.1 1.7 ± 0.1 2.5 ± 0.1 TR-47865 2.0 ± 0.1 3.3 ± 0.1 1.9 ± 0.1 3.0 ± 0.1 1.8 ± 0.1 2.8 ± 0.1 TR-52377 2.9 ± 0.1 4.6 ± 0.1 2.7 ± 0.1 4.3 ± 0.1 2.5 ± 0.1 4.1 ± 0.1 TR-63233 1.9 ± 0.1 3.1 ± 0.1 1.9 ± 0.1 2.9 ± 0.1 1.7 ± 0.1 2.8 ± 0.1 TR-52428 3.0 ± 0.1 4.7 ± 0.1 2.8 ± 0.1 4.5 ± 0.1 2.6 ± 0.1 4.2 ± 0.1 TR-61697 2.1 ± 0.1 3.5 ± 0.1 1.9 ± 0.1 3.2 ± 0.1 1.8 ± 0.1 3.4 ± 0.1 TR-52361 2.1 ± 0.1 3.3 ± 0.1 1.9 ± 0.1 3.1 ± 0.1 1.7 ± 0.1 2.9 ± 0.1
LSD (genotype × NaCl treatment)
(P < 0.001) 0.6 0.5 0.5
Table 5. Ca2+ (mg/g dry weight) contents in root, stems and leaves of the Lycopersicum esculentum species in
the presence of 150 mmol NaCl. Results are expressed as mean ± SE (n = 3)
Genotype Root Stem Leaf
control salt control salt control salt
PI-899-01 37 ± 1.6 65 ± 0.7 35 ± 0.6 65 ± 0.6 23 ± 0.9 38 ± 1.2
TR-40361 57 ± 1.5 45 ± 1.2 51 ± 1.1 59 ± 1.2 45 ± 1.1 56 ± 1.2
TR-40395 45 ± 1.4 58 ± 1.2 39 ± 0.1 51 ± 0.4 25 ± 0.2 33 ± 0.4
TR-48938 41 ± 1.2 63 ± 1.4 35 ± 1.2 45 ± 0.5 26 ± 0.5 34 ± 1.2
TR-VF-12 45 ± 1.3 56 ± 1.1 39 ± 1.2 51 ± 1.1 31 ± 1.1 39 ± 0.6
TR-49646 53 ± 1.9 58 ± 1.6 45 ± 1.7 55 ± 0.6 38 ± 0.8 48 ± 0.5
TR-52414 52 ± 2.3 60 ± 1.8 44 ± 1.2 52 ± 0.6 37 ± 0.8 46 ± 0.8
TR-H-2274 58 ± 2.1 69 ± 1.6 54 ± 0.3 64 ± 0.5 46 ± 0.4 58 ± 0.5
TR-40397 55 ± 1.7 63 ± 1.5 51 ± 0.4 58 ± 0.5 35 ± 0.3 45 ± 0.6
TR-47865 54 ± 2.4 66 ± 1.1 47 ± 1.3 58 ± 0.4 39 ± 0.5 49 ± 1.3
TR-52377 32 ± 1.4 42 ± 1.5 26 ± 1.8 35 ± 0.8 18 ± 1.2 28 ± 0.9
TR-63233 36 ± 2.2 53 ± 1.8 31 ± 0.8 45 ± 0.9 27 ± 1.2 35 ± 0.6
TR-52428 36 ± 1.8 62 ± 1.3 28 ± 0.6 51 ± 1.2 21 ± 0.8 34 ± 0.5
TR-61697 57 ± 0.9 68 ± 1.2 48 ± 0.5 58 ± 0.8 41 ± 1.1 51 ± 0.5
TR-52361 39 ± 1.8 64 ± 1.2 31 ± 0.8 57 ± 0.9 24 ± 0.4 31 ± 0.3
LSD (genotype ×
[image:5.595.65.532.491.763.2]salt-resistant cultivars. The exposure to NaCl in-duced a significant increase in Ca2+ level (Table 5)
in both salt-resistant and salt-sensitive cultivars (especially in the wild type).
In the absence of stress, the chlorophyll level in leaf tissue differed significantly (P < 0.01) among the cultivars and was higher in salt-resistant than in salt-sensitive cultivars. The exposure to NaCl induced a significant decrease in chlorophyll level (Table 6) in both salt-resistant and salt-sensitive cultivars; yet, the chlorophyll level was more decreased in salt-sensitive than in salt-resistant cultivars.
The lipid peroxidation levels in leaves of 15 to-mato cultivars, measured as the content of MDA, are given in Table 6. In the absence of stress, the MDA level differed significantly (P < 0.01) among the cultivars and was higher in salt-resistant than in salt-sensitive cultivars. The exposure to NaCl induced a significant increase in the MDA level in salt-sensitive cultivars compared to a lower increase in salt-resistant wild type.
In the absence of stress, the proline level differed significantly (P < 0.01) among the cultivars and was higher in salt-resistant than in salt-sensitive cultivars. The exposure to NaCl induced a
signifi-Table 6. Chlorophyll (mg/g fresh weight) and malondialdehyde (MDA) (µmol/g fresh weight) levels in leaves of the
Lycopersicum esculentum species in the presence of 150 mmol NaCl. Results are expressed as mean ± SE (n = 3)
Genotype Chlorophyll MDA
control salt control salt
PI-899-01 331 ± 0.2 312 ± 0.1 32 ± 0.2 33 ± 0.2
TR-40361 243 ± 0.1 146 ± 0.2 24 ± 0.1 43 ± 0.1
TR-40395 244 ± 0.2 167 ± 0.1 25 ± 0.1 43 ± 0.2
TR-48938 263 ± 0.1 158 ± 0.3 25 ± 0.3 42 ± 0.1
TR-VF-12 281 ± 0.3 156 ± 0.1 25 ± 0.3 44 ± 0.2
TR-49646 228 ± 0.2 137 ± 0.1 25 ± 0.3 43 ± 0.4
TR-52414 217 ± 0.2 134 ± 0.1 24 ± 0.4 43 ± 0.5
TR-H-2274 168 ± 0.1 86.2 ± 0.3 28 ± 0.1 48 ± 0.1
TR-40397 265 ± 0.1 159 ± 0.2 25 ± 0.2 43 ± 0.1
TR-47865 288 ± 0.4 173 ± 0.1 25 ± 0.2 42 ± 0.3
TR-52377 212 ± 0.1 127 ± 0.3 27 ± 0.1 44 ± 0.1
TR-63233 167 ± 0.3 92.1 ± 0.3 35 ± 0.1 66 ± 0.2
TR-52428 248 ± 0.1 147 ± 0.4 26 ± 0.1 43 ± 0.1
TR-61697 211 ± 0.2 126 ± 0.1 25 ± 0.4 45 ± 0.2
TR-52361 250 ± 0.4 152 ± 0.1 25 ± 0.2 44 ± 0.4
LSD (genotype × NaCl treatment)
[image:6.595.62.533.90.407.2](P < 0.01) 1.33 1.55
Table 7. Proline levels (µmol/g fresh weight) in leaves of the Lycopersicum esculentum species in the presence of 150 mmol NaCl. Results are expressed as mean ± SE (n = 3)
Genotype Proline
control salt
PI-899-01 31 ± 0.2 34 ± 0.2
TR-40361 25 ± 0.1 36 ± 0.1
TR-40395 24 ± 0.1 35 ± 0.2
TR-48938 24 ± 0.3 37 ± 0.1
TR-VF-12 24 ± 0.3 35 ± 0.2
TR-49646 25 ± 0.3 38 ± 0.4
TR-52414 23 ± 0.4 35 ± 0.5
TR-H-2274 27 ± 0.1 42 ± 0.1
TR-40397 23 ± 0.2 34 ± 0.1
TR-47865 24 ± 0.2 35 ± 0.3
TR-52377 27 ± 0.1 41 ± 0.1
TR-63233 32 ± 0.1 48 ± 0.2
TR-52428 25 ± 0.1 37 ± 0.1
TR-61697 24 ± 0.4 44 ± 0.2
TR-52361 26 ± 0.2 39 ± 0.4
LSD (genotype × NaCl treatment)
[image:6.595.305.532.483.763.2]cant increase in the proline level (Table 7) in both salt-resistant and salt-sensitive cultivars. But the proline level was more increased in salt-sensitive than in salt-resistant cultivars.
DISCUSSION
NaCl is the dominant salt, and the high concen-tration of ions, particularly Na+ in the growing
medium can, if taken up by the plant, result in cytoplasmic toxicity (Parvaiz and Satyawati 2008). An excess of Na+ disturbs cellular ion homeostasis,
and leads to other effects such as interference in enzyme activities and oxidative stress (Afzal et al. 2008, Okhovatian-Ardakani et al. 2010). Cl– is
the most prevalent anion under saline conditions. To prevent these problems, plants suppress the influx and accumulation of Na+ in the cytoplasm,
especially in leaves (Esmaili et al. 2008, Patel and Pandey 2008). We found that, in all tissues under salt stress, the Na+ and Cl– contents increased
dramatically in salt-sensitive cultivars. Even under the control conditions, in all tissues Na+ contents
in the salt-sensitive plants were twice higher than those in the salt-resistant plants (Tables 2 and 3). Some researchers found high accumulation of Cl– in the leaves of salt-sensitive lines of barley.
In most crop species salt tolerance was found to be associated with the accumulation of only low amounts of both Na+ and Cl– in the shoots (Ashraf
2004). Salt tolerance in most plants is associated with low uptake and accumulation of Na+, which
is mediated through the control of influx and/or by active efflux from the cytoplasm to the vacu-oles and also back to the growth medium (Ashraf 2004). The fact that NaCl affected the relative growth rate value at the least extent is mostly due to the selective accumulation of Na+ and Cl− ions.
A moderate increase of Na+ and Cl− within
cal-lus tissue might avoid water loss and ensure an economic way to adjust osmotically (Errabii et al. 2007). However, when the ability of the cells to compartmentalize the ions into the vacuole is exceeded, ions build up in the cytoplasm and lead to severe ion imbalances and to conformational changes in the plasma membrane electrical poten-tial (Errabii et al. 2007). The salt-resistant plants accumulated less Na+ and Cl− compared to the
salt-sensitive ones.
Under saline conditions, due to excessive amounts of exchangeable Na+, high Na+/K+ and
Na+/Ca2+ ratios occur in the soil. Plants subjected
to such environments, take up high amounts of
Na+ (Esmaili 2008), whereas the uptake of K+ and
Ca2+ is considerably reduced (Patel and Pandey
2008). Reasonable amounts of both K+ and Ca2+ are
required to maintain the integrity and functioning of cell membranes (Ashraf 2004). In Agropyron spp., the high salt tolerance of A. elongatum relative to
A. intermedium, is associated with its higher uptake of K+ under saline conditions (Ashraf 2004, Afzal
et al. 2008, Patel and Pandey 2008). Researchers concluded that roots of the salt-tolerant Beta vulgaris had a greater affinity for K+ relative to
Na+ than did the salt-sensitive Phaseolus vulgaris.
Similarly, in soybean, researchers found that the salt-tolerant cultivar. Lee accumulated more K+
in its leaves than did the salt-sensitive cultivar Jackson (Ashraf 2004). In this study, we showed that only the salt-tolerant cultivars maintained higher K+ contents and lower Na+ contents in
the all tissues of the plant (Table 4). Furthermore, salt-tolerant cultivars excluded approximately three times more Na+ than did the salt-sensitive
plants. These results suggest that salt-tolerant cultivars have a mechanism to select potassium in the presence of sodium, and that this ability is related to maintain high potassium contents under salt stress (Esmaili et al. 2008).
Calcium is known to play a crucial role in main-taining the structural and functional integrity of plant membranes in addition to its considerable roles in cell wall stabilization, regulation of ion transport and selectivity and activation of cell wall enzymes (Mengel and Kirkby 1987, Rengel 1992). The maintenance of calcium acquisition and transport under salt stress is an important determinant of salinity tolerance (Afzal et al. 2008). In most cases salt tolerance of a crop cul -tivar can be increased by an increase in the Ca2+
concentration in the saline growth medium. For example, supplemental calcium alleviated the ad-verse effect of salt stress on the germination and vegetative growth of bean (Awada et al. 1995) and pigeonpea (Subbarao et al. 1990). Some reseachers reported that supplemental Ca2+ in the presence
of salinity improved the growth of Brassica jun-cea and B. napus but not that of B. carinata and
B. rapa, showing genotypical difference in the plant growth responses to the addition of Ca2+. Ca2+
maintenance and Na+ exclusion, which is related
to salinity tolerance in Lycopersicon esculentum, were genetically controlled with additive major genetic components (Afzal et al. 2008, Esmaili et al. 2008). In this study, we showed that only the salt-tolerant cultivars maintained higher Ca2+
Salinity reduces net photosynthetic rate, tran-spiration rate, and stomatal conductance in plant species and degrades chlorophyll at high salinity. Salinity tolerance is related to the maintenance of net photosynthetic rate and stomatal conductance and to elevated chlorophyll concentration (Ashraf 2004). High salinity reduced the leaf chlorophyll content in all genotypes, which might be due to the increased activity of chlorophyllase (Megdiche et al. 2007). A reduction in total chlorophyll contents was observed in the NaCl-stressed Catharanthus
plants when compared to control. The reduction in leaf chlorophyll under salinity was attributed to the destruction of the chlorophyll pigments and the instability of the pigment protein complex (Jaleel et al. 2007). Some researchers reported chlorophyll content as one of the parameters of salt tolerance in crop plants. Others observed higher chlorophyll degradation in a sodium chloride-sensitive pea cultivar as compared to a tolerant one (Sairam et al. 2005). Our results suggest that in the absence of stress, chlorophyll concentra-tion in leaf tissue differed significantly (P < 0.01) among the cultivars and was higher in salt-resistant than in salt-sensitive cultivars. The exposure to NaCl induced a significant decrease in chlorophyll concentration (Table 6) both in salt-resistant and salt-sensitive cultivars; yet, chlorophyll concentra-tion was more decreased in salt-sensitive than in salt-resistant cultivars.
The exposure to NaCl induced significantly an increase in MDA concentration in both salt-resistant and salt-sensitive cultivars. However, MDA concentration was higher in salt-sensitive cultivars. The level of MDA produced during per-oxidation of membrane lipids, is often used as an indicator of oxidative damage. The lower level of lipid peroxidation in salt-resistant cultivars compared to salt-sensitive cultivars suggests that it may have a better protection against oxidative damage under salt stress. In our study, we found that salt-sensitive cultivars accumulate MDA than salt-resistant cultivars (Table 6). There are reports of higher increase in the amount of MDA with the increase in salt stress in the salt-sensitive cultivar as compared to tolerant cultivar of rice and in roots of Lemna minor (Khan and Panda 2008). The better NaCl stress tolerance in salt-tolerant cultivars as compared to salt-sensitive cultivars observed during present investigation may be due to the restriction of damage of cellular membranes with lower MDA and H2O2 content. Higher H2O2 accumulation and lipid peroxidation in sensitive cultivars of pea and rice were reported earlier.
Salinity-induced increase in lipid peroxidation was also reported by some reseachers (Sairam et al. 2005).
Proline is one of the most important osmopro-tectant in plants. Under salt stress most plant species exhibit a remarkable increase in their proline content (Patel and Pandey 2008, Dasgan et al. 2009). In our experiments we also observed a similar behaviour in the leaves of tomato seedlings. Supporting findings come from other leguminous plants (alfalfa, soybean and pea) and sugar beet where salt stress resulted in extensive proline ac-cumulation. Likewise, in tomato salt tolerance was attributed to the degree of plant to accumulate osmoprotectants, like proline. Proline is generally assumed to serve as a physiologically compatible solute that increases as needed to maintain a fa-vorable osmotic potential between the cell and its surroundings (Patel and Pandey 2008, Dasgan et al. 2009). Nevertheless, the levels of proline in leaves of salt-sensitive plants under salt stress were higher than in salt-resistant cultivars. Also some researchers report a negative correlation between proline accumulation and salt tolerance in tomato and Aegiceras corniculatum (Parvaiz and Satyawati 2008). However, accumulation of proline in rice plants grown under salt stress was due to salt injury and not as an indication of salt tolerance (Parvaiz and Satyawati 2008). Similarly, accumulation of proline in two sorghum geno-types contrasting in salt tolerance suggested that proline accumulation was a reaction to salt stress and not a plant response associated with tolerance (Parvaiz and Satyawati 2008). In another experi-ment, researchers showed that under salt stress, higher concentration of proline was accumulated in sensitive rice cultivars than in tolerant genotypes (Parvaiz and Satyawati 2008).
As a conclusion, the salt-resistant cultivars ac-cumulated less Na+ and Cl− than the salt-sensitive
cultivars. Salt-tolerant cultivars have a mecha-nism to select K+ in the presence of Na+, and this
ability is related to maintaining high K+ contents
under salt stress. Only the salt-tolerant cultivars maintained higher Ca2+contents in all tissues of
REFERENCES
Afzal I., Rauf S., Basra S.M.A., Murtaza G. (2008): Halopriming improves vigor, metabolism of reserves and ionic contents in wheat seedlings under salt stress. Plant, Soil and Environment, 54: 382–388.
Ashraf M. (2004): Some important physiological selection criteria for salt tolerance in plants. Flora, 199: 361–376.
Ashraf M., Harris J.C. (2004): Potential biochemical indicators of salinity tolerance in plants. Plant Science, 166: 3–16. Awada S., Campbell W.F.L., Dudley M., Jurinak J.J., Khan M.A. (1995):
Interactive effect of sodium chloride, sodium sulfate, calcium sulfate and calcium chloride on snapbean growth, photosynthesis, and ion uptake. Journal of Plant Nutrition, 18: 889–900. Bates L.R., Waldren R.P., Teare I.D. (1973): A rapid
determina-tion of free proline for water stress studies. Plant and Soil, 39: 205–207.
Dasgan H.Y., Kusvuran S., Abak K., Leport L., Larher F., Bouchere-au A. (2009): The relationship between citrulline accumula-tion and salt tolerance during the vegetative growth of melon (Cucumis melo L.). Plant, Soil and Environment, 55: 51–57. Ellis R.H., Roberts E.H., Summerfield R.J., Cooper J.P. (1988):
Environmental control of flowering in barley (Hordeum vulgare L.). II. Rate of development as a function of temperature and photoperiod and its modification by low temperature verneli-zation. Annals of Botany, 62: 145–158.
Errabii T., Gandonou C.B., Essalmani H., Abrini J., Idaomar M., Senhaji N.S. (2007):Effects of NaCl and mannitol induced stress on sugarcane (Saccharum sp.) callus cultures. Acta Physiologiae Plantarum, 29: 95–102.
Esmaili E., Kapourchal S.A., Malakouti M.J., Homaee M. (2008): Interactive effect of salinity and two nitrogen fertilizers on growth and composition of sorghum. Plant, Soil and Environ-ment, 54: 537–546.
Guerrier G., Patolia J.S. (1989): Comparative salt responses of excised cotyledons and seedlings of pea to various osmotic and ionic stresses. Journal of Plant Physiology, 135: 330–337. Jain M., Mathur G., Koul S., Sarin N.B. (2001): Ameliorative effects
of proline on salt stress-induced lipid peroxidation in cell lines of groundnut (Arachis hypogea L.). Plant Cell Reports, 20: 463–468. Jaleel C.A., Gopi R., Manivannan P., Panneerselvam R. (2007):
Responses of antioxidant defense system of Catharanthus roseus (L.) G. Don. to paclobutrazol treatment under salinity. Acta Physiologiae Plantarum, 29: 205–209.
Khan M.H., Panda S.K. (2008): Alterations in root lipid peroxida-tion and antioxidative responses in two rice cultivars under NaCl-salinity stress. Acta Physiologiae Plantarum, 30: 81–89.
Luna C., Seffino L.G., Arias C., Taleisnik E. (2000): Oxidative stress indicators as selection tools for salt tolerance in Chloris gayana. Plant Breeding, 119: 341–345.
Lutts S., Almansouri M., Kinet J.M. (2004):Salinity and water stress have contrasting effects on the relationship between growth and cell viability during and after stress exposure in durum wheat callus. Plant Science, 167: 9–18.
Lutts S., Kinet J.M., Bouharmont J. (1996): NaCl-induced senes-ence in leaves of rice (Oryza sativa L.) cultivars differing in salinity resistance. Annals of Botany, 78: 389–398.
Megdiche W., Ben Amor N., Debez A., Hessini K., Ksouri R., Zuily-Fodil Y., Abdelly C. (2007): Salt tolerance of the annual halophyte Cakile maritima as affected by the provenance and the developmental stage. Acta Physiologiae Plantarum, 29: 375–384.
Mengel K., Kirkby E.A. (1987): Principles of Plant Nutrition. 4th Edition. International Potash Institute, Worblaufen, Bern.
Okhovatian-Ardakani A.R., Mehrabanian M., Dehghani F., Ak-barzadeh A.(2010): Salt tolerance evaluation and relative comparison in cuttings of different pomegranate cultivars. Plant, Soil and Environment, 56: 176–185.
Parvaiz A., Satyawati S. (2008): Salt stress and phyto-biochemical responses of plants – a review. Plant, Soil and Environment, 54: 89–99.
Patel A.D., Pandey A.N. (2008): Growth, water status and nutrient accumulation of seedlings of Holoptelea integrifolia (Roxb.) Planch in response to soil salinity. Plant, Soil and Environ-ment, 54: 367–373.
Rengel Z. (1992): The role of calcium in salt toxicity. Plant, Cell and Environment, 15: 625–632.
Sairam R.K., Srivastava G.C., Agarwal S., Meena R.C. (2005): Dif-ferences in antioxidant activity in response to salinity stress in tolerant and susceptible wheat genotypes. Biologia Plantarum, 49: 85–91.
Subbarao G.V., Johansen C., Jana M.K., Kumar Rao J.V.D.K. (1990): Effects of the sodium/calcium ratio in modifying salinity re-sponse of pigeonpea (Cajanus cajan L.). Journal of Plant Physi-ology, 136: 439–443.
Taleisnik E., Peyrano G., Arias C. (1997): Response of Chloris gayana cultivars to salinity, 1. Germination and early vegeta-tive growth. Tropical Grasslands, 31: 232–240.
Received on January 27, 2010
Corresponding author: