Resource-productivity, allocative efficiency and
determinants of technical efficiency of rainfed rice
farmers: A guide for food security policy in Nigeria
Produktivita zdrojů, alokační efektivnost a determinanty
technické efektivnosti pěstitelů nezavlažované rýže: cesta
k uplatnění politiky potravinové bezpečnosti v Nigérii
K. Ogundari
Georg-August University of Göttingen, Göttingen, Germany
Abstract: This paper analyses the resource-productivity, technical efficiency (TE) and allocative efficiency of rain fed far-mers in nigeria. The results of the parameters that enter the production function shows that herbicide has the highest elas-ticities, then seeds, followed by fertilizer and land while labour has the least contribution to output. Also, the result for the allocative efficiency based on the computedMVPx = Px show that none of the respondents optimally allocated the inputs. however, a greater number of the respondents were found to underutilized variables like land, seeds, fertilizer and herbici-de (MVPx < Px) while a greater number of the farmers over utilized labour (MVPx > Px). But in both cases, it was revealed that the use of more labour decreased the rice production from the study faster than any of the selected variables. The mean TE index was found to be 0.75. This suggests that 0.25 of rice yield is forgone due to inefficiency. The significant gamma (γ) value of 0.873 establishes the fact that a high level of technical inefficiency exists among the sampled farmers. Extension contact and access to credit are found to be significant determinants of TE among the farmers. hence, agricultural policy makers in nigeria should focus on how farmers could follow appropriate farm practices in the course of technology adopti-on to prevent under utilizatiadopti-on of farm inputs via the intensificatiadopti-on of extensiadopti-on activities in the country and accessibility to credit by farmers should be given more priority. Pursuing these will raise the productivity and efficiency of rice producti-on in the country in the lproducti-ong run.
Key words: resource productivity, allocative efficiency, technical inefficiency, rice, food policy
Abstrakt: Příspěvek je zaměřen na analýzu produktivity zdrojů, technické efektivnosti (TE) a alokační efektivnosti pěs-titelů nezavlažované rýže v nigérii. Výsledky parametrů vstupujících do produkční funkce ukazují, že nejvyšší elasticita se projevuje u herbicidů, následně u osiv, hnojiv, půdy a práce s nejnižším příspěvkem k outputu. obdobně výsledky alokační efektivnosti založené na vztahu MVPx = Px ukazují, že žádný z respondentů nealokoval inputy optimálním způ-sobem, přičemž značný počet respondentů nevyužíval v dostatečné míře proměnné jako je půda, osiva, hnojiva a herbicidy (MVPx< Px) a současně velký počet farmářů nadměrně využíval vstupy práce (MVPx > Px). V obou případech však bylo zjištěno, že využití vyšších vstupů práce snižovalo produkci rýže ve sledovaných podnicích rychlejším tempem než v přípa-dě jakékoliv jiné zkoumané proměnné. Průměrná hodnota indexu TE byla 0,75. To naznačuje, že 0,25 potenciálního výnosu rýže je ztraceno díky neefektivnosti. hodnota významnosti gama (γ = 0,873) potvrzuje skutečnost, že mezi sledovanými farmáři převládá vysoká míra technické neefektivnosti. Poradenství a přístup k úvěrům byly shledány jako významné determinanty TE farmářů. z uvedených zjištění vyplývá, že tvůrci zemědělské politiky nigérie by se měli zaměřit na to, aby farmáři při implementaci technologií sledovali metody správného hospodaření, aby se tak předešlo nedostatečnému využívání inputů do zemědělské výroby, a to zejména prostřednictvím intenzifikace poradenských služeb a usnadnění přístupu k úvěrům, jež by měla dostat prioritu. Tento přístup by napomohl dlouhodobě zvýšit produktivitu a efektivnost produkce rýže v nigérii.
in the African framework, rainfall is a crucial deter-minant of agricultural production because most crop production systems are rainfed dependent. Federal government of nigeria following the drought in the early 70s initiated a program to develop irrigated ag-riculture as outlined in the second national plan. This led to the establishment of the river Basin Authority in some of the states of the federation. The objective of this program is to ensure food self-sufficiency in the country through irrigation farming as complement to rainfed farming. Several years after the establishment of the river basin, many states of the federation have not benefited from the program as the operation of the basin is highly politicized. This left rainfed ag-riculture as the most known system of farming and widely still practiced in country. According to Singh et al. (1997), rice production is predominantly rainfed in nigeria as over 90% rice produced in the country is through this system. Buttressing this observation further is Akpokodge et al. (2001) “… 46% of the total area devoted to rice cultivation is for rainfed upland rice and irrigated production systems, each accounting for 30% and 16% respectively”.
With increase dependence on rainfed agriculture as a result of non functioning irrigation program in the country, there is need to examine empirically a measure that will serve as a guide to food policy makers with reference to rice production in nigeria. This will provide performance indicator and create improving efficiency policies environment that will improve efficiency of rice production in the coun-try. This study in light of this intends to measure the magnitude of gain that could be obtained by improving performance of the farmers by examining the resource-productivity, allocative efficiency and determinants of technical inefficiency of rainfed rice farmers in nigeria. To that effect, a stochastic frontier modeling is developed to simultaneously estimate the resource- use efficiency and determinants of technical inefficiency of the farmers while the marginal value product of inputs is employed to examine the level of optimum input allocation of the respondents.
STUDY AREA, SAMPLING TECHNIQUE AND DATA DESCRIPTION
Study area: The study was carried out in the ondo State. The state has a tropical climate with moderate temperature all the year round. it has heavy rainfall during the rainy season (April to october) and dry wind during the dry season (november to March). They grow both cash and food crops. The main cash crops are cocoa, kola nut and rubber. They also grow
food crops like yam, rice, plantain, maize, and to-matoes, so on.
Sampling technique: The study used a multi-stage sampling technique. The first stage was the purposive selection of four Local government Areas (LgAs) noted for rainfed rice production. This include: Akure-South, ifedore, Akure-north and owo LgAs. The second stage involved identification of communi-ties known for producing rice in each of the LgAs as follows: Two communities in Akure South, this include Army-barracks and irese, two communities in Akure-north, this include iju and ogbese while one community each in ifedore and owo LgAs which include igbara-oke and Elegbeka respectively. All six communities were identified. The third and final stage was the random selection of 16 farmers from the list of farmers available with the village extension agents in each of the communities. hence, a total number of 96 farmers were sampled for the study.
Data description: The data employed for the analy-sis was collected between February and April 2006. it include; the total paddy rice (un-milled) produced per annum in kg as output while the input include; size of farm land (hectare), seeds (kg), fertilizer (kg), herbicides (litres) and labour (man-days) which in-cludes family and hired labour utilized pre and post planting operations and harvesting excluding thresh-ing. Also, collected are the farmer’s socio-economic variables such as farmer’s age, years of schooling, number of contact with extension agents and acces-sibility to credit.
METHOD OF DATA ANALYSIS
in this paper we employed the Stochastic Frontier Analysis (SFA) to examine input-demand elastici-ties, and determinants of technical inefficiency of rain fed rice farmers in nigeria. Allocative efficiency of the factor inputs was computed using marginal value product the Marginal Value Product (MVP) of inputs.
The SFA was independently proposed by Aigneret al.(1977) and Meeusen and Van de Broeck (1977) to measure farm level technical efficiency by incorporat-ing in the deterministic function, the error term that accounts for the statistical noise. SFA is based on an econometric specification of a production frontier. The specification of SFA allows for a non-negative random component in the error term to generate a measure of technical inefficiency. indexing (rice) farms by i, the specification can be expressed by:
where Yi is output, Xi a vector of inputs and βj a vector of parameters to be estimated. The error νi is i.i.d~
N(0, δV2) and captures random variation in output due to the factors beyond the controls of the farmers, such as the normal variation in weather, measurement error and other statistical noise. The error term υi captures technical inefficiency in production, assumed to be farm-specific non-negative random variables, i.i.d. ~ N(µ, δu2). (note: when μ = 0, distribution of μ becomes half-normal). A higher value for υi implies an increasing in technical inefficiency. if υi is zero the farm is perfectly technically efficient.
Following, Battese and coelli (1995), we assume the distribution of mean inefficiency (μi,) is related to the farmers’ demographic variables by allowing heterogeneity in the mean inefficiency term to inves-tigate sources of differences in technical efficiencies of the farmers is expressed as follows:
μi =δ0 + δj Zij
Accordingly, the technical efficiency (TE) of the i-th farmer is defined by the ratio of the mean output for the i-th farmer, given the values of the inputs, Xi and its technical inefficiency effect υi, (that is observed output) to the corresponding mean output if there were no technical inefficiency of production (that is frontier output) (Battese, coelli 1988).
in the description above, TE can be defined by:
ܶܧൌܧሺܻܧሺܻȁݑǡ ܺሻ ȁݑൌ Ͳǡ ܺሻ
The measure of TE for the i-th firm, when Yi and
Xi are in logarithm is best defined as:
ܶܧൌ
ቀܺǡȕቁ ௩ିజ ቀܺǡȕቁ జ
ൌ ሺିజሻ
however, Battese and coelli (1988) derived the best predictor of technical efficiency [TE = exp (–υi)] of a firm i, following the work of Jondrow et al. (1982) as the conditional expectation of exp (–υi) given εi defined below:
TEi = εi E [exp (–υi)/εi]
(Best predictor of TE for individual firms)
The last equation, when expanded, is equivalent to:
All estimates are obtained through the maximum likelihood procedures, where the maximum likelihood function is based on a joint density function for the composite error term(νi – υi) using the computer
program FronTiEr 4.1c(coelli 1996).The
param-eters to be estimated include: βj, δj, together with the variance parameters expressed below:
ߪଶൌ ߪ ௩ଶ ߪ௨ଶ
ߛ ൌߪߪ௨ଶଶ
where σ2 represents the overall variance of error terms while γ is called gamma. A value of γ closer to zero implies that much of the variation of the observed output from the frontier output is due to random stochastic effects, whereas a value of γ closer to one implies a proportion of the random variation in out-put explained by inefficiency effects or differences in technical efficiency. however, according to coelli et al. (1998), γ does not equal the ratio of the variance of inefficiency to total residual variance. The reason is that the variance of μ equals: [(π-2)] σ2/π and not σ2. Thus, the relative contribution of variance inefficiency or differences in efficiency among the farmers (γ*) to total variance σ2 equals: γ/[γ + (1 – γ) π/(π – 2)]. γ* is derived by substituting everywhere [(π – 2)] σ2/π and by using γ = δu2/σ2 and σ2 = (1 – γ) σ2.
Econometric specification
generalized likelihood ratio tests are used to test the specification of other functional form. The critical value for the test statistics from a mixed χ2distribution significance (ρ = 0.05) indicates that Equation (1) is best specified by a production function in translog form model.
Models
The Stochastic translog frontier production func-tion for this study is defined as:
ܻൌ ߚ ߚ ହ
ୀଵ
ܺͳʹ ߚ ହ
ୀଵ ହ
ୀଵ
ܺܺ ɋെ ݒ
where: βjk = βkj
where: Ф is the density function for the standard normal random variables
ܶܧൌ
ሼሺെሾሺͳ െ ɀሻݖɁȂ ɀɂሿ ͲǤͷሾɀሺͳ െ ɀሻɐ௦ଶሿሻሽ ቊʣ ቈቆሺͳ െ ɀሻݖɁȂሾɀሺͳ െ ɀሻɐɀɂ୧ ୱ
ଶሿΦቇ െሾɀሺͳ െ ɀሻɐୱଶሿΦቋ
൜ʣ ൬ሾሺͳ െ ɀሻݖሾሾɀሺͳ െ ɀሻɐୱɁȂ ɀɂ୧ଶሿΦሿ ൰ൠሿ
here, ln represents the natural logarithm; the sub-script i-the sample farmer; Yi represents the farm output for farmer i; Xs represents the input variables in the model; βjrepresents the input coefficients for the resources used in production;
The inefficiency model defined by Equation (2) can be explicitly defined for this study as:
ߤൌ ߜ ߜܼ ଷ
ୀଵ
ߜସܦ
where: Z1iis farmer’s age; Z2iis the farmer years of schooling and Z3i is the farmers’ number of contact with extension agents and Di is dummy variable to represents farmer’s access to credit as 1 = yes and 0 = other wise
Input elasticity (εp)
The rice output elasticity for land, planting materi-als, labour, fertilizer and herbicides included in the regression as variable inputs are of interest, because elasticities are necessary for the estimation of the de-gree of responsiveness of change in output as a result of change in input (Abdula, Eberlin 2001). hence, given the specification of the translog stochastic frontier model in above, the output elasticities (εp) with respect to the inputs are computed using the expressions in the equation below:
ߝ ൌ߲߲ܻܺ
ൌ ߚଵ ߚ ହ
ୀଵ
ܺ
Hypotheses test
The following tests were conducted for the param-eters of the frontier models for the rice farmers in the study area:(1) frontier model specification for the data is of the cobb-Douglas Production function (that is,
H01 : βij = 0); (2) absence of inefficiency effects(that is, H02 : γ = 0); (3) the coefficients of determinants of inefficiency model equals zero (that is, H03 : δ0 = δ1 = = δ2 = δ3 = δ4 = 0). All these tests were carried out using generalized likelihood ratio statistics. The test statistics is defined by χ2 = –2 [L(H
0) – L(Ha)], where
L(H0) and L(Ha) are the values of the likelihood func-tion for the model under the null hypothesis, H0, and the alternative hypothesis, Ha, that are involved. The statistic has approximately χ2–distribution with degree of freedom equal to the number of parameters speci-fies to be zero in the null hypotheses. We assume that the tests of hypothesis are conducted so that the size are α = 0.05. Thus, if the χ2statistic exceeds the 95th
percentage point for the appropriate χ2-distribution, thenthe null hypothesis involved is rejected.
Allocative efficiency of inputs
This study follows the neoclassical theory of pro-duction to examine allocative efficiency of inputs, using the firm specific production function that has the highest associated iso-profit line. The iso-Profit line according to Yotopoulos and Lau (1973), implies that the firm was able to equate the marginal value product (MVPx) of each resources employed to its unit cost (Px).
MVPx is obtained, when slope of production func-tion (marginal product (MPx)) is equal to the slope of the iso-Profit line which is the ratio of the price of the factor inputs to the price of output (Px/Py)1 (Kalirajan, obwona 1994) as derived below:
MPx = Px/Py = Px × Py = Px = MVPX = Px
where: MPx × Py = MVPX
Therefore for this study, the choice of the functional form the makes marginal productivity conditions in equation above for profit maximization re-derived using the following expression because of the reasons outlined in the foot note below:
βji[Yi/Xij] = Px/Py = βji[Yi/Xij] × Py = Px
where βji is the elasticities of input; Yi/Xij is average product of j-th input; Pxj is price of the factor input;
Pyi is price of output; βji [Yi/Xij] is equivalent to the marginal product (MPx) of the input.
hence, for an optimum input utilization MVPx
equals Px. Then, if MVPx > (<) Px, there is disequi-librium in the use of inputs that is under utilization (over utilization), hence the use of such input must be increased (decreased) in order to improve the al-locative efficiency of the input by the farmer.
EMPIRICAL RESULTS AND DISCUSSIONS
Summary statistics
Table 1 presents summary statistics of the variables of interest in the analysis. They include the units, sample mean value, standard deviation, minimum and maximum values for each of the variables used in the analysis. The average paddy rice produced
per annum was approximately 678 kg/ha. Similarly, the average seeds planted, fertilizer and herbicides of approximately 36 kg/ha, 64 kg/ha and 2 litres/ha were obtained from the analysis.
however, the average labour utilization of 624 man-days was recorded for the study. The implication of the large average man days recorded point to the fact that an average rice farmer from the study depends heavily on human labour to do most of the farm operations – a characteristic feature of developing agriculture as their most farming operations are not mechanized.
Also, the result of the farmer’s socio-economic vari-ables shows that an average age, years of schooling, number of contact with extension agents and access to credit of approximately 42 years, 10 years, 6 and 0.64 respectively were obtained from the analysis. This shows that the farmers were relatively young. Similarly, numbers of the extension contacts and size access to credit shows that an average farmer has ac-cess to extension message and credit (over 60 percent have access to credit). An average n 68 300 was ac-cessed by the over 60% of the respondents ranging between n 20 000 and n 150 000 with 8% interest rate payable within a year [note 1$ = 145].
Resource-productivity of inputs
The interpretation of the parameters that enter the production function directly is given in the form of
partial production elasticities as a way of examining the degree of responsiveness of relative change in output as a result of relative change in input which also serve as a measure of resource-productivity of input. however, using the point estimate Table 2 shows that one percent increase in farm size, seeds, labour, fertilizer and herbicides increased rice production by 0.05%, 0.23%, 0.02%, 0.17% and 0.36% respectively
ceteris paribus with herbicides and labour having highest and least elasticities respectively.
The summation of the partial elasticities (∑εP) of the inputs is 0.83. This means that an increase in all inputs at the sample mean by one percent increased rice production by 0.83 percent which is significantly different from zero.
Allocative efficiency
[image:5.595.65.534.486.668.2]The result of whether the sampled farmers over- utilize, under-utilize or optimally utilize their level of inputs so as to assess the present level of production from the study is presented in Table 3. The results show that none of the farmers optimally use their inputs (that is, MVPx = Px). however, with respect to land, about 72% and 28% of the farmers under and over utilized the input respectively. Also, for seeds, about 89% and 11% of the respondents under and over utilized the input respectively. About 3% and 97% under and over utilized labour respectively. Almost 64% and 36% under- and over-utilized fertilizer
Table 1. Summary statistic of variables for the analysis
Variables Units Mean Std. deviation Minimum Maximum
output kilogram 834.81 1 102.79 115.00 6 700
Land hectare 1.23 3.49 0.10 4.80
Seeds kilogram 43.75 39.10 2.50 181.00
Labour man-day 624.31 801.07 82.00 1 415.00
Fertilizer kilogram 78.46 72.19 18.00 240.00
herbicides litre 2.15 2.56 1.30 5.80
Age year 42.07 69.25 22.00 74.00
Education year 10.18 11.03 0.00 16.00
Extension contact number 5.56 3.74 1.00 8.00
credit 1 = yes; 0 = no 0.64 0.48 0.00 1.00
Table 2. Elasticity of production and return to scale
Elasticities(εi) εP1 εP2 εP3 εP4 εP5 ∑εP = rTS
Estimates 0.05 0.23 0.02 0.17 0.36 0.83
[image:5.595.62.531.710.743.2]respectively, while about 80% and 20% under- and over-utilized herbicides respectively. The implica-tion of these findings suggest that, increasing the use of land, seeds, fertilizer and herbicide will add to the total profit by minimizing the costs of these variables in an efficient manner while increasing use of labour will reduce the total profit (increasing the cost of labour). hence, the size of labour force employed should be reduced to increase the profit margin of the farmers ceteris paribus.
A comparative analysis of resource-use efficiency of the inputs as confirmed by the imput demand elasticites and MVPs for the inputs shows that both results gave similar findings. The under-utilization of variable inputs such as land, seeds, fertilizers and herbicides and over utilization of labour is a reflection of the general performance of the inputs in terms of their degree of responsiveness of change in average rice produce to change in the inputs which ranges between 0.02%–0.36% per farmer per annum from the analysis.
The reasons for this relative performance of the inputs can be traced to a lot of factors, one of which is followed on the part of the farmers to follow the recommended use of input. Take for the instance
quantity of seed planted. The recommended amount of seeds per hectare for rainfed rice production system was put at 100 kg/ha (irri 1995).This study, however, found an average 36 kg/ha far less than the recom-mended rate. For labour, the poor performance can be traced to the high average man-days of about 624 obtained from the analysis which is a clear indica-tion of over-utilizaindica-tion of labour as labour exhibited decreasing return to scale faster than other inputs, thereby contributing less to the quantity of rice pro-duce as confirmed by the two results.
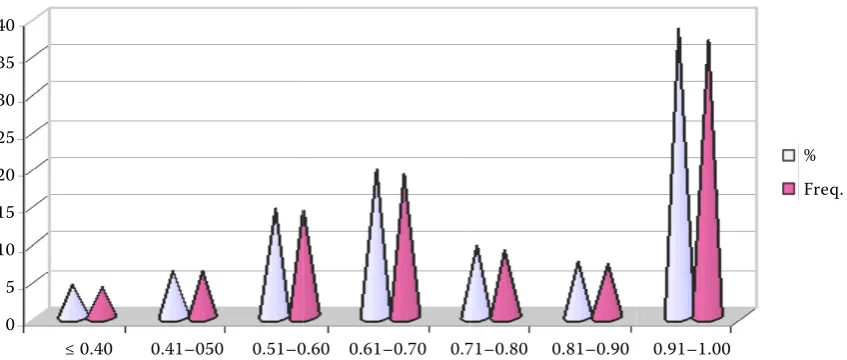
Technical efficiency analysis
[image:6.595.65.534.86.184.2]Figure 1 shows a bar chart of the predicted techni-cal efficiencies for the sampled farmers in percentage and frequency distribution. The minimum estimated technical efficiency is 0.285, the maximum is 0.997 while the mean is 0.754 with a standard deviation of 0.325. The implication of this statistics is that in the short run, there is a scope for increasing rice production by 24.6 percent by adopting techniques used by the best practice rice farmers. This further suggest that in average approximately 25 percent of rice yield is lost because of inefficiency.
Table 3. Frequency distribution of respondents and input – specific allocative efficiencies of the selected inputs
Decisions
inputs
land seeds labour fertilizer herbicides
freq. % freq. % freq. % freq. % freq. %
MVPx > Px 69 72 85 89 3 3 61 64 77 80
MVPx < Px 27 28 11 11 93 93 35 36 19 20
Total 96 100 96 100 96 100 96 100 96 100
40 35 30 25 20 15 10 5 0
≤ 0.40 0.41–050 0.51–0.60 0.61–0.70 0.71–0.80 0.81–0.90 0.91–1.00
[image:6.595.90.514.565.745.2]% Freq.
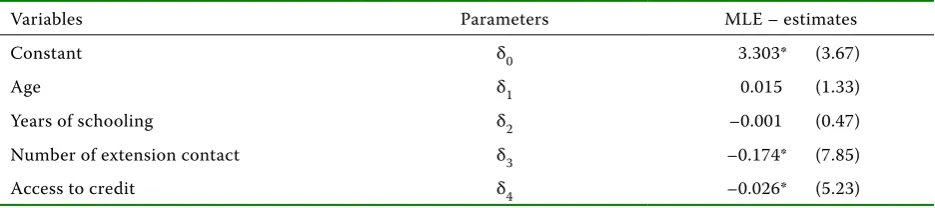
Determinants of technical inefficiency
Table 4 contains the result for the regression analysis of the determinants of technical inefficiency of rice production under the rainfed production system. The result shows that the farmer’s years of schooling (educational level), numbers of contacts with exten-sion agents and access to credit negatively influence the technical inefficiency of the farmers (that is, technical inefficiency decreased) while the age of farmer positively influences the technical inefficiency of the farmers. Surprisingly, years of schooling are not statistically significant at (ρ = 0.05), so also is the age of the farmer while numbers of contacts with extension agents and access to credit are significant different from zero at (ρ = 0.05). The implication of this is that increasing numbers of contact with exten-sion agents can bridge the gap between the efficient and inefficient rice farmers from the study area. As such approaches stimulate farmer’s adoption of agri-cultural technologies which in the long run shits the farmer’s production frontier upward. Lastly, access to credit improves the farmers allocative efficiency of resources thereby enables them to produce at a minimum input cost. credit availability shifts the
cash constraint outward, enabling the farmers to timely purchase agricultural inputs that they cannot provide from their own resources.
The result of determinants of technical inefficiency from this study is in line with previous studies. The positive but not statisticaly significant with technical efficiency of education, is similar with the findings in nigeria (ogundari 2006), Bangladesh (rahman 2003), Ethiopia (Weiler 1999) and cameroon (Binam et al. 2004). Similarly, the result of extension is consistent with the findings of Feeder et al. (2004), Binam et al. (2004), and rahman (2003). Also, the positive effect of credit availability on TE is not surprising. Similar results have been reported by Ali et al. (1996), Binam et al. (2004) and Abdula and huffman (1988).
Results of hypotheses test
[image:7.595.64.532.434.538.2]Table 5 presents the results of null hypotheses of interest. The first null hypothesis was rejected as the computed Lr is greater than the tabulated χ2. hence, trans-log functional form was selected for the analy-sis. Likewise, the result of the second hypothesis was strongly rejected, indicating that the there is presence of technical inefficiency effects in the production.
Table 4. Estimates of determinants of technical inefficiency
Variables Parameters MLE – estimates
constant δ0 3.303* (3.67)
Age δ1 0.015 (1.33)
Years of schooling δ2 –0.001 (0.47)
number of extension contact δ3 –0.174* (7.85)
Access to credit δ4 –0.026* (5.23)
Figures in parentheses are t-ratio
[image:7.595.65.533.612.708.2]* Estimate is significant at 5% level of significance
Table 5. generalized likelihood ratio test of hypotheses for parameters of stochastic production frontier and technical inefficiency factors
null hypotheses L(h0) L(ha) Lr χ2-critica value Decision
Production function is cobb-Douglas
(i.e. h01: βjk = 0) –25.81 36.12 123.87 24.38 reject
Absence of inefficiency
(h02: γ = 0) 11.76 36.12 48.73 11.91* reject
no technical effect
(h03: δ1 = δ2 = δ3 = δ4 = 0) 19.54 36.12 33.16 7.05 reject
confirming this result further is the result of the gamma (γ) of 0.873 of the preferred model in the lower part of Table 6. γ is very close to one and significantly different from zero, thereby establishing the fact that high level of inefficiencies exist among the sampled farmers. Whereas, on further analysis it was revealed that 71.4% (γ*) of differences between the observed and best practice output or total variance from the frontier output can be attributed to inefficiency effect or existence of differences in efficiency among the farmers. The third null hypothesis was also rejected. This means that the determinants of the technical
inefficiency significantly contribute to the differences in the farmer’s technical efficiencies.
CONCLUSIONS AND POLICY IMPLICATION
Conclusions
[image:8.595.70.533.264.732.2]The objective of this study was to examine the resource-productivity, allocative efficiency and de-terminants of technical inefficiency of rainfed rice farmers in nigeria. results of resources-use efficiency
Table 6. Estimates of the stochastic frontier production function
Variables Parameters restricted model (preferred model)general model
Frontier estimates
constant β0 2.17* (2.04) 2.61* (6.93)
ℓn land β1 0.16* (2.66) 0.05* (4.83)
ℓn planting materials β2 0.02* (2.74) 0.23* (8.32)
ℓn labour β3 0.15 (0.79) 0.02* (2.06)
ℓn fertilizer β4 0.10* (4.89) 0.17* (2.59)
ℓn herbicides β5 0.29* (4.44) 0.36* (7.01)
[0.5 ℓn land]2 β
11 – 0.29 (1.44)
[0.5 ℓn planting materials]2 β
22 – 0.14* (4.57)
[0.5 ℓn labour]2 β
33 – –0.04 (1.49)
[0.5ℓn fertilizer]2 β
44 – 0.03* (2.98)
[0.5ℓn herbicides]2 β
55 – 0.07* (6.50)
[ℓn land × ℓn planting materials] β12 – 0.14 (1.32)
[ℓn land × ℓn labour] β13 – –0.03 (1.47)
[ℓn land × ℓn fertilizer] β14 – 0.05*(2.37)
[ℓn land × ℓn herbicides] β15 – 0.01* (4.31)
[ℓn planting materials × ℓn labour] β23 – –0.10 (1.79)
[ℓn planting materials × ℓn fertilizer] β24 – 0.11* (3.05)
[ℓn planting materials × ℓn herbicide] β25 – 0.03 (1.51)
[ℓn labour × ℓn fertilizer] β34 – 0.02* (8.78)
[ℓn labour × ℓn herbicide] β35 – –0.06 (1.75)
[ℓn fertilizer × ℓn herbicide] β45 – 0.005* (3.91)
Variance parameters
Sigma square σ2s 0.415 (7.70) 0.109* (2.34)
gamma γ 0.921 (22.73) 0.873* (5.12)
γ/[γ + (1– γ) π/(π–2)] γ* 0.809 0.714
Log likelihood function LLF –25.81 36.12
Figures in parentheses are t-ratio
as confirmed by the input-demand elasticities and allocative efficiency revealed that both findings are similar and complement each other. rice production under rainfed production system has the highest re-sponse to land, then to herbicide, followed by seed, fertilizer and labour with contribution to total output varied between 0.02% to 0.36%. Similarly, the MVPs of these variables shows that the variables were either under- or over-utilized which might have accounted for the relative contribution to the total rice produc-tion from the study.
however, the result for labour in both cases shows that the use of more labour decreased the rice pro-duction much faster than any of the included vari-ables-an indication of over-utilization of labour in rice production from the study area.
in a related development, average TE of approxi-mately 75% obtained shows that about 25% variation of observed rice yield from the frontier output can be attributed to difference in farmer’s technical ef-ficiency. This can trace to none optimal use of inputs and inefficiency effects observed among the produc-tion unit. Years of schooling, extension contact and access to credit decreased the technical inefficiency of the farmers with extension contact and access to credit significantly different from zero.
Policy implications
in view of current global drive towards millennium development goal (MDg), nigeria as a part of such drive should as a matter of fact integrate within the present presidential initiative on rice production, a food policy measure that will strategically ensure that rice farmers in the in the country follows ap-propriated farm practices/recommendation in course of technology adoption. however, a more realistic package that will increase the ratio of the number of farmer to extension contacts should be pursued as a vital step towards this in the country.
Another matter of policy concern is the issue of the farm labour supply. over-utilization of labour – a characteristic of a developing agriculture like that of nigeria could be eroded gradually if nigeria gov-ernment seriously considers in reality technological substitution. So that excessive labour supply could be push into secondary sector of the economy such as processing industry with a carefully plan program as currently pursued by the ondo State government through her Accelerated Poverty Alleviation Agency (APAA). These approaches will in long run push the farmer’s production frontier forward as these will create the enabling environment which will decrease
the technical inefficiency of rainfed rice production system in nigeria. This is expedient as statistics from the Federal Bureau of Statistic of nigeria website revealed that a greater number of rice produced in the country still comes through rainfed/upland rice production system in nigeria.
REFERENCES
Abdula A., Eberlin r. (2001): Technical efficiency during economic reform in nicaragua: Evidence from farm household survey data. Economic Sys-tems, 25: 113–125.
Abdula A., huffman W.E. (1988): An examination of profit inefficiency of rice farmers in northern ghana: Working paper in Deptartment of Econom-ics, iowa State University, Ames, U.S.A.
Adeniyi J.P. (1988): Farm size and resources-use ef-ficiency in small scale agricultural production: The case of rice farms in Kwara State of nigeria. The niger Agricultural Journal, 23 (2): 43–50.
Aigner D.J., Lovell c.A.K., Schmidt P. (1977): For-mulation and estimation of stochastic frontier production models. Journal of Econometrics, 6: 21–32.
Akpokodge g., Lancon F., Evenstein o. (2001): The nigeria rice economy in a competitive world; con-straints, opportunities and strategic choices. West Africa rice Development Association (WArDA), Abidjan.
Ali F., Parikh A., Shah M.K. (1996): Measurement of efficiency using the behavioral and stochastic cost frontier approach. Journal of Policy Modeling. 18
(3): 271–287.
Battese g.E., coelli T.J. (1988): Prediction of farm – level technical efficiencies with a generalized frontier production function and panel data. Jour-nal of Econometric, 38: 387–399.
Battese g.E., coelli T.J. (1995): A model for techni-cal inefficiency effects in a stochastic frontier production for panel data. Empirical Economics,
20: 325–332.
Binam J.n., Tonye n.W., nyambi g., Akoa M. (2004): Factors affecting the technical efficiency among smallholder farmers in the slash and burn ag-riculture zone of cameroon. Food Policy, 29: 531–545.
cBn (2005): Annual report and Statement of Ac-counts central Bank of nigeria. Abuja, nigeria. coelli T.J., Prasada rao D.S, Battese g.E. (1998):
coelli T.J. (1996): A guide to Frontier Version 4.1c: A computer Program for Stochastic Frontier pro-duction and cost Function Estimation. Working Paper, Department of Econometrics, University of new England, Armidele, Australia.
Feeder g., Murgai r., Quizion J.B. (2004): Sending farmers back to school: the impact of farmer field schools in indonesia. review of Agricultural Eco-nomics, 26: 45–62.
irri (1995): World rice Statistics. international rice research institute Metro Manila, Philippine, pp. 34–42.
Jondrow J., Lovell c.A K., Materov i., Schmidt P. (1982): on the estimation of technical inefficiency in the stochastic frontier production function model.Journal of Econometrics, 19: 233–238. Kalirajan K.P., obwona M.B. (2004): A measurement
of firm- and input-specific technical and allocative efficiencies. Applied Economics, 26: 393–398. Kodde D.A., Palm F.c. (1986): Wald criteria for jointly
testing equity and inequality restrictions. Econo-metrica, 54: 1243–1248.
Meeusen W., Van den Broeck J. (1977): Efficiency estimation from cobb- Douglas production
func-tions with composed error. international Economic review, 18: 435–444.
ogundari K. (2006): Determinants of profit efficiency among small scale rice farmers in nigeria. A profit function approach. research Journal of Applied Sciences, 1 (1–4): 116–22.
rahman S. (2003): Profit efficiency among Bangla-deshi rice farmers. Food Policy, 28: (5–6): 487– 503.
Singh B.n., Fagade S., Ukwungwu M.n., William c., Jagtap S.S., oladimeji o., Efisue A., okhidievbie o. (1997): rice growing environment and biophysical constraints in different agro-ecological zones of nigeria. Meteorology Journal, 2 (1): 35–44. Weiler S. (1999): The Effects of Education on Farmer
Productivity in rural Ethiopia. Working Paper cSAE WPS99-7. center for the Study African Eco-nomics, University of oxford.
Yotopolous P.A., Lau L.J. (1973): A test of relative economic efficiency and application to indian agriculture: Some further results. American Eco-nomic review, 63: 214–223.
Arrived on 26th november 2007
Contact address:
ogundari Kolawole,george August Universität, Department für Agrarökonomie und rurale Entwicklung, Platz der göttinger Sieben 5,D-37073 göttingen, germany