SELECTION FOR MULTIPLE TRAITS IN UPLAND RICE PROGENIES USING THE Z INDEX
Danielle Coutinho Ribeiro, Isabela
dos Santos, Cínthia Souza Rodrigues, *Flávia Barbosa Silva Botelho, Luiz Eduardo Bertolo,
Felipe Pierobon, Gabriele Carvalho
Department of Agriculture,
ARTICLE INFO ABSTRACT
Rice research institutions have been dedicated to solve problems related to increasing grain yield and enhance the performance of rice lines for important agronomic qualitative traits.However, breeding for multiple traits is difficult since traits frequent
between each other. Among all alternatives to deal with multiple traits, index selection is expected to be the most efficient and the easier choice in many crops.Therefore, the aim of this study was to s upland rice progenies for important agronomic traitssimultaneously using the Z index approach. Genotypes from the Upland Rice Breeding Program from the Federal University of Lavras, MG, Brazilwere evaluated for plant height, number of days to floweri
resistance, grain discoloration resistance, brown spot resistance, and leaf scald resistance using a simple square lattice 14x14 design comprising of 192 progenies F
cultivars.The
except plant height, and the genotypes means ofZwere compared according to the Scott approach. The phenotypic selection was performedfirst for plant height, and
index. Of the 196 progenies, 96 were selected for plant height, and of these, 60 were selected for the Z index, corresponding of a selection intensity of 30%. The progenies that stood out considering the traits separatelyalso showed
upland rice genotypes for multiple traits simultaneously.
Copyright © 2016 Danielle Coutinho Ribeiro et al. This
unrestricted use, distribution, and reproduction in any medium, provided the original work is properly cited.
INTRODUCTION
Rice (Oriza sativa) is a grass from the genus second most consumed cereal in the world (
2006). Brazil is the main producer of rice outside Asia, producing about 12.39 million of tons of grains in the 2014/2015 growing season.However, projections of the planted area point to a significant reduction in the coming years, especially of upland rice, which the harvest in the 2014/2015 season decreased 1.2% compared to 2013/2014 growing season. This fact is rather disturbing since the consumption tends to increase significantly in the next few years.
years, rice research institutions in Brazil have been dedicated to solve problems related to increasing grain yield and enhance
*Corresponding author: Flávia Barbosa Silva Botelho
Department of Agriculture, Federal Universityof Lavras, P.O. Box 3037, 37200-000, Lavras, Minas Gerais, Brazil
ISSN: 0975-833X
Vol.
Article History:
Received 15th November, 2015 Received in revised form 22nd December, 2015 Accepted 15th January, 2016 Published online 14th February,2016
Key words:
Oryza sativa, Plant breeding, Index selection, Quantitative genetics.
Citation:Danielle Coutinho Ribeiro, Isabela Pereira de Lima, Marcela Pedroso Mendes, Heloisa et al. 2016. “Selection for multiple traits in upland rice progenies using the
RESEARCH ARTICLE
SELECTION FOR MULTIPLE TRAITS IN UPLAND RICE PROGENIES USING THE Z INDEX
Danielle Coutinho Ribeiro, Isabela Pereira de Lima, Marcela Pedroso Mendes, Heloisa Oliveira
dos Santos, Cínthia Souza Rodrigues, *Flávia Barbosa Silva Botelho, Luiz Eduardo Bertolo,
Felipe Pierobon, Gabriele Carvalho, Moizés de Souza Reis and Natalia Botega Alves
Federal Universityof Lavras, P.O. Box 3037, 37200
Minas Gerais, Brazil
ABSTRACT
Rice research institutions have been dedicated to solve problems related to increasing grain yield and enhance the performance of rice lines for important agronomic qualitative traits.However, breeding for multiple traits is difficult since traits frequently show a not always positive phenotypic correlation between each other. Among all alternatives to deal with multiple traits, index selection is expected to be the most efficient and the easier choice in many crops.Therefore, the aim of this study was to s upland rice progenies for important agronomic traitssimultaneously using the Z index approach. Genotypes from the Upland Rice Breeding Program from the Federal University of Lavras, MG, Brazilwere evaluated for plant height, number of days to floweri
resistance, grain discoloration resistance, brown spot resistance, and leaf scald resistance using a simple square lattice 14x14 design comprising of 192 progenies F
cultivars.The Z index was obtained per plot from the sum of the standardized values of the six traits, except plant height, and the genotypes means ofZwere compared according to the Scott approach. The phenotypic selection was performedfirst for plant height, and
index. Of the 196 progenies, 96 were selected for plant height, and of these, 60 were selected for the Z index, corresponding of a selection intensity of 30%. The progenies that stood out considering the traits separatelyalso showed the best index, indicating that the Z index was efficient in selecting upland rice genotypes for multiple traits simultaneously.
This is an open access article distributed under the Creative Commons Att use, distribution, and reproduction in any medium, provided the original work is properly cited.
) is a grass from the genus Oryza and the second most consumed cereal in the world (Guimarães et al., ). Brazil is the main producer of rice outside Asia, producing about 12.39 million of tons of grains in the 2014/2015 growing season.However, projections of the planted area point to a significant reduction in the coming years, hich the harvest in the 2014/2015 season decreased 1.2% compared to 2013/2014 growing season. This fact is rather disturbing since the consumption tends to increase significantly in the next few years. For many have been dedicated to solve problems related to increasing grain yield and enhance
*Corresponding author: Flávia Barbosa Silva Botelho
Department of Agriculture, Federal Universityof Lavras, P.O. Box
the performance of rice lines for important agronomic qualitative traits. However, many regions with great productive and market potential are not farmed due to the absence of rice cultivars best suited to specific environments.
upland rice plays a strategic role enabling rice cropping in regions where is not possible to flood.
had an important part during the occupation of new agricultural areas in the Brazilian west region known as “cerrado”. This occupation had its pea
1975 and 1985, when upland rice farming reached more than 4.5 millions ha. However, in the last few years upland rice cultivation dropped due to the competition with other crops and to the absence of new modern cultivars. To release cultivar, it must have a higher performance than the current cultivars in the market, so plant breeders need to evaluate the progenies for multiple traits (Ramalho
rice breeding programs, besides grain yield, agronomic trait precocity, plant height, grain quality, and pathogen resistance International Journal of Current Research
Vol. 8, Issue, 02, pp.25924-25928, February, 2016
INTERNATIONAL
Danielle Coutinho Ribeiro, Isabela Pereira de Lima, Marcela Pedroso Mendes, Heloisa Oliveira dos Santos, Cínthia Souza Rodrigues,
Selection for multiple traits in upland rice progenies using the Z Index”, International Journal of Current Research,
SELECTION FOR MULTIPLE TRAITS IN UPLAND RICE PROGENIES USING THE Z INDEX
Pereira de Lima, Marcela Pedroso Mendes, Heloisa Oliveira
dos Santos, Cínthia Souza Rodrigues, *Flávia Barbosa Silva Botelho, Luiz Eduardo Bertolo,
and Natalia Botega Alves
Box 3037, 37200-000, Lavras,
Rice research institutions have been dedicated to solve problems related to increasing grain yield and enhance the performance of rice lines for important agronomic qualitative traits.However, breeding ly show a not always positive phenotypic correlation between each other. Among all alternatives to deal with multiple traits, index selection is expected to be the most efficient and the easier choice in many crops.Therefore, the aim of this study was to select upland rice progenies for important agronomic traitssimultaneously using the Z index approach. Genotypes from the Upland Rice Breeding Program from the Federal University of Lavras, MG, Brazilwere evaluated for plant height, number of days to flowering, neck blast resistance, leaf blast resistance, grain discoloration resistance, brown spot resistance, and leaf scald resistance using a simple square lattice 14x14 design comprising of 192 progenies F2:4 and four commercial upland rice
Z index was obtained per plot from the sum of the standardized values of the six traits, except plant height, and the genotypes means ofZwere compared according to the Scott-Knott approach. The phenotypic selection was performedfirst for plant height, and then considering the Z index. Of the 196 progenies, 96 were selected for plant height, and of these, 60 were selected for the Z index, corresponding of a selection intensity of 30%. The progenies that stood out considering the the best index, indicating that the Z index was efficient in selecting
is an open access article distributed under the Creative Commons Attribution License, which permits
erformance of rice lines for important agronomic However, many regions with great productive and market potential are not farmed due to the absence of rice cultivars best suited to specific environments. In this sense, a strategic role enabling rice cropping in e is not possible to flood. In the 60’s, upland rice had an important part during the occupation of new agricultural areas in the Brazilian west region known as “cerrado”. This occupation had its peak in the period between 1975 and 1985, when upland rice farming reached more than 4.5 millions ha. However, in the last few years upland rice cultivation dropped due to the competition with other crops and to the absence of new modern cultivars. To release a new cultivar, it must have a higher performance than the current cultivars in the market, so plant breeders need to evaluate the Ramalho et al., 2012). In upland rice breeding programs, besides grain yield, agronomic traits as precocity, plant height, grain quality, and pathogen resistance INTERNATIONAL JOURNAL OF CURRENT RESEARCH
Oliveira dos Santos, Cínthia Souza Rodrigues,
are the main traits considered in the selection. However, breeding for multiple traits is generally more difficult than breeding for a single-trait alone due to the phenotypic correlation that traits frequently show (Bernardo, 2010). The index selection involves selecting for several traits simultaneously on the basis of a single index value (Bernardo, 2010; Falconer and Mackay, 1996). It is usually a linear combination of the different traits and accounts for the relative superiority of progenies for all traits included in the index (Bernardo, 2010). Among all alternatives to deal with multiple traits, index selection is expected to be the most efficient and the easier choice in many crops (Bernardo, 2010; Hazel and Lush, 1942; Missio et al., 2004; Vieira et al., 2005; Smiderle, 2015). Mendes et al. (2009) proposed the Z index, obtained from the standardization of the data from each characterper plot, allowing a statistical inference about the indices values associated to the progenies (Ramalho et al., 2012). Despite its easy application, no reports were found in upland rice breeding. Therefore, the aim of this study was to select upland rice progenies simultaneously for plant height, number of days to flowering, neck blast resistance, leaf blast resistance, grain discoloration resistance, brown spot resistance, and leaf scald resistance using the Z index approach in order to guide the recommendation of new cultivars to the state of Minas Gerais-Brazil.
MATERIAL AND METHODS
Genotypes from the Upland Rice Breeding Program from UFLA were evaluated for (i) plant height (cm), taken from the ground to the tip of the main panicle; (ii) number of days to flowering, taken from sowing to when 50% of the plants of each plot showed panicle; (iii) neck blast resistance, caused by the fungus Magnaportheoryzae; (iv) leaf blast resistance, also caused by the fungus Magnaportheoryzae; (v) grain discoloration resistance, caused by a complex of multiple fungus and bacteria; (vi) brown spot resistance, caused by the fungus Bipolarisoryzae; and (vii) leaf scald resistance, caused by the fungus Microdochiumorizae. All diseases were evaluated using a grading scale from 1 to 9, which 1 means no symptom and 9 means that all plot showed severe symptoms. The experiment was carried out in the 2014/2015 growing season at the experimental field of the Agriculture Department of UFLA inLavras-MG, Brazil (21º14'43"S, 44º59'59"W). It was used a simple square lattice 14x14 design with 196 rice genotypes comprising of 192 progenies F2:4 and four
commercial upland rice cultivars as checks. Plots consisted of two rows of 3 m spaced 35 cm with 80 seeds per meter. All cultivation practices necessary for the development of the crop were performed according to the technical recommendation for the environment, except that no fungicide was used becausedisease tolerance was part of the evaluation.
Selection index
First, it was performed the standardization (also called z transformation) of the data from each character, except plant height, according to:
zijk=
yijk−y.jk s.jk
where zijk was the standardized value of the plot containing the genotype i of the block j of the character k; yijk was the phenotypic value of the plot containing the genotype i of the block j of the character k; y.jk was the phenotypic mean of the block j of the character k; and s.jk was the phenotypic standard
deviation of the block j of the character k. Therefore, it was obtained a z value for each plot in each character. The selection Z index was obtainedper plot (zij) from the sum of the standardized values of the six characters (Ramalho et al., 2012):
zij= zijk 6
k 1
= zij1+zij2+ ⋯ +zij6
Analysis of variance was performedwith thezij index following the lattice design and using the statistical software R (R Development Core Team, 2012). The adjusted means were compared according to the Scott-Knott approach (Scott and Knott, 1974) with 5% of probability. The phenotypic selection was first performed considering the data from plant height. This trait was not accounted in the Z index because the ideal phenotype for plant height is intermediate. Therefore, before performing the selection using the Z index, it was selected genotypes with height between 95 cm and 105 cm. After selecting for plant height, it was used the Z index to perform the selection for the other six traits simultaneously. The desired phenotypes were the ones with lower scores of diseases and less number of days to flowering, so there were selected genotypes with low Z index distinguished by the Scott-Knott test. The phenotypic selection using both plant height data and Z index had an intensity of 30%.
RESULTS AND DISCUSSION
day-night temperature difference greatly favors the development of the disease. This is a very common environmental condition in most states of Brazil and it is extremely important the obtaining of upland rice lines with blast resistance by Brazilian rice breeding programs.
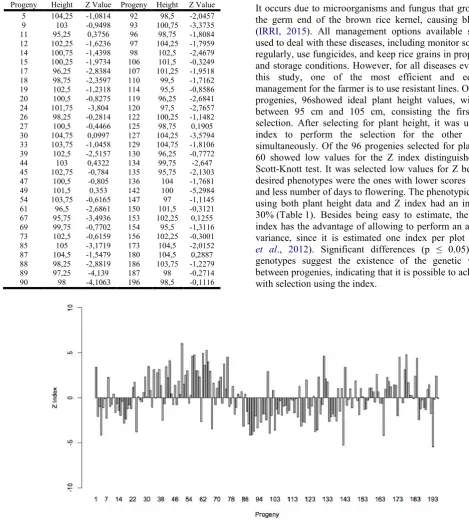
Table 1. Height (cm) and Z values of the 60 upland rice progenies selected
Progeny Height Z Value Progeny Height Z Value
5 104,25 -1,0814 92 98,5 -2,0457
9 103 -0,9498 93 100,75 -3,3735
11 95,25 0,3756 96 98,75 -1,8084
12 102,25 -1,6236 97 104,25 -1,7959
14 100,75 -1,4398 98 102,5 -2,4679
15 100,25 -1,9734 106 101,5 -0,3249
17 96,25 -2,8384 107 101,25 -1,9518
18 98,75 -2,3597 110 99,5 -1,7162
19 102,5 -1,2318 114 95,5 -0,8586
20 100,5 -0,8275 119 96,25 -2,6841
24 101,75 -3,804 120 97,5 -2,7657
26 98,25 -0,2814 122 100,25 -1,1482
27 100,5 -0,4466 125 98,75 0,1905
30 104,75 0,0997 127 104,25 -3,5794
33 103,75 -1,0458 129 104,75 -1,8106
39 102,5 -2,5157 130 96,25 -0,7772
44 103 0,4322 134 99,75 -2,647
45 102,75 -0,784 135 95,75 -2,1303
47 100,5 -0,805 136 104 -1,7681
49 101,5 0,353 142 100 -5,2984
54 103,75 -0,6165 147 97 -1,1145
61 96,5 -2,6861 150 101,5 -0,3121
67 95,75 -3,4936 153 102,25 0,1255
69 99,75 -0,7702 154 95,5 -1,3116
73 102,5 -0,6159 156 102,25 -0,3001
85 105 -3,1719 173 104,5 -2,0152
87 104,5 -1,5479 180 104,5 0,2887
88 98,25 -2,8819 186 103,75 -1,2279
89 97,25 -4,139 187 98 -0,2714
90 98 -4,1063 196 98,5 -0,1116
Brown spot and leaf scald also commonly occur in Central and South American where temperature and humidity favors fungus development (IRRI, 2015). Leaf scald usually occurs late in the season and is favorable by wet weather, high
nitrogen fertilization and close spacing, showing a scalded appearance of leaves. Although brown spot also affect coleoptile, leaf sheath, panicle branches, glumes and spikelet, its major damage are the big spots on the leaves, which can kill the whole leaf and cause as high as 45% yield loss.Grain discoloration drastically reduces the market value of rice since whiteness is an important quality characteristic for rice consumers.
It occurs due to microorganisms and fungus that grow around the germ end of the brown rice kernel, causing black spots (IRRI, 2015). All management options available should be used to deal with these diseases, including monitor soil fertility regularly, use fungicides, and keep rice grains in proper drying and storage conditions. However, for all diseases evaluated in this study, one of the most efficient and economical management for the farmer is to use resistant lines. Of the 196 progenies, 96showed ideal plant height values, with means between 95 cm and 105 cm, consisting the first step of selection. After selecting for plant height, it was used the Z index to perform the selection for the other six traits simultaneously. Of the 96 progenies selected for plant height, 60 showed low values for the Z index distinguished by the Scott-Knott test. It was selected low values for Z because the desired phenotypes were the ones with lower scores of disease and less number of days to flowering. The phenotypic selection using both plant height data and Z index had an intensity of 30% (Table 1). Besides being easy to estimate, the use of Z index has the advantage of allowing to perform an analysis of variance, since it is estimated one index per plot (Ramalho
et al., 2012). Significant differences (p ≤ 0.05) between
genotypes suggest the existence of the genetic variability between progenies, indicating that it is possible to achieve gain with selection using the index.
The variation of the Z values of progenies can be visualized in Figure 1. The efficiency of the Z index in selecting for multiple characters simultaneously can be checked examining the performance of the progenies selected considering each trait
separately. The performances of the four progenies that showed the best Z index (progenies 24, 89, 90, and 142) and of the four progenies that showed the worse Z index (progenies 11, 44, 49, and 180) are graphically represented in Figures 2 and 3, as proposed by Mendes et al. (2009).
[image:4.595.86.522.124.405.2]The graphics representing the performance of the progenies in Figure 2are denominated as “deflated ball”, meaning that the mean of mosttraits are equal or lower than the population mean.
Figure 2. Graphic representation of the estimated Z values for leaf blast resistance (Z LB),brown spot resistance (Z BS), leaf scald resistance (Z LS), neck blast resistance (Z NB), grain discoloration resistance (Z GD), and number of days to flowering (Z NF)
[image:4.595.93.522.462.737.2]of the four progenies (24, 89, 90 and 142) that showed the best Z index
Figure 3. Graphic representation of the estimated Z values for leaf blast resistance (Z LB),brown spot resistance (Z BS),leaf scald resistance (Z LS), neck blast resistance (Z NB), grain discoloration resistance (Z GD), and number of days to flowering (Z NF) of the four
On the other hand, the graphics representing the performance of the progenies in Figure 3 are denominated “full ball”, meaning that the mean of most traits are higher than the population mean. Since breeders are interested in lower scores of disease and less number of days to flowering, in this case, the progenies that produced deflated ball graphics were preferable. In Figure 2, it was possible to highlight the progenies 24 and 89, which showed low means for all traits compared to the population mean. The precocity of the progeny 142 was also outstanding, indicating that this line should have attention in breeding programs aiming to reduce rice lines cycle. In the graphical representation of the less promising progenies (Figure 3), it was possible to highlight the progeny 49, which was greatly susceptible to leaf blast and brown spot. Therefore, the use of Z index was efficient, since the progenies selected by the index were also superior considering the traits separately. It was also clear how the index made it easier to select for multiple traits, enhancing the efficiency of selection in breeding programs.
Conclusions
The Z index was efficient in selecting progenies for multiple traits simultaneously. The progenies 24 and 89 stood out in all evaluations and must have attention in Brazilian Upland Rice Breeding Programs.
Acknowledgements
Tothe Fundação de Amparo à Pesquisa do Estado de Minas Gerais (FAPEMIG)
REFERENCES
Bernardo, R. 2002. Breeding for quantitative traits in plants. Woodbury: Stemma, 368 p.
Falconer, D.S. and Mackay, F.C. 1996. Introduction to quantitative genetics. Longman, New York, 464 p.
Guimarães, Í. C. de O., Cornélio, V. M. de O., Reis, M. S. R., Soares, A. A., SOARES, P. C. 2006. Análise da contaminaçãofúngica em grãos de arroz. EPAMIG ARTIGO.
Hazel, L. N. and Lush, J. L. 1942. The efficiency of three methods of selection. The journal of heredity, 33: 393-399. Irri, 2015. International Rice Research Institute. Available in
<http://www.knowledgebank.irri.org/step-by-step-production/ growth/pests-and-diseases/diseases>Access in June 10th.
Lin, Y.R., Wu, S. C., Chen, S. E., Tseng, T. H., Chen, C. S., Kuo, S. C., Wu, H. P., Hsing, Y.I.C. 2011. Mapping of quantitative trait loci for plant height and heading date in two inter-subspecific crosses of rice and comparison across Oryza genus. BotanicalStudies, 52:1-14.
Mendes, F. F., Ramalho, M. A. P., Abreu, A. F. B. 2009. Índice de seleção para escolha de populaçõessegregantes de feijoeiro-comum. Pesquisa Agropecuária Brasileira, 44(10): 1312 – 1318.
Missio, R. F., Cambuim, J., Moraes, M. L. T., Paula, R. C. 2004. Seleçãosimultânea de caracteres em progênies de Pinus caribeaMorelet var. bahamensis. Sientia Florestalis, 66: 161 – 168.
R Development Core Team. R. 2012. A language and environment for statistical computing. R Foundation for StatisticalComputing, Vienna.
Ramalho, M. A. P., Abreu, A. F. B., Santos, J. B, Nunes, J. A. R. 2012. Aplicações da genética quantitativa no melhoramento de plantas autógamas, Lavras, Universidade Federal de Lavras, 522 p.
Resende, M. D. V., Duarte, J. B. 2007. Precisão e controle de qualidade em experimentos de avaliação de cultivares. Pesquisa Agropecuária Tropical, 37(3): 182-194.
Scott, A., Knott, M. 1974. Cluster-Analysis Method for Grouping Means in Analysis of Variance. Biometrics, 30: 507-512
Smiderle, E. C. 2015. Índice de seleção na identificação de progênies superiores de arroz de terras altas; Tese Mestrado, UFMT 2015.
Vieira, C., Borém, A., Ramalho, M. A. P., Carneiro, J. E. S. 2005. Melhoramento do feijão. In: BORÉM, A. (Ed.). Melhoramento de espéciescultivadas. Viçosa: UFV, 391p.