ISSN Online: 2331-4249 ISSN Print: 2331-4222
DOI: 10.4236/wjet.2018.64051 Nov. 6, 2018 780 World Journal of Engineering and Technology
Numerical Estimation of the Uneven Wear of
Passenger Car Tires
Sang Wook Lee, Kyoung Moon Jeong
*, Kee Woon Kim, Jang Hyeon Kim
R&D Center, Kumho Tire Co. Inc., Yongin, South Korea
Abstract
Tire wear is a very complicated phenomenon that is influenced by various factors such as tire material, structure, vehicle and road conditions. In order to evaluate tire wear, a method for measuring tire wear using the intensity of reflected light was presented [1]. It comprises applying a single layer of re-flected paint to a tread surface by spraying, and then measuring the intensity of light reflected from a matrix of blocks on the unworn tire. In this paper, a numerical technique for predicting the uneven wear of passenger car tire is presented. The uneven tire wear produced in wheel alignment condition with vehicle speed, camber angle, and toe angle is predicted by the frictional dy-namic rolling analysis of 3D patterned tire model. The proposed numerical technique is illustrated through the method of paint testing the wear on the tread surface of a tire.
Keywords
Tire, Uneven Wear, Finite Element Analysis, Frictional Energy
1. Introduction
Tire wear is a complex phenomenon that is affected by tire materials, structures, vehicle dynamics, and road conditions [2]-[7]. There are many approaches to a tire wear study, such as finite element method (FEM) and analytical method. With the advancement of computer technology and finite element techniques, FEM has been widely used in tire wear prediction [8][9][10][11][12]. The pat-tern shape, cross-section shape and tire structure parameters can be discussed or optimized to predict and reduce tire wear. Theoretical models have been devel-oped for tire wear and vibration. The papers [13]-[19] treated theoretical models of different types of tire wear, which focused on the physical processes of wear, the vibration modes of the tire and interaction between the tire and road, and so
How to cite this paper: Lee, S.W., Jeong, K.M., Kim, K.W. and Kim, J.H. (2018) Numerical Estimation of the Uneven Wear of Passenger Car Tires. World Journal of Engineering and Technology, 6, 780-793.
https://doi.org/10.4236/wjet.2018.64051
Received: September 10, 2018 Accepted: November 3, 2018 Published: November 6, 2018 Copyright © 2018 by authors and Scientific Research Publishing Inc. This work is licensed under the Creative Commons Attribution International License (CC BY 4.0).
DOI: 10.4236/wjet.2018.64051 781 World Journal of Engineering and Technology on. Theoretical models are helpful in understanding numerical results with physical mechanisms which are responsible for the generation of tire wear and their behavior at different values of tire parameters. There may be a possibility of indoor wear test [20][21][22]. The first method is evaluating wear energy of a new tire. Certainly, the wear energy is one of the most important indexes, but it is difficult to correctly evaluate uneven tire wear performance, because the tire wear performance changes as it wears. The second is indoor wear testing, but it is difficult to define the test conditions. For experimental approaches, it is ne-cessary to make a tire at least. It is well known that the profile or pattern of a tire has a significant effect on wear performance. If we could evaluate the tire wear performance by simulation, we wouldn’t even need to make a tire for the wear test, except for the last confirmation test. As a result, tire development could be more efficient, and if there is a problem with tire performance, we could correct the tire design earlier. Recently, Tamada and Shiraishi [23] developed the tire wear simulation. However, it is too difficult to simulate vehicle driving condi-tion.
In general, uneven tire wear compromises the life and performance of tires, the handling of vehicle, and safety. Chung and Lee [1] presented a method of testing uneven tire wear. It comprises applying a single layer of reflective paint to a tread surface by spraying, and then measuring the intensity of light reflected from a matrix of blocks on the unworn tire. The test run can be considerably shorter than test runs utilizing other methods. So, we started developing the method for measuring tire wear using intensity of reflected light using a finite element analysis. In this paper, a numerical technique for predicting the uneven wear of passenger car tire is presented. The tire frictional energy rates produced in each vehicle condition are computed by the frictional dynamic rolling analysis of 3D patterned tire model. The proposed numerical technique is illustrated through the method of paint testing the wear on the tread surface of a tire.
2. Problem Description
2.1. Uneven Tire Wear
Abnormal wear, which is more critical for its safety implications, includes two types: uneven wear and irregular wear. Uneven wear describes non-uniform dis-tribution of wear across tread pattern and irregular wear mainly characterizes circumferential wear vibration. Uneven tire wear is usually caused by improper alignment, over-inflation, under-inflation or a worn out suspension. Tires are an extremely important component of a passenger car. Excess wear on the inner or outer edge of the tire, known as “toe wear” or, in more extreme cases, as “camb-er wear”, suggests something may be wrong with the wheel alignment. Figure 1
DOI: 10.4236/wjet.2018.64051 782 World Journal of Engineering and Technology
Figure 1. The passenger car tires with the various uneven wear patterns [24].
edge on the other indicates failed struck or shock.
2.2. Method for Measuring Uneven Tire Wear
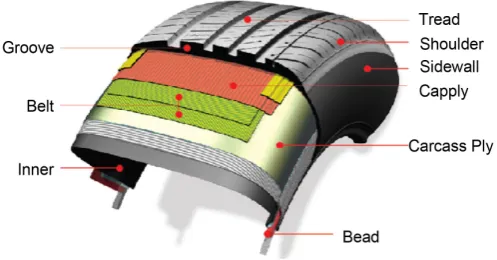
Referring to Figure 2 showing a structure of radial passenger car tire, the tread part is composed of rubber blocks and grooves in complex pattern for the sake of traction, braking, hydroplaning, and so on. Since the frictional slip is on the abrasive ground, it is not too much to say that the tire lifetime is determined by the tread wear performance. In general, the tread wear is characterized by the tread patterned shape (called the crown contour) and the pattern blocks as well as the rubber compound properties, so that the development of high wear-resisting tries can be achieved by appropriately designing these parameters [25].
Kumho Tire R&D Center developed the uneven tire wear measuring method
DOI: 10.4236/wjet.2018.64051 783 World Journal of Engineering and Technology
[image:4.595.209.540.238.297.2]Figure 2. The structure of a passenger car tire.
Figure 3. The precedure of uneven tire wear test.
the center and the shoulder of the tread pattern can be expressed by the uneven tire wear tendency. With this evaluation method, it is possible to study the de-sign factor influence of many tires in short time.
3. Finite Element Analysis of Tire
3.1. Tire Model
DOI: 10.4236/wjet.2018.64051 784 World Journal of Engineering and Technology
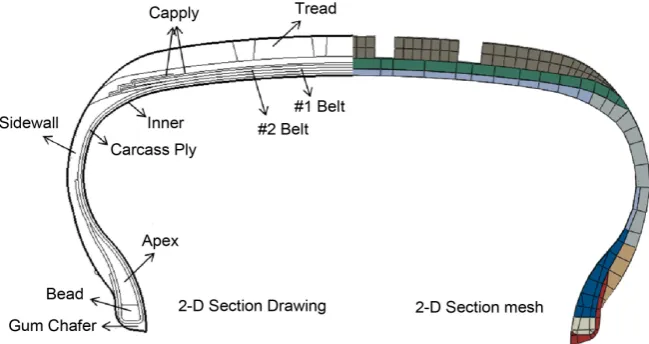
Figure 4. The 2-D section drawing and axisymetric simulation model of a tire.
region are modeled as homogenized solid.
Rubbers except for the FRR parts are modeled by the penalized first-order Mooney-Rivlin model in which the strain density function is defined by
(
)
(
)
(
)
(
)
21, , ;2 3 10 1 3 01 2 3 1 3 1
W J J J K C J C J J
K
= − + − + − (1)
where Ji are the invariants of the Green-Lagrangian strain tensor and C10 and C01 are the rubber material constants determined from the experiment. On the other hand, K is a sort of penalty parameter controlling the rubber in-compressibility. The shear modulus
τ
and the bulk modulusκ
of rubber are related as 2(
C10+C01)
=τ and K=2κ, from which one can easily obtain the following relation for Poisson’s relation:(
10 01)
(
10 01)
3 4K C C 2 3 2K C C 2
ν
= + − + + . It is clear that the incompres-sibility of rubber is asymptotically enforced as the penalty parameter approaches infinity, but the choice of K near 100 is usually recommended for the stable transient dynamic response with the reasonable time step size. Figure 4 shows a two-dimensional section mesh constructed according to the above-mentioned material modeling such that pure rubber solid, composite shell and homoge-nized solid elements are mixed.3.2. 3D Explicit Finite Element Approximation
The frictional dynamic rolling problem is formulated by the total Lagrangian method that refers to the original tire domain Ω0, together with the penalty method to enforce the dynamic contact and the material incompressibility. Neg-lecting the damping effect and introducing iso-parametric finite element basis functions
{
φI( )
X}
NI=1 into the penalized total Lagrangian formulation lead tothe following matrix equations:
int ext + =
DOI: 10.4236/wjet.2018.64051 785 World Journal of Engineering and Technology 0
ρ
0 T d 0Ω
=
∫
Φ Φ ΩM , (3)
( )
{
}
( )
0 0
T
T 0 0
0 d ds
c
int=
∫
Ω Ω +∫
∂Φ kp Φ ΦF B S d n n , (4)
( )
0 0 0
T
0 T d 0 T 0ˆds0 T 0ˆ ds0
N c
ext =
∫
Ω ρ Φ Ω +∫
∂Ω Φ +∫
∂Ω Φ tT +k gp nΦ F f t , (5)
where Φ is the
(
3 3× N)
matrix consisting of N basis functions and n is the inward unit vector normal to the contact boundary of the rigid road. And, kp is a penalty parameter, f is the body force, and g is the gap function. On the other hand, ˆ0T
t and tˆ0 are the frictional force and the external traction that are mapped to the initial configuration, and B0 and {S} are defined, respectively,
as
{
1}
0= 0, , , ,0I 0N
B B B B , (6)
{ }
{
}
T, , , , ,
xx yy zz xy yz zx
S S S S S S
=
S , (7)
where B0I is the
(
6 3×)
matrix containing the terms ∂φI ∂Xi multiplied by jkF [28].
The time integration of Equation (2) can be made using either the explicit scheme like central difference method or the implicit scheme like Newmark method. However for the large-scale dynamic analysis of highly nonlinear tire problem, the explicit central difference scheme is widely adopted. The main reason is that diagonalization of the mass matrix considerably reduces the CPU time. The observation time interval T is divided into a finite number of subin-tervals t nn
(
=0,1,2,3,)
, such that tn+1= + ∆tn tn. The lumped mass matrixM allows the Equation (2) to be written as
(
)
1
n n n
ext int
−
= −
d M F F (8)
in the explicit time incremental form. We note that n int
F and n ext
F are defined by replacing B0,
{ }
S , n, tˆ0 and tˆT0 in Equations (4) and (5) with the val-ues calculated at time stage tn, respectively. According to the central difference method, time-step-wise velocities and displacements are determined through(
)
1 2 1 1 2
n+ = −α n− + ∆t n
d d d (9)
1 1 2
n+ = n+ ∆tdn+
d d (10) where α ≅1.67ωmax∆tcrit. In order to secure the numerical convergence and sta-bility, the time step size should satisfy the following condition:
max 2 crit
t
ω
∆ ≤ (11)
with ωmax denoting the largest element frequency in the tire finite element mesh.
3.3. Frictional Energy Dissipation
The frictional energy density iF
DOI: 10.4236/wjet.2018.64051 786 World Journal of Engineering and Technology defined by
i i i i i i i
F x x y y
E =F s =F s F s+ (12) with the frictional shear force Fi and the relative slip distance si. In finite element analysis of tire dynamics contact problem, both the frictional force and the slip distance within the footprint region show remarkable fluctuation with time. Thus, the frictional energy density i
F
E is usually computed by time-integrating the nodal frictional energy density rate i
F
E defined by
( )
i i i
F c
E =
µ
N s (13)where µ is the frictional coefficient between tire surface and road, i c
N is the nodal contact force, and si is the absolute nodal slip rate. The total frictional energy can be obtained by summing i
F
E over all nodes located within the tire footprint region [29]. The frictional energy density is calculated by summation of the multiplication of instantaneous shear stress by slip between tire surface and road.
4. Uneven Tire Wear Analysis
4.1. Test and Evaluation
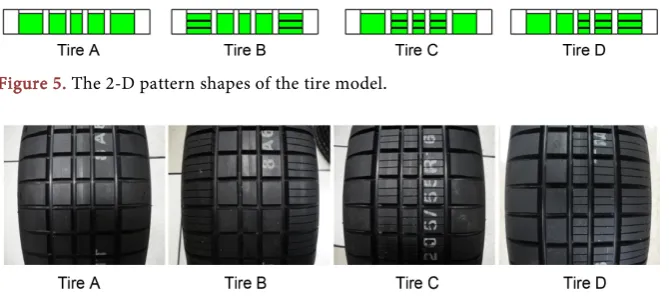
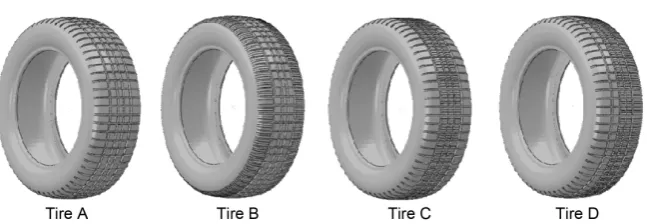
In order to measure the uneven tire wear, a Hyundai’s Avante car is used in this paper. Field measurements of vehicle are carried out on a 30 km proving ground in South Korea. One expert driver took part in the evaluation exercise with over 10 years. In order to estimate the uneven wear of tire, 4 pattern models as shown in Figure 5 are designed to perform the uneven tire wear test accord-ing to the pattern shape change. A tire with a size 205/55R16 is used for the test of uneven tire wear. Figure 6 shows the test tires with the various pattern shapes. The width of sipe is 1.5 mm and the groove angle in the depth direc-tion is 10 degrees. During testing the ground is dry and free of major debris. The proving ground is free of potholes and major cracking. There was very minimal wind observed throughout testing.
[image:7.595.208.543.560.710.2]In order to analyze the influence of the uneven tire wear due to the wheel alignment change of the vehicle, the test and evaluation are carried out for three
Figure 5. The 2-D pattern shapes of the tire model.
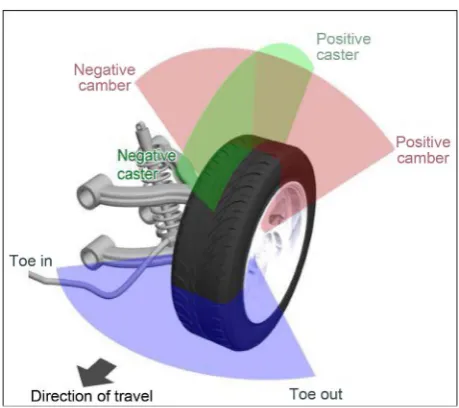
DOI: 10.4236/wjet.2018.64051 787 World Journal of Engineering and Technology test conditions recorded in Table 1. A wheel alignment system of a commercial vehicle shown in Figure 7 is the general term used to gloss over the three points
[image:8.595.207.539.404.492.2][30]. Camber is the tilt of the top of a wheel inwards or outwards (positive or negative). Proper camber (along with toe and caster) makes sure that the tire tread surface is as flat as possible on the road surface. If camber is out, it’ll get tire wear. Too much negative camber causes tread and tire wear on the inside edge of the tire. Consequently, too much positive camber causes wear on the outside edge. Toe is the term given to the left-right alignment of the front wheels relative to each other. Toe-in is where the front edge of the wheels is closer to-gether than the rear, and toe-out is the opposite. A typical symptom of too much toe-in will be excessive wear and feathering on the outer edge of the tire tread sections. Similarly, too much toe-out will cause the same feathering wear pat-terns on the inner edges of the tread pattern. The test conditions are taken for three expected uneven wear results such as even, outside fast, or inside fast wear.
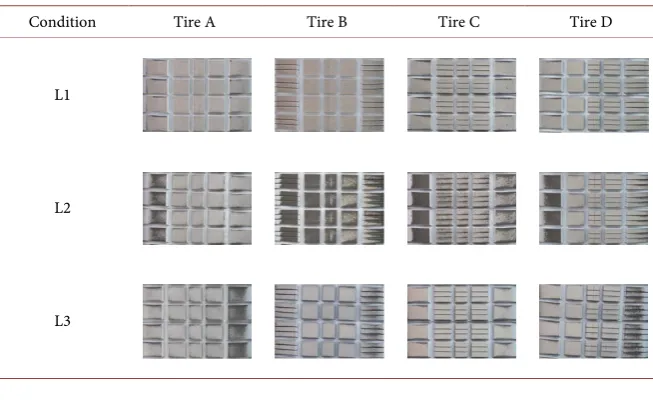
Table 2 shows the results of the tread surface images with the different uneven
[image:8.595.209.536.534.734.2]wear amount under three loading conditions. As expected, the uneven tire wear phenomenon can be detected according to the wheel alignment conditions. The area of the image that has a darker color is worn. L1 condition is even wear, L2 is outside fast wear, and L3 is inside fast wear. It can be seen that the uneven tire wear depends on wheel alignment of the vehicle.
Table 1. Wheel alignment conditions taken for three expected uneven wear results.
Test Condition Wheel Alignment Uneven Wear Expected Camber Angle [deg.] Toe Angle [deg.]
L1 −0.62 −0.02 (Normal Condition) Even Wear L2 −2.23 −0.33 Outside Fast Wear L3 0.86 0.31 Inside Fast Wear
Table 2. The tread surface images with the different wear amount under three test condi-tions.
Condition Tire A Tire B Tire C Tire D
L1
L2
DOI: 10.4236/wjet.2018.64051 788 World Journal of Engineering and Technology
Figure 7. A wheel alignment system of a commercial vehicle.
4.2. Numerical Analysis
The frictional dynamics rolling analyses are performed by ABAQUS/Explicit method [27], and driving mode is implemented after the tire reaches the steady-state dynamic rolling. Here, the steady-state rolling of a tire with the pre-set vehicle speed is reached by a series of three sequential simulations: inflation up to the preset inflation pressure, contact with the road by the action of vertical force, and linear acceleration from rest to the desired uniform speed. The inter-nal pressure and the uniform vehicle speed are given by 220.6 kPa and 30 km/h, and the frictional coefficient between tire surface and road is set by 0.8. The in-ternal pressure and vertical force are applied at the center of the wheel. Vehicle speed and wheel alignment with dynamic behavior is reflected by moving the road.
Figure 8 shows the 3D finite element models of tires with four pattern shapes.
The tread and body meshes are separately generated at the beginning and then both are to be assembled by the incompatible surface-to-surface tying algorithm supported by ABAQUS [27]. The 3D body mesh can be easily generated by a simple revolution of its 2D section mesh, but the generation of the 3D tread mesh is not so simple owing to the complexity of tread blocks and grooves. The 3D tread mesh is constructed by our in-house program, which utilizes a series of basic meshing operations. The reader may refer to previous paper [31] for more details on the tread mesh generation and the incompatible tying algorithm.
DOI: 10.4236/wjet.2018.64051 789 World Journal of Engineering and Technology
Figure 8. The 3D patterned tire finite element models with four pattern shapes.
Figure 9. A contact pressure distribution within the footprint.
is slightly higher than that of the center block.
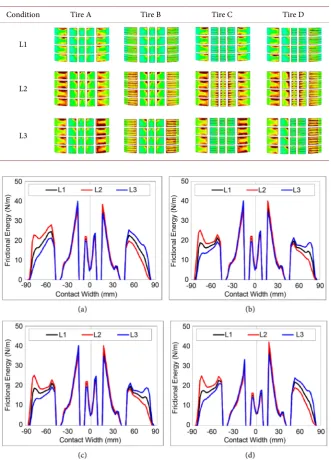
The contours of the frictional energy distribution just after the wheel align-ment conditions given in Table 1 are applied and shown in Table 3 for four tires. The red color in the contours shows a high frictional energy, indicating that wear is fast. In the uniform wear condition (L1), the frictional energy is slightly higher in the shoulder block than in the center block. And, the distribu-tion of the fricdistribu-tional energy of the inside and outside shoulder blocks is similar. The L2 condition has a high frictional energy on the outside shoulder block (Left), and the L3 condition has a high frictional energy on the inside shoulder block (Right). From the simulation results shown in Table 3, the distribution of frictional energy is similar to the test results shown in Table 2. For the quantita-tive comparison of test and simulation results, we use the ratio of the frictional energy of the center block to the shoulder block. And, the shoulder block is cal-culated by dividing inside block and outside block because L2 or L3 condition is outside or inside fast wear.
Figure 10 shows the graph of frictional energy distribution with respect to
contact width under wheel alignment conditions. The frictional energy of the center block does not change with the different condition, but the shoulder block is different. It is shown that the outside or inside fast wear under L2 or L3 condi-tion is caused by the wheel alignment condicondi-tions. L2 condicondi-tion is a negative camber angle and toe-in. It makes high footprint pressure and slip of the out-side. On the other hand, L3 condition is a positive camber angle and toe-out. It also makes high footprint pressure and slip of the inside.
DOI: 10.4236/wjet.2018.64051 790 World Journal of Engineering and Technology
Table 3. The frictinal energy distribution under wheel alignment conditions.
Condition Tire A Tire B Tire C Tire D
L1
L2
L3
Figure 10. Frictional energy distributions under wheel alignment conditions. (a) Tire A; (b) Tire B; (c) Tire C; (d) Tire D.
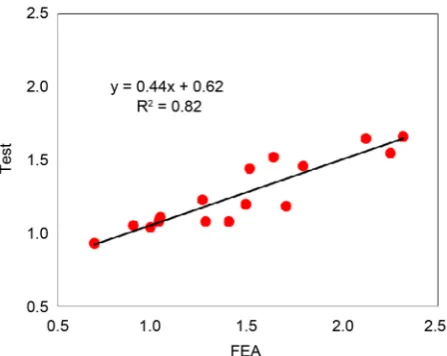
The correlation between simulation and test is shown in Figure 11. The hori-zontal axis is the predicted ratio of the frictional energy of inside or outside shoulder and center block, and the vertical axis is the test results. In the graph, the uniform wear condition (L1) is excluded because the ratio of the frictional energy is close to one. Therefore, we compared the results with the test using only the simulation results of L2 and L3 conditions. Figure 11 shows a high correlation coefficient between the predicted ratio of the friction energy and the measured that with an R2 of 0.82. It seems that the analysis method of this paper
DOI: 10.4236/wjet.2018.64051 791 World Journal of Engineering and Technology
Figure 11. A correlation between FEA and test.
5. Conclusion
A numerical method for predicting the uneven tire wear has been introduced in this paper to reduce the time and cost that are required for outdoor uneven wear test of a tire at the pattern design stage. The uneven tire wear through the tire footprint contacting with the proving ground is predicted by the frictional dy-namic simulation of a 3D patterned tire model. The camber and toe angle, which are actual vehicle conditions, are used to carry out simple straight running and the frictional energy generated in the tread pattern is calculated. The reliability of the prediction method was verified by comparing the test results with the fi-nite element analysis for the tires with four tread pattern shapes. Therefore, the uneven tire wear prediction simulations help improve the efficiency of tire de-velopment and help improve the performance of tires without outdoor test work. In the future, it is expected that abrasive wear amount can be presented considering the steering angle, cruising, acceleration, braking and turning of the vehicles.
Acknowledgements
The present study was supported by the Center for Environmentally Friendly Vehicles (CEFV) under the project “Development of the global top eco-friendly tire for reduction of tire wear particles and carbon dioxide” through the Ministry of Environment (ME, Republic of Korea).
Conflicts of Interest
The authors declare no conflicts of interest regarding the publication of this pa-per.
References
DOI: 10.4236/wjet.2018.64051 792 World Journal of Engineering and Technology [2] Veith, A.G. (1968) Tire Tread Wear—A Comprehensive Evaluation of the Factors:
Generic Type, Aspect Ratio, Tread Pattern, and Tread Composition. Tire Science and Technology, 14, 219-234.https://doi.org/10.2346/1.2148775
[3] Grosch, K.A. (1992) Abrasion of Rubber and Its Relation to Tire Wear. Rubber Chemistry and Technology, 65, 78-106.https://doi.org/10.5254/1.3538609
[4] Walters, M.H. (1993) Uneven Wear of Vehicle Tires. Tire Science and Technology, 21, 202-219. https://doi.org/10.2346/1.2139529
[5] Kim, S.J. and Savkoor, A.R. (1997) The Contact Problem of In-Plane Rolling of Tires on a Flat Road. Vehicle System Dynamics, 27, 189-206.
https://doi.org/10.1080/00423119708969654
[6] Gilbert, M.G. (2003) Effects of Tire Shoulder Wear on Vehicle Rollover Limit Test-ing. SAE, 401-406.
[7] Pauwelussen, J.P. (2004) The Local Contact Between Tyre and Road Under Steady State Combined Slip Conditions. Vehicle System Dynamics, 41, 1-26.
https://doi.org/10.1076/vesd.41.1.1.23406
[8] Park, K.S., Oh, C.W., Kim, T.W., Jeong, H.Y. and Kim, Y.H. (2006) An Improved Friction Model and Its Implications for the Slip, the Frictional Energy, and the Cornering Force and Moment of Tires. Journal of Mechanical Science and Tech-nology, 20, 1399-1409.https://doi.org/10.1007/BF02915963
[9] Cho, J.C. and Jung, B.C. (2007) Prediction of Tread Pattern Wear by an Explicit Fi-nite Element Model. Tire Science and Technology, 35, 276-299.
https://doi.org/10.2346/1.2804913
[10] Liu, F., Sutcliffe, P.F. and Graham, W.R. (2010) Prediction of Tread Block Forces for a Free-Rolling Tire in Contact with a Smooth Road. Wear, 269, 672-683. https://doi.org/10.1016/j.wear.2010.07.006
[11] Cho, J.R., Choi, J.H. and Kim, Y.S. (2011) Abrasive Wear Amount Estimate for 3D Patterned Tire Utilizing Frictional Dynamic Rolling Analysis. Tribology Interna-tional, 44, 850-858.https://doi.org/10.1016/j.triboint.2011.02.007
[12] Lee, D.W., Kim, J.K., Kim, S.R. and Lee, K.H. (2011) Shape Design of a Tire Con-tour Based on Approximation Model. Journal of Mechanical Science and Technol-ogy, 25, 149-155.https://doi.org/10.1007/s12206-010-1108-7
[13] Lupker, H., Cheli, F. and Braghin, F. (2004) Numerical Prediction of Car Tire Wear. Tire Science and Technology, 32, 164-186.https://doi.org/10.2346/1.2186780 [14] Gafvert, M. and Svendenius, J. (2005) A Novel Semi-Empirical Tyre Model for
Combined Slips. Vehicle System Dynamics, 43, 351-384. https://doi.org/10.1080/00423110412331282896
[15] Gipser, M. (2007) FTire—The Tire Simulation Model for All Applications Related to Vehicle Dynamics. Vehicle System Dynamics, 45, 139-151.
https://doi.org/10.1080/00423110801899960
[16] Braghin, F., Cheli, F. and Melzi, S. (2007) Tire Wear Model: Validation and Sensi-tivity Analysis. Meccanica, 41, 143-156.https://doi.org/10.1007/s11012-005-1058-9 [17] Sueoka, A. and Takahiro, R. (1997) Polygonal Wear of Automobile Tire. JSME, 40,
209-217.https://doi.org/10.1299/jsmec.40.209
[18] Sawant, P.J. and Joshi, S.G. (2005) Theoretical Analysis of Unstable Vibration of Tyre Mass-Suspension System with Cab of a Typical Road Vehicle. Journal of the Institution of Engineers (India), 86, 38-44.
DOI: 10.4236/wjet.2018.64051 793 World Journal of Engineering and Technology [20] Pottinger, M.G. and McIntyre, J.E. (1999) Effect of Suspension Alignment and
Modest Cornering on the Footprint Behavior of Performance Tires and Heavy Duty Radial Tires. Tire Science and Technology, 27, 128-160.
https://doi.org/10.2346/1.2135981
[21] Stalnaker, D.O. and Turner, J.L. (2002) Vehicle and Course Characterization Process for Indoor Tire Wear Simulation. Tire Science and Technology, 30, 100-121.https://doi.org/10.2346/1.2135248
[22] Kinsley, S. (2002) A Correlation between Rolling Tire Contact Friction Energy and Indoor Tread Wear. Tire Science and Technology. 30, 83-99.
https://doi.org/10.2346/1.2135251
[23] Tamada, R. and Shiraishi, M. (2017) Prediction of Uneven Tire Wear Using Wear Progress Simulation. Tire Science and Technology, 45, 87-100.
https://doi.org/10.2346/tire.17.450201
[24] https://fixautousa.com/blog/unbalanced-tires-can-affect-driver-safety/
[25] Cho, J.R., Shin, S.W. and Yoo, W.S. (2005) Crown Shape Optimization for Enhanc-ing Tire Wear Performance by ANN. Computers and Structures, 83, 920-933. https://doi.org/10.1016/j.compstruc.2004.11.011
[26] Clark, S.K. (1982) Mechanics of Pneumatic Tires. U.S. Department of Transporta-tion, National Highway Traffic Safety Administration.
[27] ABAQUS (2010) Analysis User’s Manual, Version 6.10. Dassault Systemes Simulia, Inc.
[28] Belyschko, T., Liu, W.K. and Moran, B. (2000) Nonlinear Finite Elements for Con-tinua and Structures. John Wiley & Sons, Hoboken.
[29] Cho, J.R., Choi, J.H., Yoo, W.S., Kim, G.J. and Woo, J.S. (2006) Estimation of Dry Road Braking Distance Considering Frictional Energy of Pattered Tire. Finite Ele-ment Analysis and Design, 42, 1248-1257.
https://doi.org/10.1016/j.finel.2006.06.005
[30] https://www.design911.co.uk/blog/index.php/2008/11/12/caster-camber-and-align
ment/
![Figure 1. The passenger car tires with the various uneven wear patterns [24].](https://thumb-us.123doks.com/thumbv2/123dok_us/9254601.414232/3.595.228.525.66.248/figure-passenger-car-tires-various-uneven-wear-patterns.webp)