ISSN Online: 2328-4897 ISSN Print: 2328-4889
DOI: 10.4236/jbcpr.2018.64020 Dec. 24, 2018 298 Journal of Building Construction and Planning Research
The Effectiveness of Different Methodologies in
Gathering Information for Developing BIM
Models to Support the Operation and
Maintenance of Existing Buildings
S. O. Álvarez-Romero, J. A. González-Fajardo, J. N. Zaragoza-Grifé, S. A. Audeves-Pérez
School of Engineering, Autonomous University of Yucatan, Mérida, México
Abstract
Systematic, preventive and corrective maintenance is essential for existing buildings in order to retain their original functionality and appearance and satisfy the needs of the users. Essential input for maintenance is information about buildings. This paper discusses the assessment of the advantages and limitations of using photogrammetry and a low-cost 3D scanner to collect information from existing buildings and create, through integrative software, BIM models as information systems to support the operation and mainten-ance functions. Also, these methodologies were compared with one another as well as with a manual information survey conducted at a university cam-pus. The main conclusion is that a combination of methods must be used to obtain geometrical information on existing buildings for their operation and maintenance functions, depending on which ones are the most suitable for the case at hand.
Keywords
Photogrammetric Surveying, 3D Scanner Surveying, BIM, Building Operation and Maintenance
1. Introduction
The built infrastructure life cycle can be visualized in five stages: planning, de-sign, construction, operation, and final disposal; the operation stage includes maintenance, and it is the longest stage and the one that contributes the most to the final building cost [1]. Maintaining a building extends its useful life, and is How to cite this paper: Álvarez-Romero,
S.O., González-Fajardo, J.A., Zaragoza-Grifé, J.N. and Audeves-Pérez, S.A. (2018) The Effectiveness of Different Methodologies in Gathering Information for Developing BIM Models to Support the Operation and Maintenance of Existing Buildings. Journal of Building Construction and Planning Research, 6, 298-316.
https://doi.org/10.4236/jbcpr.2018.64020
Received: November 9, 2018 Accepted: December 21, 2018 Published: December 24, 2018
Copyright © 2018 by authors and Scientific Research Publishing Inc. This work is licensed under the Creative Commons Attribution International License (CC BY 4.0).
DOI: 10.4236/jbcpr.2018.64020 299 Journal of Building Construction and Planning Research achieved by protecting and restoring its damaged items during their use or by exposure to environmental actions. Maintaining a building with adequate spaces to support the activities it hosts, directly impacts the productivity of such activi-ties [2]. All buildings are always exposed to damage and deterioration, and de-spite this, they must preserve the original appearance and satisfy the needs of the users [3]. However, despite the importance of maintenance, this is not done sys-tematically in developing countries, and there is a lack of foresight regarding their related costs [4]. Maintenance is, in most of the cases, of corrective type and very little is of preventive type.
Primary input for maintenance is information about buildings [5]. This in-formation includes drawings, specifications, warranties, operation manuals and the current state of the buildings and their systems. The facility manager gets this information from the builder in the information package that is commonly delivered to him along with the building. Afterward, it is the responsibility of operation and maintenance manager to keep this information organized, up-dated and available, but given the scarcity of resources, these are usually assigned to the direct costs of the operation and maintenance itself, and not to the infor-mation management.
In a paradox, having organized and updated information reduces operating costs since it makes the task easier to accomplish; at the same time, it reduces the waiting times for understanding the problem and obtaining the information needed for providing the maintenance [6].
1.1. Using Building Information Modeling (BIM) as a Support for
Operation and Maintenance Functions
People in charge of facilities management are continually facing the challenge of improving the quality and standardizing the information they have at their dis-posal, with the primary purpose of satisfying the daily needs of operation, while providing the owners with reliable information on the assets for their proper management [7]. BIM has positioned itself to offer a new level of functionality in the management of buildings and related assets, which is motivating companies to start adopting BIM to support the operation and maintenance process.
The above approach was mainly driven by the COBie project initiated in 2005 by The Facility Maintenance and Operations Committee of the National Insti-tute of Building Sciences. COBie standard (Construction-Operations Building Information Exchange) defines the assets information that is delivered as part of a construction project and is used to document all data for the BIM process. The COBie specifications and guidelines combine industry knowledge and best prac-tices. COBie pilot standard was released in 2007; in 2011 it was approved by the National Institute of Building Sciences (NIBS) as part of its National Building Information Model Standard (NBIS-US) standards model. COBie will be able to provide the structure in the short term to easily transfer information from BIM applications to building management systems [8].
support-DOI: 10.4236/jbcpr.2018.64020 300 Journal of Building Construction and Planning Research ing operation and maintenance of their infrastructure. A notable example is the case of the School of Medicine at the University of Massachusetts, where the Al-bert Sherman Center was recently completed. The facility is an eleven-story building, nine occupied and the last two containing mechanical systems; it is a 48,000 m2 building [9]. This project was developed with the vision of using BIM
beyond design and construction, incorporating it for facility planning, opera-tions and maintenance. In this case a model is integrated into the current facili-ties building management system, the model is a full spatial as-built; includes the design and actual capacity of the building systems; contains assets tagging; has the ability to isolate a system and; has a database for the non-graphical docu-mentation linked to the model. The model is managed through commercial software Autodesk Navisworks® and integrates eleven files of different models coordinated in a single visible file. This software is also used to query the build-ing model and retrieve information associated with buildbuild-ing components. This solution uses the SharePoint software as the container of non-graphic informa-tion (warranties, specificainforma-tions, and operainforma-tion and maintenance manuals) which is associated with the objects of the model; therefore, the retrieval of such infor-mation can be achieved by querying the coordinated model.
1.2. Developing BIM Models
This research focuses on the incorporation of BIM to support the operation and maintenance of buildings. BIM models should make the corrective and preven-tive maintenance easier, as well as keeping the building information organized, updated and available.
Authoring a BIM model of an existing building requires having real dimen-sions of elements. Traditionally, information about these dimendimen-sions is obtained through an architectural survey. This approach includes a set of operations, measurements, and analysis necessary to understand and document architectur-al assets of a building, referred to its urban context, dimensionarchitectur-al characteristics, historical complexity, structural and constructive characteristics, as well as to its form and function [10].
The architectural survey is usually performed with measuring tape and other measuring devices, but it is a costly task as it requires much time and effort. This task may be performed more easily if the layout and geometrical information of the building is extracted from a point cloud; nowadays, this point cloud can be acquired through 3D laser scanners or other available technologies [11]. A point cloud offers significant advantages since it constitutes a faithful representation of the building; the dimensions of the elements can be verified as required. In addi-tion, the point cloud can be imported into the BIM modeling environment and used as a reference to create a three-dimensional model.
arc-DOI: 10.4236/jbcpr.2018.64020 301 Journal of Building Construction and Planning Research hitectural survey. The techniques evaluated to create point clouds were photo-grammetry and the use of a low-cost 3D laser scanner. The manual architectural survey was used as a benchmark for accuracy comparison.
1.3. Using Photogrammetry
Photographs are essential for photogrammetric measurement. High reliability, precision, and automation of the photogrammetric process are directly proportional to the quality of the photographs used. Photogrammetry, in its broadest sense, re-verses the photographic process, transforming or mapping three-dimensional in-formation from a two-dimensional image [12]. However, because a portion of information is lost in the photographic process, it is not possible to reconstruct all the information using a single photograph. At least a couple of photographs of the same object are required; they must be taken from different angles and, even so, only is possible to retrieve information from the sections of the object appearing in more than one photograph. Additionally, the general process of photogrammetry is far from perfect in practice, partly because the premises of metrology are not always given, which assumes clear objects, with defined edges and contrasts and without reflections.
Photogrammetry uses the basic principle of triangulation, whereby the loca-tion of a point in its three-dimensional coordinates is calculated by finding the intersection of lines in space. However, to triangulate points using photographs, the position of the camera and the angle of its point of view must also be known. The re-sectioning technique is used to determine these parameters [12].
1.4. Using Low-Cost 3D Scanners
DOI: 10.4236/jbcpr.2018.64020 302 Journal of Building Construction and Planning Research spaces, such as mechanical rooms, was selected; tripod based scanners and two-person operated scanners where ruled out. Low-cost scanners cost 5 to 10 percent of the price of the industrial grade scanners.
2. Methodology
The proposed objective of this research was to evaluate the benefits and limita-tions of the use of photogrammetry and a low-cost 3D scanner, to gather infor-mation from existing buildings and to create a BIM model based on this data. These two methodologies were compared with each other, as well as with a tra-ditional surveying method.
2.1. Photogrammetry for Surveying of Existing Buildings
2.1.1. Evaluation of Photogrammetry EquipmentAs explained, photogrammetry has a photographic component and a metrologi-cal component. In this research, the photographic component is in the hands of the photographer, therefore, precision and quality may depend on the equip-ment used.
Metrology is performed by the software used to process the images, and al-though each software tool has different ways to perform triangulating or re-sectioning, most produce similar results. Photogrammetry software typically does not allow control over the triangulation and re-sectioning methods because these are part of the proprietary algorithm of the software vendor. This kind of software applications allows limited control over how the photographs are processed.
Given the complexity of taking a photograph to produce reliable results with adequate accuracy, three kinds of cameras were tested in this study.
•Digital SLR camera (DSRL) model Nikon D5300, with 23.5 mm × 15.6 mm
sensor, and 24 megapixels, with an AF-P DX Nikkor lens of 18 - 55 mm focal length and a maximum aperture of f/3.5 - 5.6 and minimum of f22 - 38 and sta-bilizer.
•The iPhone SE camera, with sensor of 4.8 mm × 3.6 mm, 12 megapixels,
equivalent focal length of 29 mm and fixed aperture of f/2.2.
•GoPro Hero4 Silver edition, 5.37 mm × 4.04 mm sensor, 8 megapixels, focal
length equivalent to 17.2 mm, and aperture of f 2.8.
Two computational applications were used in this investigation:
•Agisoft Photoscan, version 1.3, which is a software capable of exporting
point cloud files to standard formats, among which is the PTS format.
•Autodesk Recap 360, version 2017, which is software located in the cloud of
the design software developer Autodesk, which still produces the standard PTS point cloud file.
2.1.2. Recommended Techniques for Taking Pictures
DOI: 10.4236/jbcpr.2018.64020 303 Journal of Building Construction and Planning Research to determine suitable techniques for taking photographs that usually produce a usable point cloud.
For building exteriors, such as a facade, the process that produced the best results was when the camera position is perpendicular to the building surface as shown in Figure 1.
During the practice sessions of this research, the best results were obtained when there was an overlap of 50% or more between adjacent photographs. Also, better results were obtained by first taking a lower horizontal strip and then making the upper ones.
When allowed to photograph the entire building, a radial camera shot is rec-ommended, taking a photograph every 5˚ (at 10˚), always having the center of the building in the center of the photograph as shown in Figure 2.
Also, for this scenario, it is recommended to make a strip of horizontal photos until the entire perimeter is covered, overlapping photographs by 50%, then continue with the upper bands until completing the shot of the building.
Indoor photograph shots are the most complex to achieve, given that these places commonly contain obstacles. In general, it is recommended to follow the pattern shown in Figure 3.
[image:6.595.306.434.572.700.2]Whenever possible, in this technique, shots should be made by standing on one edge of the room and making the shot towards the opposite edge, aligned to an imaginary line that passes through the center of the room. It is advisable first to make the upper strip that includes the union of the walls with the ceiling, and then the lower strips up to the one that takes the union of the walls with the floor. Then the roof should be continued, taking concentric strips of the roof edge towards the center of the roof, and finally the floor, in the same approach as
Figure 1. Camera shots for a building facade [14].
DOI: 10.4236/jbcpr.2018.64020 304 Journal of Building Construction and Planning Research
Figure 3. Camera shots for building indoors [14].
the roof, as far as obstacles allow. On the floor there are often areas that cannot be taken radially; for these areas, it is recommended that they be photographed and processed independently and then join the two or more produced point clouds.
In regards to lighting, fixed artificial lighting was used for interiors; in most cases, the installed building lighting devices were used. Natural lighting was used for exteriors; the best results were obtained with cloudy conditions, while sunny conditions required more post-processing work.
Finally, it should be mentioned that reflecting objects such as glass or metal objects produce errors in the point cloud because the software does not detect the surface of these elements, but rather the reflected objects. Reflection causes “noise” to appear in the point cloud, instead of the object. To avoid noisy pho-tographs is advisable to cover this type of objects with paper.
2.1.3. Scaling for Developing BIM Models
To be able to use the point cloud, the scale of the point cloud should be adjusted. Nowadays, photogrammetry, through photographs taken with conventional photographic equipment, lacks the sophistication of a specialized photogram-metric camera that, through geo-positioning and measurement through infrared sensors, can determine the scale of objects. Without this functionality, the scal-ing must be done manually, by post-processscal-ing of the point cloud.
Most photogrammetric software supplements this feature by including physi-cal sphysi-cales in the scene, which are recognized by the software and help the sphysi-caling of the point cloud. However, in the case of large buildings, it is difficult to place these scales in the building in the proper way to determine the precise scale of the objects. While it is advisable to use scales, it is not always practical to do so. In this research an alternative method was tried, the point cloud was left without scale and once imported into the BIM modeling software, the point cloud was scaled using some known dimension of the building and applying a simple pro-portion rule; with this method, acceptable results were obtained.
DOI: 10.4236/jbcpr.2018.64020 305 Journal of Building Construction and Planning Research 2.1.4. Photogrammetric Method for Surveying Existing Buildings
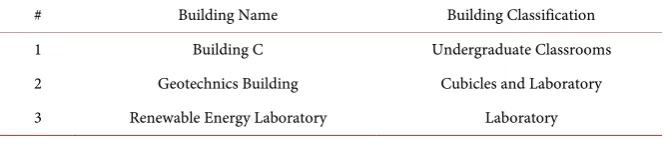
Teams of two people were formed, composed of students of Civil Engineering of the School of Engineering at the Autonomous University of Yucatan (UADY). The survey of three university buildings was carried out as mentioned in Table 1.
The workflow for this technique consisted of the following stages:
• Photo shooting.
• Photographs processing. • Point cloud calibration.
• BIM Model development.
Photographs were taken following the recommendations described in section 2.1.2. The building’s exterior was entirely photographed, but it was not possible to take all photo shots for indoor spaces. Therefore, the results are an extrapola-tion of collected data from the building spaces where it was indeed possible.
After several tests of the two mentioned software for photographs processing, it was decided to use the Agisoft Photoscan, because it offered significant addi-tional control over the processing; it allowed splitting the photoset into subsets and produce “chunks” of the building, which then can be joined; this reduced the processing time and increased the accuracy of the point cloud. A computer with a Xeon processor and Quadro 2000 video card and 16 GB of RAM was used.
Point cloud calibration was carried out in two stages; the first was noise and overlapped surfaces cleaning, using Autodesk Recap 360 software; the second was to import into Revit software, where point cloud was scaled with a reference dimension.
[image:8.595.207.540.654.727.2]Autodesk Revit software was used for model creation using the point cloud just as a reference; there was no attempt to create building components from the point cloud automatically. Instead, point cloud sections in plan views and sec-tion views were used to create the building elements, snapping to the recognized planes, edges, and vertices of the point cloud. Regardless this approach is a non-automated process in Revit, the use of the imported point cloud greatly fa-cilitates the creation of the model; the beginner level modelers, who created the BIM models, found no significant issues during the creation process. Floor plan views of the model were created to match the deliverable with the one that was elaborated with the manual method. However, by having a three-dimensional model and using Revit software, it was also possible obtaining building's pers-pectives and cuts.
Table 1. Surveyed buildings with the photogrammetric method (Source: Authors).
# Building Name Building Classification
1 Building C Undergraduate Classrooms
2 Geotechnics Building Cubicles and Laboratory
DOI: 10.4236/jbcpr.2018.64020 306 Journal of Building Construction and Planning Research
2.2. Use of Scanners for Surveying Existing Buildings
2.2.1. Evaluation of Scanners
At the time of the research, two devices were suitable regarding accuracy, entry price and point cloud production cost. The first one was a Faro Freestyle which is a scanner developed by Faro company, which is a world leader in the laser scanner market. The advantage is that it offers one of the best precision availa-ble, and its technology is proprietary, including the sensors. The disadvantage is that it requires a connected laptop or high-end Windows tablet (Microsoft Sur-face Tablet), which limits its operation and mobility, e.g., a single operator needs one hand to support the tablet and the other to support and operate the scanner. It uses two software applications, Faro Scene Capture, which should be installed in the tablet or laptop and it has limited support for processing, displaying and exporting scans [15]. Faro Scene Process is needed for cloud processing and re-viewing, and it should be installed in a high-end workstation.
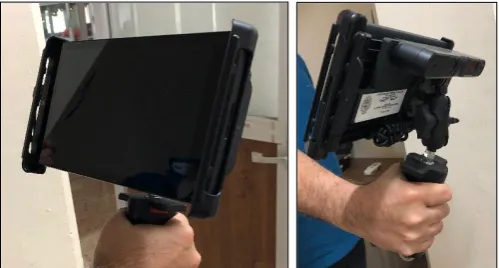
[image:9.595.248.498.571.705.2]The other device is a DPI-8 Kit, distributed by the company DotProduct3D. This device is composed of a structured light infrared sensor that connects to a high-performance tablet, which uses the camera to perform a color assignment for recorded points and stereoscopy and the gyroscope to detect the sensor movement. All this is processed in real time by the Phi.3D Software, developed by the company. Its advantage is the independence of a computer since the Tab-let is the source of power and viewfinder, which allows greater mobility. Another advantage is that the scanned model and point cloud can be processed and re-viewed on the Tablet, without the need for post-processing.
Figure 4 shows a DPI-8 scanner; this equipment was chosen for this research because it offered better mobility, an immediate process and review of the point cloud, and an affordable price.
2.2.2. Recommended Techniques for Using the Scanner
3D scanning with the tested device is like video recording. The scanner records what is on the screen and, by coloring the registered areas green and yellow, it is relatively easy and fast to scan the building elements. This device was only used to scan indoors of buildings due to the limitation of becoming “blind” in exte-riors because sunlight saturates the infrared sensors of the scanner.
DOI: 10.4236/jbcpr.2018.64020 307 Journal of Building Construction and Planning Research Despite being very easy scanning a space, during the team’s previous practices with the scanner, some problems were found. For example, in the case of smooth walls, the scanner loses scan tracking because there is no texture reference. When this happens, it must resume scanning from one of the nearby points successfully scanned.
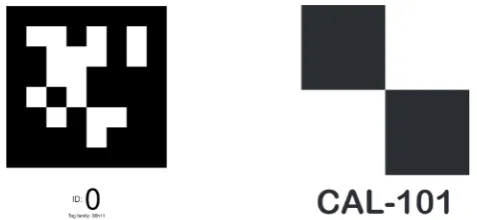
When closing the scanning space, sometimes the starting and ending points had a lag. However, this problem was easily solved by using the same label at the beginning and ending points of each scanning process. Labels are symbols that the device’s software recognizes and help to align different camera shots of the same space. These symbols are printed on letter-size sheets and pasted using ad-hesive tape on different places in the space to be scanned. They are extremely useful for adjusting the whole scanning process, to help keep track of the scan in smooth and untextured walls. Also, they are used to join scans of contiguous spaces. These tags are known as “April Tags”; Figure 5 shows an example.
In addition to the “April Tags”, there are other labels known as “Targets” that serve to improve scanning accuracy. They are placed in three locations of the space to be scanned, preferably aligned each one to a reference plane (X, Y, Z), and the distance of the centers of a label to the others is measured; this informa-tion is entered when scanning, and it serves to adjust scanning scale accuracy. According to the experience obtained through this study, it is concluded that it is highly recommended to use them.
The best approach for scanning according to the results of this research is to start the scan in an “April Tag” nearby junctions of ceiling or floor with walls because these unions are usually a good reference to avoid losing scan track. Then, at a steady scanning rate, follow the entire border until it finishes again in the starting “April Tag”. Generally, this process generated a scanned strip of good quality, which contained about 40% of what the scanned space contains; from there it was easy to fill the spaces that had not yet been scanned. This prac-tice always yielded the best and highest precision results.
2.2.3. Point Cloud Scaling Using the Manual Scanner
[image:10.595.254.493.584.694.2]Point cloud produced by the scanner does not require post-process to be used. It is advisable to clean redundant and excess of information. Afterward, it can be imported into a BIM model-authoring software.
DOI: 10.4236/jbcpr.2018.64020 308 Journal of Building Construction and Planning Research 2.2.4. 3D Scanner Methodology for Existing Buildings Surveying
For this stage, like the previous one, teams of two people were formed, consist-ing of undergraduate students who participated in the project. Surveys of same buildings were carried out as in the photogrammetric method.
Workflow for this technique consisted of the following stages:
• Building spaces scanning. • Point cloud calibration.
• Model development.
Scanning was performed following the recommendations described in section 2.2.2. The scanner was not used for the exterior of the building, because its infrared sensors become “blind” under sunlight; however, model developing was possible with the information of its interior. The scanner used was the DPI-8 of DotProduct 3D, described in Section 2.2.1.
Point cloud calibration and pruning were done with the Recap 360 software. This scanner produces point clouds at scale. In the same way, scanner aligns the scans of the different building spaces, and in few occasions, it was necessary to make small adjustments to the alignment; when necessary, this alignment was made with Revit.
Also, for model development, Revit was used using the point cloud as a refer-ence. The model floor plan views were created to match the deliverable with those obtained with the manual method. However, as in the photogrammetric method, having a three-dimensional model it was also possible to obtain build-ing perspectives and cuts.
2.3. Surveying of Building Information by Tape
and Distance Meter (Manual)
For this stage, a team of 4 to 5 students was formed for each of the studied buildings. Each team made the architectural survey of their assigned building, as well as the corresponding documentation, consisting of an architectural plan and elevation of the main facade. Students were trained on how to do it; in the train-ing, the procedures and use of necessary instruments were explained to them. These instruments were a measurement tape and distance meter.
The architectural survey was carried out in the following three stages.
2.3.1. Preparation phase
DOI: 10.4236/jbcpr.2018.64020 309 Journal of Building Construction and Planning Research observations.
2.3.2. Measurement Phase
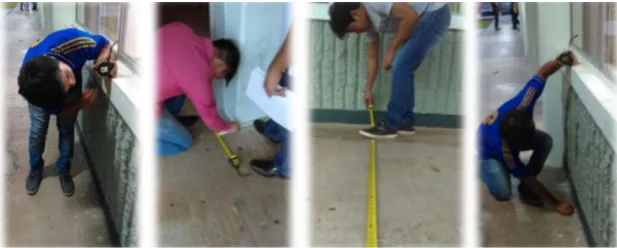
In this stage, teams were organized in such a way that a minimum of 3 people was required, one person to record the measurements and two others to operate the measuring tape, with the help of the mentioned instruments.
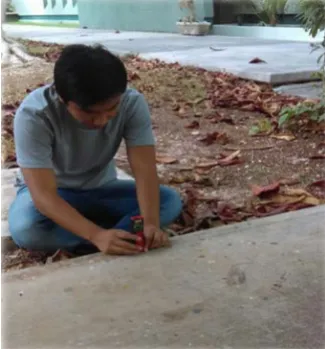
Dimensions were taken between axes, columns, walls, windows cubicles, and all the elements that made up each of buildings, as shown in Figure 7.
Laser distance meter was used to measure heights which is an electronic in-strument that calculates the distance from the device to the next point to which it points out (see Figure 8).
2.3.3. Documentation Phase
Documentation that was requested from the student work teams for each build-ing was a floor plan (see Figure 9) and a sketch for the main facade. For the preparation of the floor plans, obtained measurements in the field were consi-dered (height, width, and length of walls, columns, windows, doors, and acces-sories). The teams used AutoCAD for drawing these deliverables.
3. Results
This section presents the effectiveness of the two tested approaches and the ma-nual surveying method.
It is important to mention that the persons involved in the equipment and software operation for photogrammetry, 3D scanning, generation of the point
[image:12.595.212.536.431.540.2](a) (b)
Figure 6. Outdoors (a) and indoors (b) photos of the Renewable Energy Laboratory building (Source: Authors).
[image:12.595.218.527.583.707.2]DOI: 10.4236/jbcpr.2018.64020 310 Journal of Building Construction and Planning Research
Figure 8. Use of distance meter (Source: Authors).
Figure 9. Architectural floor plan (Source: Authors).
cloud, and development of the BIM model, were undergraduate students with no prior experience in such processes; they were trained for conducting these tasks. Students were also in charge of the manual architectural survey; they already had basic knowledge of surveying processes.
3.1. Photogrammetric Method
[image:13.595.61.539.278.563.2]applica-DOI: 10.4236/jbcpr.2018.64020 311 Journal of Building Construction and Planning Research tions, which can be summarized as follows:
• Regarding the cameras, with all the good results that were obtained, they were
even tested with other mobile phones cameras obtaining similar results. When space is restricted, GoPro camera is an excellent choice; if space allows a DSLR or a mobile phone with a good resolution, it produces satisfactory results.
• Regarding the software, if GoPro is used, better results are obtained using
Autodesk Recap 360 because it natively supports this camera. The Autodesk Recap 360 resulting point cloud is always usable in comparison with Agisoft PhotoScan, which produces not usable point clouds in most cases. If another type of camera is used, then Agisoft PhotoScan is more efficient in the pro-duction of a usable point cloud.
The Efficiency of the Photogrammetric Method
For accuracy assessment, the error is defined as the average of the absolute dif-ference of the point cloud and the manually measured dimensions divided by the manually measured dimension. This work considers the manual architectur-al survey as the most accurate of the three methods. The best scanned precision was achieved when using DSLR cameras. For outdoors dimensions, the calcu-lated error was of 0.8% for buildings with dimensions up to 22 m in their greater length. For indoors measurements, the resulting error was of 1.3% in dimensions for rooms up to 6 m in its longest dimension. Regarding work team productivity, obtained results are listed in Table 2. Figure 10 shows the result of a cloud of points in Renewable Energy Laboratory building.
The average productivity of photographing, processing and calibration phase was 81.84 m2/h, with a standard deviation of 16.92.
The average productivity of developing model phase was 259.03 m2/h, with a
standard deviation of 34.21.
3.2. Scanner Method
[image:14.595.57.539.577.726.2]One of the advantages of the DPI-8 device is that it is capable of scanning chromed metal objects with high reflectivity, a feature that was not possible with photogrammetry.
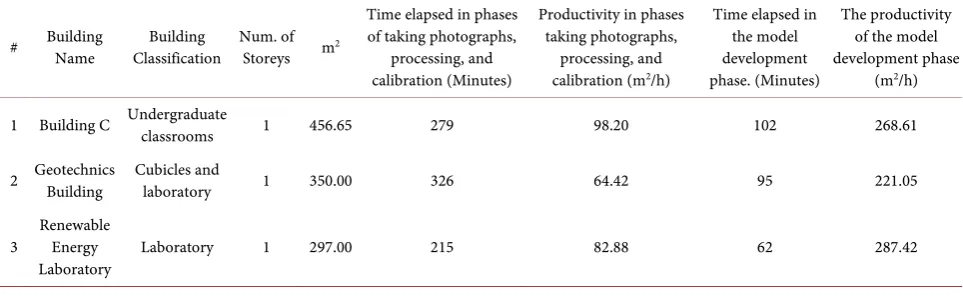
Table 2. Elapsed times and productivity of the survey using the photogrammetric method (Source: Authors).
# Building Name Classification Building Num. of Storeys m2
Time elapsed in phases of taking photographs,
processing, and calibration (Minutes)
Productivity in phases taking photographs,
processing, and calibration (m2/h)
Time elapsed in the model development phase. (Minutes)
The productivity of the model development phase
(m2/h)
1 Building C Undergraduate classrooms 1 456.65 279 98.20 102 268.61
2 Geotechnics Building Cubicles and laboratory 1 350.00 326 64.42 95 221.05
3 Renewable Energy
DOI: 10.4236/jbcpr.2018.64020 312 Journal of Building Construction and Planning Research 3.2.1. Efficiency of Scanner Method
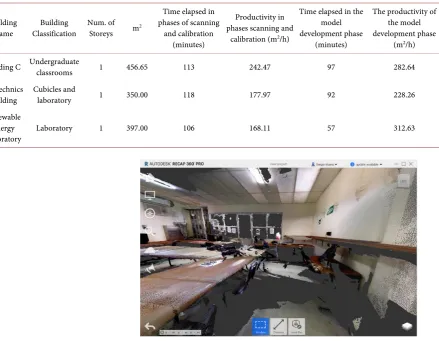
[image:15.595.230.515.139.300.2]The scanner method was used in rooms with dimensions up to 6 m. The point cloud precision ranged between 0.3% and 0.6% of error. Table 3 shows the work team productivity results. Figure 11 shows a point cloud produced with the
[image:15.595.94.534.357.698.2]Figure 10. Point cloud of Renewable Energy Laboratory building from photographs with a mobile phone camera (Source: Authors).
Table 3. Elapsed times and productivity of the survey using the scanner method (Source: Authors).
# Building Name Classification Building Num. of Storeys m2
Time elapsed in phases of scanning
and calibration (minutes)
Productivity in phases scanning and
calibration (m2/h)
Time elapsed in the model development phase
(minutes)
The productivity of the model development phase
(m2/h)
1 Building C Undergraduate classrooms 1 456.65 113 242.47 97 282.64
2 Geotechnics Building Cubicles and laboratory 1 350.00 118 177.97 92 228.26
3 Renewable Energy
Laboratory Laboratory 1 397.00 106 168.11 57 312.63
DOI: 10.4236/jbcpr.2018.64020 313 Journal of Building Construction and Planning Research scanner, inside the Renewable Energy Laboratory building.
The average productivity of scanning and calibration phase was 196.18 m2/h,
with a standard deviation of 40.39.
The average productivity of developing model phase was 274.45 m2/h, with a
standard deviation of 42.75.
[image:16.595.56.539.474.606.2]3.2.2. The Method with Tape and Distance Meter
Table 4 shows productivity with the manual method.
The average productivity of preparation and measurement phase was 138.61 m2/h, with a standard deviation of 76.58. The average productivity of the
docu-mentation phase was 76.91 m2/h, with a standard deviation of 42.33. The
aver-ages and standard deviations mentioned include data from other buildings that it was also possible to record for the manual survey method.
[image:16.595.55.539.637.725.2]4. Discussion
Table 5 presents a comparison of elapsed times of the three methods, taking the first phase as obtaining dimensions, and second as the creation of deliverables of the process. Although for each method they are identified with different names, they are equivalent.
According to Table 5, the most productive method for obtaining the informa-tion necessary to create the deliverable is Manual 3D scanner and the least pro-ductive is photogrammetry; on the other hand, the most propro-ductive method to generate the deliverable is using the 3D scanner and the least productive is the manual method.
However, results are presented using a method for the whole building, even
Table 4. Elapsed times and productivity of survey using tape and distance meter (Source: Authors) photogrammetry.
# Building Name Classification Building Num. of Storeys m2 preparation and Time elapsed in measurement phases
The productivity of preparation and measurement phase (m2/h)
Time elapsed in the documentati
on phase
Documentati on phase productivity
(m2/h)
1 Building C Undergraduate classrooms 1 456.65 3 h 152.22 5 h 30 m 76.28
2 Geotechnics Building Cubicles and laboratory 1 350.00 5 h 15 m 66.67 --- ---
3 Renewable Energy Laboratory Laboratory 1 297.00 3 h 20 m 83.10 4 h 74.25
Table 5. Results comparison between the three methods (Source: Authors).
Method The productivity of The productivity of obtaining information phase (m2/h)
Standard deviation information acquisition
phase
The average productivity of deliverable creation phase
(m2/h)
The standard deviation of deliverable creation
phase
Photogrammetry 81.84 34.21 259.03 34.21
Manual 3D Scanner 196.18 40.39 274.45 42.75
DOI: 10.4236/jbcpr.2018.64020 314 Journal of Building Construction and Planning Research knowing that in some situations are unfavorable for one method or another. For example, in the case of using the manual scanner it was not possible to scan the building exterior; as the emphasis of these surveys was on the architectural ele-ments, it was possible to develop a BIM model without having specific informa-tion from the building exterior. However, for maintenance, it is necessary to have facilities information; in this case, it will be necessary to complement the information using another method to obtain data from the building exterior.
An important aspect to mention is that in case of rooms and cubicles, where conditions were very unfavorable for photogrammetry method due to a large amount of glass and walls with little texture, the most convenient method was the manual one.
The scanner method presented the most efficient results. However, there are some cases, like the one described above, where the manual method had better results than the scanner method. Where scanner represents, by far the best op-tion is in case of mechanical rooms or laboratories, where space is limited, and some elements that are required to be included in the model for maintenance are so large, that the manual method is extremely complex and takes much time.
Photogrammetry was the most unfavorable method for obtaining building information due to the processing time of photographs, which represents 63% of the elapsed time. However, its advantages are evident when it comes to survey-ing buildsurvey-ing exteriors, especially those of considerable height; in these cases, the method offers easy access and greater safety. Also, in case of not having a 3D scanner for surveying mechanical rooms or cubicles having a lot of equipment, installations or furniture, photogrammetry offers more efficiency than the ma-nual method.
The manual method is the most unfavorable when developing and processing the model deliverables. The main reason is that, when developing the model, it is very usual to find out that there are inconsistencies or lack of information and it is necessary to pay a visit back to the building to corroborate the missing infor-mation.
5. Conclusions
In this research, three different approaches for gathering geometric and layout information of existing buildings for operation and maintenance purposes were assessed: photogrammetry, 3D scanning, and manual architectural survey. Each approach presented advantages and limitations, some of them showed higher ef-ficiency while others showed technological limitations than inhibited its use, depending on the context.
These conclusions are based on the equipment and software tools used in this research. For different equipment and software tools, the results may vary de-pending on their characteristics.
DOI: 10.4236/jbcpr.2018.64020 315 Journal of Building Construction and Planning Research
• For outdoors, the recommended option from the quantitative (productivity)
and qualitative (quantity, flexibility, and clarity of information) point of view, photogrammetry is the best method to use. Actually, the 3D scanner does not work in exteriors under direct sunlight, because of its infrared sensors.
• For indoors with simple geometries and few installations that need to be
rec-orded, the most efficient and suitable method is the manual architectural survey.
• For indoor spaces used as mechanical rooms or places with many
installa-tions, equipment, or obstacles, the 3D scanner is the best option, in regard to the overall performance. If there is no access to a 3D scanner due to financial limitations, photogrammetry is the second-best option; even though the manual method has the best accuracy, it has significant lower productivity and limitations in crowded spaces as the mechanical rooms.
Acknowledgements
This research was granted by the Programa para el Desarrollo Profesional Do-cente (PRODEP), Ministry of Education-Mexico.
We thank the students (from the undergraduate program of Civil Engineer-ing-School of Engineering at UADY) for their support in this research.
Conflicts of Interest
The authors declare no conflicts of interest regarding the publication of this pa-per.
References
[1] Fuller, S. (2010) Life-Cycle Cost Analysis (LCAA). National Institute of Building Sciences. http://www.wbdg.org/resources/lcca.php
[2] Wiggins, J.M. (2010) Facilities Manager’s Desk Reference. Wiley-Blackwell, USA.
https://doi.org/10.1002/9781444320466
[3] Quintero, M., Solano, C. and Pandales, C. (2013) La Degradación y el Manteni-miento en las Obras de Edificación: Estudio de Caso Institución Educativa Antonio Derka Santo Domingo. Tesis Inedita, Universidad de Medellin, Colombia.
[4] Amarilla, B. (1989) Los Costos de Mantenimiento de Edificios en Países en Vías de Desarrollo. Informes de la Construcción, Vol. 41 n.˚ 404, noviembre/diciembre. [5] Goedert, J.D. and Meadati, P. (2008) Integrating Construction Process
Documenta-tion into Building InformaDocumenta-tion Modeling. Journal of ConstrucDocumenta-tion Engineering and Management, 134, 509-516.
https://doi.org/10.1061/(ASCE)0733-9364(2008)134:7(509)
[6] Sullivan, G.P., Pugh, R., Melendez, A.P. and Hunt, W.D. (2010) Operations & Maintenance.
[7] Teicholz, P. (2013) BIM for Facility Managers. John Wiley & Sons, Inc., Hoboken, New Jersey.
[8] East, E.W. (2007) Construction Operations Building Information Exchange (COBIE): Requirements Definition and Pilot Implementation Standard.
DOI: 10.4236/jbcpr.2018.64020 316 Journal of Building Construction and Planning Research [9] Baker, J., et al. (2013) UMass Medical School (UMMS). Conference Presentation in the Event Building Information Modeling (BIM): From Concept to Substantial Completion (and Beyond). Worcester, MA, 17 January 2013, 3.
[10] Almagro, A. (2004) Levantamiento Arquitectónico, Granada University. [11] Autodesk Knowledge Network.
https://knowledge.autodesk.com/es/support/autocad/learn-explore/caas/CloudHelp /cloudhelp/2017/ESP/AutoCAD-Core/files/GUID-C0C610D0-9784-4E87-A857-F17
F1F7FEEBE-htm.html
[12] Luhman, T., Robson, S., Kyle, S. and Boehm, J. (2011) Close-Range Photogramme-try and 3D Imaging. Revised Edition, De Gruyter, USA.
[13] DotProduct3D (2015) Electronic Publication.
https://www.dotproduct3d.com/dpi8x.html
[14] Agisoft (2016) Agisoft PhotoScan User Manual, Standard Edition Version 1.3, Agi-soft LCC.
![Figure 1. Camera shots for a building facade [14].](https://thumb-us.123doks.com/thumbv2/123dok_us/9237643.411132/6.595.306.434.572.700/figure-camera-shots-for-building-facade.webp)
![Figure 3. Camera shots for building indoors [14].](https://thumb-us.123doks.com/thumbv2/123dok_us/9237643.411132/7.595.276.472.70.202/figure-camera-shots-building-indoors.webp)