Effects of Curing Conditions and Formulations on
Residual Monomer Contents and Temperature
Increase of a Model UV Gel Nail Formulation
Kentaro Taki, Tomomi Nakamura
Department of Chemical Engineering, Kyoto University, Kyoto, Japan. E-mail: [email protected]
Received August 30th, 2011; revised October 5th, 2011; accepted October 16th, 2011.
ABSTRACT
Recently, the application of ultraviolet (UV) curable monomers to human nails,(also known as UV gel nails) has be-come a popular decoration technique for women’s nails. However, the unreacted layer, the depletion of residual monomers from the cured UV gel nails, which can cause allergy and asthma, and the increase in temperature during curing process, are major concerns. In this study, the thickness of the unreacted layer, the increase in temperature, and the residual contents in cured film of UV gel nail treatment were measured for the first time. The results of this study indicated that the thickness of unreacted layer was not affected by the cast thickness; however, the intensity of UV light and the photoinitiator concentration had significant effect on the thickness of the unreacted layer. To reduce the thick-ness of the unreacted layer, the intensity of the UV light and the photoinitiator concentration should be increased. However, the maximum temperature observed during the curing of UV gel nails increases with an increase in the inten-sity of the UV light and the photoinitiator concentration. A suitable cast thickness range (21 - 150μm), which resulted in the formation of a cured film and without producing temperatures that exceed that of the human body, was identified. The mass fraction of the residuals in the cured layer decreased with an increase in the exposure time, the UV intensity,
and the photoinitiator concentration.
Keywords: Diffusion, Films, Heat Transfer, Polymers, UV Cure, Gel Nail, Artificial Nail
1. Introduction
Recently, ultraviolet (UV) curable monomers (also known as UV gel nails) have become a popular decora-tion technique for women’s nails. Curing (polymerizing) UV gel nails results in the formation of a harder, glossier, more attractive, and durable solid polymer layer than conventional manicures. Although the UV gel nail mar-ket is flourishing and has expanded rapidly, safety guide-lines on UV gel nail treatment have not yet been estab-lished. Clinical studies on UV gel nails have revealed that technicians at nail salons are at risk of developing allergies [1-3] and asthma [4,5] due to UV gel nails. Some UV-curable monomers may cause human skin al-lergies and asthma in respiratory organs. Most clinical studies have focused on the relationship between the monomer and the human body although dental composite resin, which is applied using photopolymerization, has also been studied to determine the residuals of the cured
composites [6-10]. The quantity of monomers remaining in the cured UV gel nails has not been determined yet. To determine the risk the monomers pose to UV gel nail technicians and salon customers, the amount of residuals (monomer, photoinitiator and stabilizer) that leak from cured UV gel nails must be evaluated. Currently, UV gel nail kits are sold in commodity stores. People who are not knowledgeable of the risk that monomers and UV light pose can buy the kit and apply the nails by them-selves, which increases the severity of the situation.
The UV gel nail treatment procedure can be divided into several steps: 1) filing the human nail; 2) applying the UV gel nail onto the human nail; 3) exposing the UV gel nail to UV light to polymerize the UV curable mo- nomers; and 4) wiping the unreacted monomers from the cured UV gel nail with a tissue.
(nitrogen or carbon dioxide) atmospheres [11]. However, for UV gel nails, the intensity of UV light should be lower (approximately 3 - 10 mW/cm2), than that used for
the industrial processes to avoid unexpected heating. Moreover, inert atmospheres, which can cause asphyxia, cannot be used in UV gel nail salons. Thus, most UV gel nails are cured in air. When a UV-curable monomer is cured in air in the presence of low-intensity UV light, the UV-curable monomers do not achieve 100% conversion (molecular base) due to oxygen-induced inhibition of polymerization. Thus, an unreacted layer forms on the surface of the cured film and residual monomers exist in the cured film, which must be removed by wiping the surface with a tissue that has been moistened with etha-nol. Residual monomers can travel from the cured resin and may cause problems in the human body as has been indicated by clinical studies.
In addition to the residual monomer contents, tem-peratures observed during the UV curing of monomers should be maintained within the range of human body temperature. UV gel nails use radical polymerizations, which are exothermic chemical reactions. The UV curing reaction is rapid enough (one minute) that heat does not dissipate from the nail, which increases the temperature of the human nail. A rapid temperature increase may occur when the intensity of UV light is too high or the gel nail is too thick. Although the temperature is not a crucial parameter for industrial processes, temperature changes during polymerization should be considered for human nails.
In the present study, the thickness of the unreacted layer, the temperature increase, and the residual content of a model UV gel nail formulation were measured. The thickness of the unreacted layer and the residual contents were quantitatively determined using the gravimetric method and chromatography. The temperature profile and the maximum temperature of the UV curing process were recorded under UV exposure of the UV gel nail. Finally, practical ranges of cast thickness for the UV gel nail, UV light intensities, and exposure times were iden-tified.
2. Materials and Methods
2.1. Materials
Diurethane dimethacrylate (436909, 225 ppm ± 25 ppm topanol as inhibitor, Aldrich, St. Louis, MO), 1-hy- droxycyclohexyl phenyl ketone (Irgacure 184, BASF, Ludwigshafen, Germany), and diethyl amine (Wako Pure Chemical Industries, Osaka, Japan) were used as the UV curable monomer, the photoinitiator and the stabilizer, respectively. Diurethane dimethacrylate is a popular
ma-terial for UV gel nails and can be used alone or as a mixture with reactive diluents. The monomer, photoini-tiator, and stabilizer were mixed in a 50 ml light-shielded polypropylene bottle with a mechanical agitator for 30 min at room temperature and were stored at 40˚C over-night. Sample solutions containing 1% or 5% of the photoinitiator were prepared, and 0.2% of diethylamine was added to the solutions. The photoinitiator was com-pletely dissolved in the monomer.
2.2. UV Curing and Extraction
Using a frame applicator (Imoto Machinery, Kyoto, Ja-pan) operated at 30 cm/min, the sample solution was applied to a polyester substrate (100 μm in thick, OHP- 10CN, OHP sheet, Tochiman, Japan), which was used as an alternative to human nails. The cast film was cut into 3 cm 3 cm pieces and was weighed using an electronic balance (minimum readout = 0.01 mg, Shimadzu, Kyoto, Japan). Without the polyester substrate, the typical mass of a cast film with a thickness of 100 m was approxi-mately 100 mg. The cast thickness of the sample, L0, was
calculated according to the following equation:
0 0
m L
A
(1) where m0 is the mass of the cast sample without the
polyester substrate, ρ is the density of the sample solution and A is the cast area. The density of the sample solution (1.1 g/cm3) was obtained from the supplier of the
mono-mer.
Figure 1 shows a schematic diagram of the simulta-neous UV exposure and temperature monitoring appara-tus. The cast film was placed on a stage, and UV light was guided from a high pressure 200 Watt Mercury Va-por Short Arc lump (OmniCure S2000, ExFo, Quebec, Canada) to the sample stage.
The typical 4 cm distance between the cast film and the UV light could be adjusted to change the intensity of the UV light. The intensity of the UV light at the center of the film was set to the maximum and was attenuated concentrically. The cast film was exposed to UV light in an atmosphere of air at the desired intensity, 3 mW/cm2.
Prior to UV exposure, the intensity of the UV light at the center of the film was monitored using a UV meter (Ushio Unimeter UIT-150, Ushio, Japan) and was ad-justed to achieve a desired intensity. The intensity of the UV light and the exposure time of the typical curing conditions, which was measured with a commercial UV gel nail lamp, were 3 mW/cm2 and 60 s, respectively.
Polyester substrate Cast thickness, L0 Unreacted layer, Lu
Cured film
Thermocouple
UV light
[image:3.595.58.288.97.251.2]Residuals Sample stage
Figure 1. Schematic diagram of the simultaneous UV expo-sure and temperature monitoring apparatus. The sample solution was cast on a polyester substrate on a sample stage, and the solution was exposed to UV light. A cured film, an unreacted layer and some residual monomer were formed. The temperature increase was monitored using a thermo-couple. The figure is not drawn to scale.
times at each condition to assess the reproducibility. After UV exposure, a tacky unreacted layer usually formed on the cured film. The unreacted layer was re-moved by wiping with tissue (KimWipes, Kimberly- Clark, USA) that had been moistened with ethanol (pu-rity = 99%, Wako Pure Chemicals Industries, Osaka, Japan) to remove unreacted monomers on the surface of the cured film. The wiping was performed by hand and was repeated at least three times. After wiping, films were no longer tacky.
This procedure is commonly performed in UV gel nail salons. We used this procedure to determine the amount of residual monomer in the cured layer that could not be removed by wiping. The thickness of the unreacted layer,
Lu, was calculated according to the following equation:
0 w
u
m m
L
A
(2)
where mw is the mass of the wiped film.
The wiped film was placed in a beaker filled with 20 ml of ethanol and was sonicated for 30 minutes at room temperature to extract the residual monomers, the pho- toinitiator and the stabilizer from the cured film. Subse-quently, the film was dried in an oven at 90˚C for 1 hour and was cooled to room temperature. The mass fraction of the extracted residuals, fe, was calculated according to
the following equation:
w e
e w
m m
f m
(3)
where me is the mass of extracted film.
2.3. GPC Analysis
Gel permeation chromatography (GPC) was used to de-termine the amount of monomer in the post-sonication ethanol solution. In total, 10 μL of the extracted solution containing the extracted residuals was injected into a GPC. A series of Shodex K806L and K-800D (Showa Denko, Tokyo, Japan) columns were heated to 40˚C. High-pressure liquid chromatography-grade chloroform (Wako Pure Chemicals Industries, Osaka, Japan) was used as the eluent, and a UV-Vis spectrometer (254 nm, Shimadzu, Kyoto, Japan) was used as the detector.
2.4. Temperature Increase
To evaluate the temperature increase during the UV cur-ing process, a K-type thermocouple (0.5 mm in diameter) was placed below the polyester film as shown in Figure 1. The heat of photopolymerization during the UV curing reaction caused the temperature of the sample to increase and caused the heat to conduct through the polyester film. The temperature of the film was recorded every 0.167 s.
3. Results and Discussion
3.1. Temperature Increase
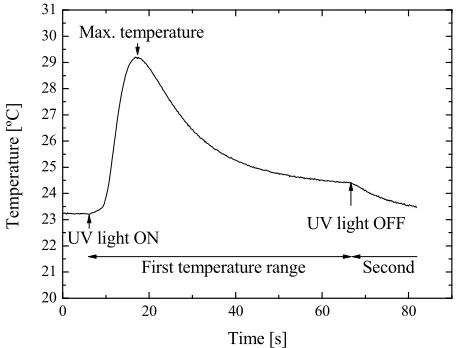
Figure 2 shows the temperature profile of the UV curing reaction. The photoinitiator concentration, the light in-tensity, the film thickness and the curing time were 1%, 3 mW/cm2, 100 μm and 60 s, respectively. When UV light
was applied to the film, the temperature increased dra-matically from 23.2˚C to 29.2˚C.
After the maximum temperature was observed, the temperature decreased over time. When the UV light was turned off, the temperature continued to decreases and approached room temperature asymptotically. Two tem-perature ranges were observed during the UV-curing reaction. The first temperature range was associated with the heat of photopolymerization and the absorbance of UV light by the sample. The second temperature range was attributed to the heat of polymerization. Using the maximum temperature, a temperature index of the profile was obtained and was employed thereafter.
3.2. GPC Analysis
To determine the amount of residuals in the cured film, the wiped film was sonicated in ethanol. Residuals were extracted into ethanol, and the solution was injected onto the GPC column to analyze the residual monomer con-tents.
0 20 40 60 80 20
21 22 23 24 25 26 27 28 29 30 31
Second
T
emp
er
at
ur
e [º
C]
Time [s] UV light ON
Max. temperature
UV light OFF
[image:4.595.58.287.97.271.2]First temperature range
Figure 2. Temperature profile of the UV curing reaction. Intensity of the UV light, thickness of the cast film and ex-posure time were 3 mW/cm2, 100 μm and 60 s, respectively. The maximum temperature was achieved after UV light was on and then the temperature gradually decreased over time. The temperature decrease became more rapid after the UV light was turned off.
Figure 3. GPC profile of the monomer and the extracted solution from the cured sample. The “Diurethane di-methacrylate” curve was obtained by dissolving the diure-thane diacrylate monomer in ethanol. The “Extracted solu-tion after UV curing” was prepared by sonificating the wiped film in ethanol.
extracted solution was observed at 12.4 min and was attributed to the monomer; thus, unreacted monomer existed in the cured film and was not removed by wiping the surface of the film by hand. This result implies that the UV gel nails contained some amount of residuals in the cured gel nail after treatment.
The photopolymerization rate depends on the diffusiv-ity of the monomer, which decreases with an increase in
the degree of polymerization. When the rate of monomer diffusion is slow, the monomer cannot react with the radicals [12]. Therefore, the degree of photopolymeriza-tion does not reach 100% and the residual monomers were obtained. Based on the height of the peak at 12.4 min and the calibration curve, the mass fraction of mono-mer in the cured film was 90%.
The right-most peak was attributed to a mixture of the photoinitiator and the stabilizer, which absorbs light at 254 nm.
3.3. Effect of the Cast Thickness
To determine a suitable cast thickness for the following investigations, the effect of the cast thickness on the thickness of the unreacted layer and the maximum tem- perature was investigated.
Figure 4 shows the effect of the cast thickness, L0, on
the thickness of unreacted layer, Lu. The photoinitiator
concentration and the UV light intensity were set to 1% and 3 mW/cm2, respectively. When the cast thicknesses
[image:4.595.58.286.361.543.2]was equal to 50 μm or 200 μm, the thickness of the un-reacted layer was 21 and 22 μm, respectively. The coef-ficient of variance (CV) of the thickness of the unreacted layer was 3%, which was comparable to the repeated error. The results indicated that the cast thickness did not affect the thickness of the unreacted layer. Based on the thickness of unreacted layer, the monomers cannot be cured when the cast thickness is less than 21 μm. The formation of an unreacted layer was observed because oxygen in the air diffused to the cast film and inhibited the polymerization reaction by reacting with radicals [13-15].
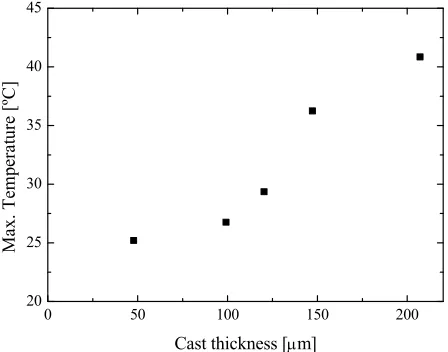
Figure 5 shows the effect of the cast thickness on the maximum temperatures. The formulation and curing conditions were identical to those shown in Figure 4. When the cast thickness was set to 50 μm, the maximum temperature was 25.2˚C, which is close to room tem-perature. Alternatively, when the cast thickness was 200
μm, the maximum temperature was 40.9˚C, which is warmer than the human body temperature. The maxi-mum temperature of the cast film with a thickness of 150
μm was less than body normal temperature.
Based on the findings of the present study, when the cast thickness is 100 μm the thickness of the unreacted layer is 21 μm, and the maximum temperature is 26.8˚C. A cast thickness of 100 μm is a suitable cast thickness that allows the monomers to be cured without exceeding the human body temperature. Thus, based on this inves-tigation, a cast thickness of 100 μm was employed.
3.4. Effect of Exposure Time
Figure 4. Effect of the cast thickness of the sample on the thickness of the unreacted layer. The photoinitiator con-centration was 1%. Exposure time was 60 s.
0 50 100 150 200
20 25 30 35 40 45
Ma
x. Tem
pera
ture
[º
C]
Cast thickness [m]
Figure 5. Effect of the cast thickness on the maximum tem-peratures. The photoinitiator concentration was 1%. The exposure time was 60 s.
thickness of the unreacted layer. As shown in the figure, at 40 s, the thickness of the unreacted layer was 25 μm. As the exposure time increased to 180 s, the thickness of the unreacted layer gradually decreased to 18 μm. At exposure times between 180 s and 500 s, the thickness of the unreacted layer did not change within the deviation of the measurement. These results indicate that the thick-ness of the unreacted layer can be reduced to certain val-ues by increasing the exposure time. The size of the un-reacted layer is determined by the rate of oxygen diffu-sion and the radical generation, which are competitive phenomena. Oxygen diffusion is not affected by the ex-posure time, while the radical content is proportional to the exposure time [13-15]. An unreacted layer thickness
0 100 200 300 400 500 0
5 10 15 20 25 30
Thickness of unrea
cted
la
yer,
L u
[
m]
[image:5.595.308.537.98.270.2]Exposure time [s]
Figure 6. Effect of curing time on the thickness of the unre-acted monomer layer. The UV light intensity was 3 mW/cm2. The photoinitiator concentration was 1%. The cast thick-ness was 100 μm.
of 18 μm can be attained by balancing the rates of radical generation and oxygen diffusion.
Figure 7 shows the effect of the exposure time on the mass fraction of the residuals. The mass fraction was 32.2% after 40 s of exposure and decreased gradually with an increase in the exposure time. The mass fraction was equal to 7.7% and 5.7% at curing times of 400 s and 500 s, respectively. Unlike the thickness of the unreacted layer, the mass fraction did not converge to a specific value. The rate of the diffusion of radicals and monomers decreased with an increase in conversion, which reduces the reaction rate. Thus, the photopolymerization reaction became slow but continued at 500 s.
3.5. Effect of UV Intensity
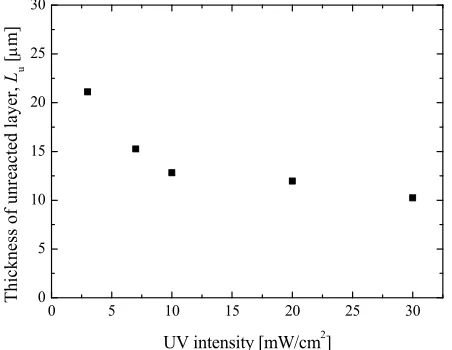
Figure 8 shows the effect of the UV intensity on the thickness of the unreacted layer. The photoinitiator con-centration was set to 1%. The thickness of the unreacted layer was equal to 21 μm when the intensity of UV light was 3 mW/cm2, which is the typical intensity of a
com-mercial light. The thickness of the unreacted layer de-creased with an increase in the intensity of the UV light.
Figure 9 shows the mass fraction of residuals in the wiped film. At an intensity of 3 mW/cm2, 18% of the
residuals were extracted from the film. The mass fraction of the residuals decreased with an increase in the inten-sity of UV light. At an inteninten-sity of 30 mW/cm2, 3% of
the residuals were extracted from the film, which was 1/6 less than the amount of extracted residuals obtained at an intensity of 3 mW/cm2. Even though the film was wiped
[image:5.595.61.285.324.500.2]0 100 200 300 400 500 0
10 20 30 40 50 60 70 80 90 100
Mass
fracti
on of
res
iduals
,
fe
[%
]
[image:6.595.59.287.95.272.2]Exposure time [s]
Figure 7. Effect of exposure time on the mass fraction of the residuals. The UV intensity was 3 mW/cm2. The photoini- tiator concentration was 1%. The cast thickness was 100 μm.
0 5 10 15 20 25 30
0 5 10 15 20 25 30
Thi
ckness of
unreacted layer,
Lu
[
m]
UV intensity [mW/cm2]
[image:6.595.309.536.96.271.2]Figure 8. Effect of the UV light intensity on the thickness of the unreacted layer. The photoinitiator concentration was 1%. The cast thickness was 100 μm.
Figure 10 shows the maximum temperature during the UV-curing process. The maximum temperature increased with an increase in the intensity of UV light. At intensi- ties of 20 and 30 mW/cm2, the maximum temperature
exceeded the human body temperature. Under these con-ditions, a human may feel warm. Thus, a UV intensity range of 3 to 10 mW/cm2 is recommended.
3.6. Effect of the Photoinitiator Concentration Figure 11 shows the effect of the photoinitiator concen-tration on the thickness of the unreacted layer. At a photoinitiator concentration of 5%, the thickness of the unreacted layer was 11 μm, which was less than that for a photoinitiator concentration of 1% (21 μm). Thus, the
0 5 10 15 20 25 30
0 10 20 30 40 50 60 70 80 90 100
Mass fraction
o
f resid
uals,
f e
[%
]
[image:6.595.310.536.323.500.2]UV intensity [mW/cm2]
Figure 9. Effect of UV light intensity on the mass fraction of the residuals. The photoinitiator concentration was 1%. The cast thickness was 100 μm.
0 5 10 15 20 25 30
25 30 35 40 45
M
ax. Te
mper
ature [
ºC]
UV intensity [mW/cm2]
Figure 10. Effect of UV light intensity on the maximum tem- perature. The photoinitiator concentration was 1%. The cast thickness was 100 μm.
thickness of the unreacted layer decreased with an in-crease in the photoinitiator concentration.
The amount of radicals formed in a 5% solution of the photoinitiator was greater than that observed in a 1% solution. As the rate of radical generation increased, the balance between oxygen diffusion and radical generation shifted, and thinner unreacted layers were obtained.
Figure 12 shows the effect of the photoinitiator con-centration on the maximum temperature. The difference between the maximum temperature associated with a photoinitiator concentration of 5% and 1% was greatest at an intensity of 3 mW/cm2 and decreased with an
in-crease in UV intensity. At an intensity of 12 mW/cm2,
[image:6.595.61.287.325.500.2]0 50 100 150 200 0
5 10 15 20 25 30
1 % 5 %
Thick
ness of
un
reacted
layer,
Lu
[
m]
[image:7.595.61.286.93.269.2]Cast thickness, L0 [m]
Figure 11. Effect of the photoinitiator concentration on the thickness of the unreacted layer. The UV light intensity was 3 mW/cm2. The exposure time was 60 s. The cast thickness was 100 μm.
0 5 10 15 20 25 30
28 30 32 34 36 38 40 42
1 % 5 %
Ma
x.
Te
mper
at
ure
[ºC]
[image:7.595.315.530.96.260.2]UV intensity [mW/cm2]
Figure 12. Effect of the photoinitiator concentration on the maximum temperature. Cast thickness was 100 μm, and exposure time was 60 s.
negligible and remained constant as the intensity of UV light was further increased. Although an increase in the UV intensity increased the maximum temperature, the effect of the photoinitiator concentration was more pro-nounced for lower UV intensities.
Figure 13 shows the effect of the photoinitiator con-centration on the amount of extracted residuals. As shown in the figure, the amount of extracted residuals decreased with an increase in the photoinitiator concen-tration.
4. Limitations
The weight percent of residuals decreased with an in-crease in the exposure time, intensity of UV light, and
0 1 2 3 4 5
0 10 20 30 40 50 60 70 80 90 100
Mass fraction of
residuals
[%]
Photoinitiator concentration [%]
Figure 13. Effect of the photoinitiator concentration on the amount of extracted residuals. UV light intensity was 3 mW/cm2, exposure time was 60 s and cast thickness was 100
μm.
photoinitiator concentration. However, the weight per-cent of extracted residuals was greater than the typical specifications of cosmetic materials, which is 10 ppm of residual monomers and photoinitiators. Thus, the amount of residuals must be further decreased for UV gel nail treatment.
5. Conclusions
A method to evaluate the thickness of the unreacted layer, the temperature profile of the reaction and the residual monomer content of cured films was developed for UV gel nail treatment. The thickness of the unreacted layer was not affected by the thickness of the cast film; how-ever, the intensity of the UV light and the photoinitiator had an effect on the thickness of the unreacted layer. To reduce the thickness of the unreacted layer, the UV tensity and the photoinitiator concentration can be in-creased. However, an increase in the photoinitiator con-centration or the UV intensity can increase the maximum temperature of the UV gel nail curing process. A suitable range of cast thicknesses (21 - 150 μm), which resulted in the formation of a cured layer and did not increase the temperature beyond that of the human body was identi-fied.
6. Acknowledgements
[image:7.595.64.283.330.503.2]Pro-motion of Science (JSPS, 20760513 and 22760587).
REFERENCES
[1] W. Hemmer, M. Focke, F. Wantke, M. Götz and R. Jarisch, “Allergic Contact Dermatitis to Artificial Finger-nails Prepared from UV Light-Cured Acrylates,” Journal of the American Academy of Dermatology, Vol. 35, No. 3, Part 1, 1996, pp. 377-380.
doi:10.1016/S0190-9622(96)90600-3
[2] P. Rich, “Nail Cosmetics and Camouflaging Techniques,”
Dermatologic Therapy, Vol. 14, No. 3, 2001, pp. 228-236.
doi:10.1046/j.1529-8019.2001.01023.x
[3] L. Constandt, E. V. Hecke, J. M. Naeyaert and A. Goo- ssens, “Screening for Contact Allergy to Artificial Nails,”
Contact Dermatitis, Vol. 52, No. 2, 2005, pp.73-77.
doi:10.1111/j.0105-1873.2005.00496.x
[4] R. Sauni, P. Kauppi, K. Alanko, M.-L. Henriks-Eckerman, M. Tuppurainen and T. Hannu, “Occupational Asthma Caused by Sculptured Nails Containing Methacrylates,”
American Journal of Industrial Medicine, Vol. 51, No. 12, 2008, pp. 968-974. doi:10.1002/ajim.20633
[5] S. R. Reutman, A. M. Rohs, J. C. Clark, B. C. Johnson, D. L. Sammons, C. A. Toennis, S. A. Robertson, B. A. Mac- Kenzie and J. E. Lockey, “A Pilot Respiratory Health Assessment of Nail Technicians: Symptoms, Lung Func-tion, and Airway InflammaFunc-tion,” American Journal of Industrial Medicine, Vol. 52, No. 11, 2009, pp. 868-875.
doi:10.1002/ajim.20751
[6] W. D. Cook, “Photopolymerization Kinetics of Dime- thacrylates Using the Camphorquinone Amine Initiator System,” Polymer, Vol. 33, No. 3, 1992, pp. 600-609.
doi:10.1016/0032-3861(92)90738-I
[7] K. S. Anseth, S. M. Newman and C. N. Bowman, “Poly-meric Dental Composites: Properties and Reaction Be-havior of Multimethacrylate Dental Restorations,” Ad-vances in Polymer Science, Vol. 122, 1995, pp. 177-277. [8] A. D. Neves, J. A. C. Discacciati, R. L. Oréfice and M. I.
Yoshida, “Influence of the Power Density on the Kinetics of Photopolymerization and Properties of Dental Com-posites,” Journal of Biomedical Materials Research Part B: Applied Biomaterials,Vol. 72B, No. 2, 2005, pp. 393- 400. doi:10.1002/jbm.b.30179
[9] C. Sanglar, M. Defay, H. Waton, A. Bonhomme, S. Ala- mercery, R. Baudot, O. Paisse and M. F. Grenier-Loustalot, “Commercial Dental Composite: Determination of Reac-tion Advancement and Study of the MigraReac-tion of Organic Compounds,” Polymers and Polymer Composites, Vol. 13, No. 3, 2005, pp. 223-234.
[10] F. F. Silva, L. C. Mendes, M. Ferreira and M. R. Benzi, “Degree of Conversion versus the Depth of Polymeriza-tion of an Organically Modified Ceramic Dental Restora-tion Composite by Fourier Transform Infrared Spectros-copy,” Journal of Applied Polymer Science, Vol. 104, No. 1, 2007, pp. 25-30. doi:10.1002/app.23248
[11] R. Schwalm, “UV Coatings: Basic, Recent Developments and New Application,” Elsevier, Amsterdam, 2007. [12] M. D. Goodner, H. R. Lee and C. N. Bowman, “Method
for Determining the Kinetic Parameters in Diffusion-Con- trolled Free-Radical Homopolymerizations,” Industrial & Engineering Chemistry Research, Vol. 36, No. 4, 1997, pp. 1247-1252. doi:10.1021/ie9605387
[13] D. Dendukuri, P. Panda, R. Haghgooie, J. M. Kim, T. A. Hatton and P. S. Doyle, “Modeling of Oxygen-Inhibited Free Radical Photopolymerization in a PDMS Microflu-idic Device,” Macromolecules, Vol. 41, No. 22, 2008, pp. 8547-8556. doi:10.1021/ma801219w
[14] A. K. O’Brien and C. N. Bowman, “Modeling the Effect of Oxygen on Photopolymerization Kinetics,” Macromo-lecular Theory and Simulations, Vol. 15, No. 2, 2006, pp. 176-182. doi:10.1002/mats.200500056
[15] A. K. O’Brien and C. N. Bowman, “Impact of Oxygen on Photopolymerization Kinetics and Polymer Structure,”
Macromolecules, Vol. 39, No. 7, 2006, pp. 2501-2506.