IMPLICATION OF DIFFERENT NON
NUTRIENTS DIGESTIBILITY AND PRODUCTION OF LACTATING
1*
Mousa, M. A.,
1
Nutrition and Clinical Nutrition Dept., Faculty of Vet.
2
Biochemistry Dept., Faculty of Vet. Med. Sohag University, Sohag, Egypt
3Dairy science and Technology Dept., Faculty of Agriculture & Natural Resou
ARTICLE INFO ABSTRACT
In this research, we aimed to study the implications of different carbohydrates sources on dry matter intake, nutrients digestibility and production, 9 lactating
weight=670 ± 40 kg) were allotted into3 groups (3 cows per each) for one month period. The treatments included different sources of non
(44.38, 44.59 and 44.25% DM in basal diet treatment (B), b
distillers’ grains diet treatment (DD), respectively). Cows of group BP had a higher DMI, where DMI and NDF digestibility were improved. Ruminal pH was increased in group cows B and DD (6.63 and 6.64, respectively) co
was decreased and pH increased in the BP group; whereas, a higher percentage of acetate and ratio of acetate: propionate were noticed with animals allotted to B treatment. Milk impr
Replacing NFC sources with different digestion coefficient, this change feed intake, ruminal bacterial population, and lactation performance. We could conclude that inclusion of different sources of NFC produce a better performance and
Copyright © 2017, Mousa et al. This is an open access distribution, and reproduction in any medium, provided
INTRODUCTION
Carbohydrate is the main component of dairy feeds and rations. Carbohydrate is divided into non-fibrous carbohydrate (NFC) and neutral detergent fiber (NDF), both make up to 75% of rations. The NFC composed from neutral detergent soluble carbohydrate (NDSC), starch and sugars.
2007 and Varga, 2003 reported that carbohydrates balance in dairy cow diets affect by NDF amount and NFC, also NDF composition, NFC composition, and NDF:NFC ratio. However, NDF requirement percentage (27%
NFC content (45% - 35%) (NRC, 2001). The NFC value is reported as a single number, but its fractions are largely varies. The starch is deponent in NFC in maize
(65-in beet pulp ranges (12-40%) and NDSC (25%
distillers’ grains with solubles (DDGS) is characterized by high crude protein (25- 32%, dry matter) and 47% NDF (Belyea et al. 2010). When DDGS is added in cows ration, it replaces soybean meal as a source of protein, besides it consider a source of energy as it replaces corn
al. 2010).
*Corresponding author: Mousa, M. A.,
Nutrition and Clinical Nutrition Dept., Faculty of Vet., Med. Sohag University, Sohag, Egypt.
ISSN: 0975-833X
Vol.
Article History:
Received 30th September, 2017 Received in revised form 15th October, 2017
Accepted 18th November, 2017 Published online 27th December, 2017
Citation: Mousa, M. A., Osman, A. S. and Elkot, W. F.
and production of lactating-cows in Egypt”, International Journal of Current Research
Key words:
Lactating-cow, Soluble Carbohydrate, Digestibility.
RESEARCH ARTICLE
IMPLICATION OF DIFFERENT NON-FIBROUS CARBOHYDRATE SOURCES ON INTAKE,
NUTRIENTS DIGESTIBILITY AND PRODUCTION OF LACTATING-COWS IN EGYPT
Mousa, M. A.,
2Osman, A. S. and
3Elkot, W. F.
Nutrition and Clinical Nutrition Dept., Faculty of Vet., Med. Sohag University, Sohag, Egypt
Biochemistry Dept., Faculty of Vet. Med. Sohag University, Sohag, Egypt
Dairy science and Technology Dept., Faculty of Agriculture & Natural Resources, Aswan University, Egypt
ABSTRACT
In this research, we aimed to study the implications of different carbohydrates sources on dry matter intake, nutrients digestibility and production, 9 lactating-cows (days in milk= 110±30 weight=670 ± 40 kg) were allotted into3 groups (3 cows per each) for one month period. The treatments included different sources of non-fibrous carbohydrate (NFC), where its percentages are (44.38, 44.59 and 44.25% DM in basal diet treatment (B), beet pulp diet treatment (BP) and dried distillers’ grains diet treatment (DD), respectively). Cows of group BP had a higher DMI, where DMI and NDF digestibility were improved. Ruminal pH was increased in group cows B and DD (6.63 and 6.64, respectively) compared with those that received BP group (6.26). The propionate percentage was decreased and pH increased in the BP group; whereas, a higher percentage of acetate and ratio of acetate: propionate were noticed with animals allotted to B treatment. Milk impr
Replacing NFC sources with different digestion coefficient, this change feed intake, ruminal bacterial population, and lactation performance. We could conclude that inclusion of different sources of NFC produce a better performance and productivity.
access article distributed under the Creative Commons Attribution License, the original work is properly cited.
Carbohydrate is the main component of dairy feeds and fibrous carbohydrate (NFC) and neutral detergent fiber (NDF), both make up to 75% of rations. The NFC composed from neutral detergent ), starch and sugars. Tafaj et al., reported that carbohydrates balance in dairy cow diets affect by NDF amount and NFC, also NDF composition, NFC composition, and NDF:NFC ratio. However, NDF requirement percentage (27% - 37%), besides The NFC value is reported as a single number, but its fractions are largely varies. -70%), while sugar 40%) and NDSC (25%–44%). Dried distillers’ grains with solubles (DDGS) is characterized by 32%, dry matter) and 47% NDF When DDGS is added in cows ration, it replaces soybean meal as a source of protein, besides it f energy as it replaces corn (Ranathunga et
Nutrition and Clinical Nutrition Dept., Faculty of Vet., Med. Sohag
Janicek et al. (2008) limit addition of DDGS to 10% in ration due to high fat content, which disturb ruminal fiber digestion and the microbial population (Van Soest 1994) and reduce milk fat production. Anderson et al. (2006)
DDGS as it maintain high milk yield, furthermore,
al. (2008) feed up to 30% of the ration and found positive effect on milk yield and quality. In addition,
Kononoff (2010) observed a reduction of N excretion and efficient N utilization for milk production.
Larson (2003) documented that rapidly d
effects on fiber fermentation, where a rate of replacing NFC by fiber of ration; starch digestion site; DMI and the physiological state; and processing methods of NFC sources, are the main cause of variation in the impact of the amount and
NFC on lactating-cows. However, the recommended amount of NFC for dairy cow rations is not clear. According (2001), the absence of clear recommendations is due to wide nutritional values in the sources of NFC, nutrient digestion, and the metabolism. Consequently, deep understanding of NFC types, digestibility and metabolism can improve animal productivity besides maintaining health. The NFC nature varies among feeds and diets. The impact of increasing or decreasing NFC was completely related
International Journal of Current Research
Vol. 9, Issue, 12, pp.62605-62612, December, 2017
Mousa, M. A., Osman, A. S. and Elkot, W. F. 2017. “Implication of different non-fibrous carbohydrate sources on intake, nutrients digestibility
International Journal of Current Research, 9, (12), 62605-62612.
FIBROUS CARBOHYDRATE SOURCES ON INTAKE,
COWS IN EGYPT
Med. Sohag University, Sohag, Egypt
Biochemistry Dept., Faculty of Vet. Med. Sohag University, Sohag, Egypt
rces, Aswan University, Egypt
In this research, we aimed to study the implications of different carbohydrates sources on dry matter cows (days in milk= 110±30 d; live weight=670 ± 40 kg) were allotted into3 groups (3 cows per each) for one month period. The fibrous carbohydrate (NFC), where its percentages are eet pulp diet treatment (BP) and dried distillers’ grains diet treatment (DD), respectively). Cows of group BP had a higher DMI, where DMI and NDF digestibility were improved. Ruminal pH was increased in group cows B and DD (6.63 and mpared with those that received BP group (6.26). The propionate percentage was decreased and pH increased in the BP group; whereas, a higher percentage of acetate and ratio of acetate: propionate were noticed with animals allotted to B treatment. Milk improved with BP group. Replacing NFC sources with different digestion coefficient, this change feed intake, ruminal bacterial population, and lactation performance. We could conclude that inclusion of different sources of NFC
License, which permits unrestricted use,
) limit addition of DDGS to 10% in ration due to high fat content, which disturb ruminal fiber digestion and the microbial population (Van Soest 1994) and reduce . Anderson et al. (2006) recommended DDGS as it maintain high milk yield, furthermore, Janicek et to 30% of the ration and found positive effect on milk yield and quality. In addition, Gehman and observed a reduction of N excretion and efficient N utilization for milk production. NRC, (2001) and documented that rapidly degradable starch effects on fiber fermentation, where a rate of replacing NFC by fiber of ration; starch digestion site; DMI and the physiological state; and processing methods of NFC sources, are the main cause of variation in the impact of the amount and nature of cows. However, the recommended amount of NFC for dairy cow rations is not clear. According NRC, the absence of clear recommendations is due to wide nutritional values in the sources of NFC, nutrient digestion, tabolism. Consequently, deep understanding of NFC types, digestibility and metabolism can improve animal productivity besides maintaining health. The NFC nature varies among feeds and diets. The impact of increasing or decreasing NFC was completely related to NDF (Grant, 1997
INTERNATIONAL JOURNAL OF CURRENT RESEARCH
and Tafaj et al., 2007), so we could conclude that the content of NFC from different feeds gives a different action of NDF. The physically effective NDF (peNDF) give focus on particle size, NDF amount, and effect of replacing forage fiber with NFC, that inform us about the effect of feed particles and chewing performance (Teimouri and Primohammadi 2009). Therefore, more information and studies of the values of NFC types in feeds help in the optimal utilization of feed ingredients, and formulate appropriate dairy rations that could improve performance. Whereas, ruminal acidosis is more common in dairy farms, the knowledge on the perfect level of soluble carbohydrate in diets of dairy cows is critical to make its control easer, besides the effective milk production from available energy. The main object of the current work was to study the impact of different feed carbohydrate, (wheat bran (B), beet pulp (BP) and DDGS (DD)) on DMI, digestibility of nutrients, chewing time and milk production.
MATERIALS AND METHODS
Cows and rations
The study was done at Khafagi Farm for milk production, Kafr El-Sheikh governorate, Egypt. The trial was conducted under the observation and according the regulation of Nutrition and Clinical Nutrition Dept. Faculty of Vet. Med. Soahg University. Nine mid-lactation Frisian dairy cows (BW = 670 ± 40 kg; DIM = 110 ± 30 d) were separated into three groups (3 per each). The experiment lasts 30-d periods (adaptation period, 14 d; samples collection periods, 14 d; and estimation of chewing activity period, 2 d). Diets composed from different sources of carbohydrate, (Table 1). Wheat bran, beet pulp and DDGs were prepared by miller with sieve 2-mm pores. Rations had the same composition (17.2% CP and 1.56 Mcal/kg of NEL) and same fiber characteristics (peNDF) (Table 2). Animals in different group were separated in different places. Diets were given ad-libitum twice per day for all groups, diets amount are adjusted (as-fed basis) with 10% remain as residue. Animals had free access to water and mineralized blocks along the experimental time.
Feed particle size and effective fiber
A Penn State feed particle separator was used to determine feed particle length and distribution (Kononoff, 2002). The NDF content on separator sieve layers were determined according to AOAC,( 2002) and Van Soest et al., (1991). The physical effective factor (pef) of the diets was measured. Regarding to Kononoff, et al. (2003) the measure of pef was attributed to the amount of feed remain on the 1.18-m sieve and referred as pefm, while amount retained by 19- and 8-mm sieves referred as pef>8, and the amount remain by 19, 8, and 1.18-mm sieves refereed as pef>1.18, (Table 2).
Live weight, feed intake, and digestibility of nutrients
Live BW was estimated every week, while feed intake was estimated every day. Diets samples, residual feed and animal feces were collected every day for successive 7 days at morning milking, weighed. The samples kept after drying at 55°C /48 h and prepared with 1-mm screen mill, for the analysis of dry matter, protein, total lipids, ash, NDF, and ADF (AOAC, 2002) (Table 3). Non-fibrous carbohydrate was estimated by this equation: 100 - % CP +% NDF +% ash +% EE (NRC, 2001).
Soluble sugars and starch were measured in diet samples (Table 3), while The NDSC was estimated as NFC (%) by this equation: (Sugar (%) + Starch (%), (Hall, et al., 1999). The feed intake and digestibility (% of DM) were estimated. Intake
of peNDFs (m, >8 and >1.18) were estimated for all groups.
Rumen characteristics
Fifty mL from ruminal liquor were collected 3 hours after the morning diets, with rumenocentesis approach. Fluid acidity was estimated after extraction as early as possible with a portable pH meter, and then samples were kept at −20°C. The ammonia nitrogen in rumen liquor was estimated (Inkjel, behrotest (Model S1, Behr Co. Germany). Acidification of ruminal liquors were done by addition of 2.5 mL HCl of 6-mol/L and then frozen for more analysis of VFAs and ammonia. Gas chromatography used for VFAs after centrifugation at 18,000 rpm /20 min (Merchen, et al., 1986).
Feeding and rumination times
Feeding and rumination activities were observed for animals in all groups over a day time (24-h) for 2 days and at day 23 to 24. These observations of activities were recorded at intervals of 5-min and continue for the entire interval. Total chewing time was calculated as the summation of both eating and rumination times (Teimouri and Primohammadi, 2009) (Table 4).
Milk yield
The daily milk production was recorded along the experiment time. On day 15 to 20, samples were taken every time of milking. A100 mL milk samples were used to determine milk fat %, protein%, and lactose% (AOAC, 2002).
Statistical analysis
The main impact of diets was analyzed by one-way analysis of variance with the procedure of Excel program (Microsoft Office, 2010). At observation of significant difference in the analysis, Bonferroni Correction (Bonferroni Post Hoc Test) was used to know statistical significance (p<0.05) among groups and means were separated.
RESULTS AND DISCUSSION
Feed composition, and physical character
Table 1. Feed ingredients and chemical analysis of rations containing non-fiber carbohydrates from different sources
Item Groups
Basal-diet (B) Beet pulp-diet (BP) DDG-diet (DD)
Ingredients, % of DM
Alfalfa hay 25.05 25.01 26.04
Corn silage 15.05 14.83 15.33
Wheat bran 20.01 7.04 7.29
Soybean meal 3.06 3.05 00
Sunflower meal 3.06 3.05 3.43
Cotton seed meal 3.06 3.05 3.43
Corn grain 30.11 28.02 29.17
Beet pulp 00 15.00 00
DDGs 00 00 15.06
Vitamin-mineral supplement1 0.25 0.25 0.25
Urea 0.35 0.7 00
Chemical analysis, % of DM (Mean±SD)
CP 17.26± 0.16 17.17±0.82 17.21±0.23
NDF 31.43±0.82 31.37±0.66 31.11±0.2
ADF 24.08±0.21 24.53±0.74 24.73±0.14
NFC 44.38±0.14 44.59±0.3 44.25±0.3
Starch 31.45±0.26a 27.01±0.19c 28.77±0.21b
Sugar 5.89±0.39 6.24±0.09 5.81±0.11
NDSC2 7.07±0.15c 11.60±0.2a 9.38±0.16b
EE 3.25±0.03ab 3.07±0.14b 3.44±0.13a
Ash 3.84±0.11b 4.26±0.14a 4.28±0.15a
NEl3, Mcal/kg of DM 1.56±0.01 1.57±0.01 1.58±0.01
a, b, c
The means with different subscripts within each row differ (P < 0.05).
1Vitamin-mineral supplement: Cover the dairy requirements of trace mineral and vitamins according to NRC, (2001). 2 NDSC: Neutral detergent soluble carbohydrate.
[image:3.595.96.509.387.506.2]3 NEl was estimated according to NRC, (2001).
Table 2. Fiber physical characteristics of the rations containing non-fiber carbohydrates from different sources
Item Groups
Basal-diet (B) Beet pulp-diet (BP) DDG-diet (DD)
Particle size content (amount remain on each sieve) (% of DM) (Mean±SD)
19 mm 10.33±0.34 11.24±0.29 10.52±0.38
8 mm 21.40±0.51a 21.12±0.22a 19.44±0.1b
1.18 mm 35.14±0.12b 34.73±0.16b 37.68±0.15a
Pan 33.20±0.1a 33.24±0.11a 32.42±0.05b
Physical effective factor
Pef > 8 1 31.73±0.71ab 32.36±0.41 a 29.95±0.44 b
Pef > 1.182 66.87±0.7 67.1±0.26 67.63±0.29
Physical effective NDF, % of DM 3
peNDF > 8 9.97±0.13 a 10.15±0.13 a 9.32±0.11 b
peNDF > 1.18 21.01±0.35 21.05±0.38 21.04±0.11
a, b, c The means with different subscripts within each row differ (P < 0.05).
1, 2pef>8 = physically effective factor, determined as % of DM retained on sieves layers of the standard Penn State particle separator. 3The peNDF was estimated by multiplying NDF content of each portion on each sieve on respective pef.
Table 3: Live body weight, intake, and nutrient digestibility of rations containing non-fiber carbohydrates from different sources
Item Groups
Basal-diet (B) Beet pulp-diet (BP) DDG-diet (DD)
(Mean±SD)
BW, kg 602.67±16.17 592.00±12.53 585.33±16.62
Intake, kg/d
DM 21.3±0.26 b 22.03±0.15 a 20.17±0.23 c
NDF 6.69±0.24 ab 6.91±0.13 a 6.27±0.05 b
peNDF > 81 2.12±0.03b 2.24±0.03a 1.88±0.04 c
peNDF > 1.182 4.48±0.11ab 4.64± 0.08a 4.24± 0.05 b
CP 3.68±0.04b 3.78±0.03a 3.47±0.06C
NFC 9.45±0.14a 9.82±0.08a 8.92±0.1b
Starch 6.7± 0.14 a 5.95±0.05 b 5.8± 0.07 b
Sugar 1.25±0.07ab 1.38±0.02a 1.17±0.03b
NDSC3 1.5±0.07 c 2.5±0.12 a 1.95±0.08 b
EE 0.69±0.01 0.68±0.04 0.69±0.03
OM 20.52±0.4a 21.19±0.1a 19.36±0.19b
Digestibility, %
DM 74.77 ±1.62 ab 75.81±0.5 a 74.09±0.47 b
NDF 69.4± 1.02 a 66.85± 0.62 ab 64.33±2.4 b
ADF 59.71 ± 1.36 54.44 ± 1.93 55.69± 1.85
CP 75.72±2.05 76.23±1.76 73.34±1.28
NFC 85.64±0.98 b 89.63±0.71 a 88.95±1.09 a
EE 67.85±1.47 68.73±0.42 67.87±1.31
a, b, cMeans with different subscripts within each row differ (P < 0.05).
1, 2peNDF>8 = physically effective NDF, determined as the proportion of DM retained on sieves of the standard Penn State
[image:3.595.154.450.574.782.2]The amount of pef (>8 and >1.18-mm sieves) and peNDF of the diets were different (Tables 1, 2). The lowest pef values of rations was pef>19-mm, although the pef>1.18 values were higher in all groups, this reflect the variation of peNDF values among groups. In the current study, peNDF>1.18 were around 21% DM, where Mertens (1997) recommended 21% to maintain optimal chewing activity where the rumen pH was higher than 6.0 and 20% to maintain milk fat percentage. The variances among groups were attributed to the impact of both peNDF content of rations and NFC composition, besides its sources. Starch amount of BP and DD groups was similar and lower than that recoded in the B group, but the NDSC significantly differ among groups. These data proved that amount of starch and soluble carbohydrates differ with different NFC sources. Our hypothesis was that feeding different carbohydrate sources, (NDF and NFC source), could change DMI, rumen characteristics, chewing activity, and milk yield and composition. In our work, milk yield and its fat percentage are more related to particle size (PS) on 8-mm than both 19-m and 1.18-mm sieves, where Esmaeili et al. (2016) and Kononoff, (2002) found that it is more related to 8-mm and 19-mm sieve. In the line of our results Yang and Beauchemin (2007) found same positive relation and documented that peNDF8 and the amount of particles 1 9mm were more important variables than peNDF 1.18.
DM intakes and apparent digestibility
Feed intake, NDF and peNDF>1.18 intake were different (P < 0.05), this reflect the difference in the intake of CP, NFC, and EE, among treatments. Changing NSCS sources increase feed intake at BP treatment, where reduced with DD treatment (Table 3). The NFC nature affects feed intake, and milk production and its quality. Increasing feed intake was recorded as a response for BP feeding. Intake of starch, sugars, and NDSC differed among the groups. Animals allotted to B and BP diets had better intake of starch compared with DD diet. Animals allotted to the DD diet had the lowest intake of both sugar and NDSC. Digestibility of DM, NDF, NFC, and EE differed among treatments. The better DM and NDF digestibility were recorded with treatment B (Table 3).
The intake of NDF, NFC and peNDF>1.18 differed than its pattern in the diets. Treatment BP, which had more NSDC intake, showed increased in DMI. These results have been supported by Poorkasegaran and Yansari et al., (2014). Replacing sugars and NDSC instead of starch has effects on intake where DMI was increased (Broderick et al., 2002) or not affected (Friggens et al., 1995). Also, raising of NDSC intake at the expense of starch may increase DMI (Allen et al., 2000), decrease (Broderick et al., 2002), or still as it (Leiva et aal., 2000). Variance in digestibility of fiber using different NFC sources may explain these results (Larson2003). Increased DMI in treatment BP could have been explained according to high NDSC and sugar content and compared with treatments B and DD. In our trial, DMI reflect the NFC intake by treatments, besides the VFA concentration where it is production has a positive relation with rate of fermentation of starch. Whereas, BP are higher intake followed by B and then came DD group (22.03, 21.3 and 20.17 respectively), and the NFC and sugar have the same pattern, the starch and NDSC have different pattern, also we could attribute this increase of DMI to higher level of VFA that also have the same order of DMI (115.43, 115.39 and 108.48 mol/L) (Table 5). Therefore, it looks like that VFAs metabolism in the body, reduce DMI in
groups B and DD compared with BP. Leiva et al., (2000) explain the DMI reduction according to propionate content and metabolism in liver due to the reduction of hepatic propionate oxidation. Besides, ruminal pH affects intake of feed, where at lower pH, the VFAs were rapidly absorbed (Poorkasegaran and Yansari et al., 2014). In addition, replacing grain with high-fiber ingredients (BP and DDG), may result in energy content reduction or limit feed intake through the filling effects of the feeds (Poorkasegaran and Yansari et al., 2014). Ramierz et al., (2012) found an improvement of DMI in feeding DDG, that we did not observed in our experiment, besides they found improvement in NDF digestibility and no productive response, confirmed by our results. Schingoethe et al. (2009) observed that DDGS feeding to lactating cows not affects or increases milk yield. In our study, milk production still constant by the DDGS feeding, but when comparing milk yield on an iso-energetic basis (3.5% FCM), we observe decrease in milk yield.
Obviously, cows allotted to B and BP diets produced 3.6 kg more 3.5% FCM than allotted to DDGS diets. This response is due to a negative impact of DDGS on milk fat percentage It is believed that diets that are highly fermentable and also has a great amount of unsaturated fatty acids result in rumen conditions that favor bacterial bio-hydrogenation of fatty acids and formation of intermediates of conjugated linoleic acid (CLA) that ultimately inhibit milk fat production of mammary tissue (Shingfield and Griinari 2007; Bauman et al. 2008; Ramierz et al., 2012). However, we suspected a different response because of the previous work that record that addition of DDGS up to 30% of the diet had not any effect on milk fat % (Anderson et al. 2006; Schingoethe et al. 2009). Whereas, Abdelqader et al. (2009) and Hippen et al. (2010) found that DDGS are responsible for reductions in milk fat %. Baumgard et al. (2000) attributed the reduction of milk fat % to feeding DDGS that contains high levels of polyunsaturated fatty acids (PUFA), where these fatty acids when consumed in large amounts they are bio-hydrogenated by ruminal microfona, producing an intermediates such as trans-10, cis-12 CLA that responsible for the decrease expression of lipogenic enzymes, so decrease production of milk fat in mammary tissue.
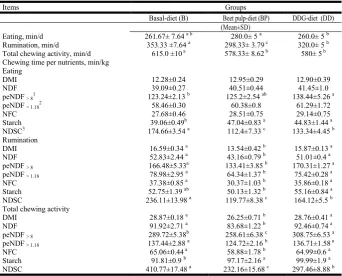
Table 4. The observation of chewing activity of lactating-cows fed on rations containing non-fiber carbohydrates from different sources
Items Groups
Basal-diet (B) Beet pulp-diet (BP) DDG-diet (DD)
(Mean±SD)
Eating, min/d 261.67± 7.64 a b 280.0± 5 a 260.0± 5 b
Rumination, min/d 353.33 ±7.64 a 298.33± 3.79 c 320.0± 5 b
Total chewing activity, min/d 615.0 ±10 a 578.33± 8.62 b 580± 5 b
Chewing time per nutrients, min/kg Eating
DMI 12.28±0.24 12.95±0.29 12.90±0.39
NDF 39.09±0.27 40.51±0.44 41.45±1.0
peNDF > 81 123.24±2.13 b 125.2±2.54 ab 138.44±5.26 a
peNDF > 1.182 58.46±0.30 60.38±0.8 61.29±1.72
NFC 27.68±0.46 28.51±0.75 29.14±0.75
Starch 39.06±0.49b 47.04±0.83 a 44.83±1.44 a
NDSC3 174.66±3.54 a 112.4±7.33 c 133.34±4.45 b
Rumination
DMI 16.59±0.34 a 13.54±0.42 b 15.87±0.13 a
NDF 52.83±2.44 a 43.16±0.79 b 51.01±0.4 a
peNDF > 8 166.48±5.33a 133.41±3.85 b 170.31±1.27 a
peNDF > 1.18 78.98±2.95 a 64.34±1.37 b 75.42±0.28 a
NFC 37.38±0.85 a 30.37±1.03 b 35.86±0.18 a
Starch 52.75±1.39 ab 50.13±1.32 b 55.16±0.84 a
NDSC 236.11±13.98 a 119.77±8.38 c 164.12±5.5 b
Total chewing activity
DMI 28.87±0.18 a 26.25±0.71 b 28.76±0.41 a
NDF 91.92±2.71 a 83.68±1.22 b 92.46±0.74 a
peNDF > 8 289.72±5.38b 258.61±6.38 c 308.75±6.53 a
peNDF > 1.18 137.44±2.88 a 124.72±2.16 b 136.71±1.58 a
NFC 65.06±0.44 a 58.88±1.78 b 64.99±0.6 a
Starch 91.81±0.9 b 97.17±2.16 a 99.99±1.9 a
NDSC 410.77±17.48 a 232.16±15.68 c 297.46±8.88 b
a, b, c
Means with different subscripts within each row differ (P < 0.05).
1,2 peNDF>8 = physically effective NDF, determined as % of DM retained on sieves layers of the standard Penn State particle
separator.
[image:5.595.131.467.433.570.2]3NDSC = Neutral detergent soluble carbohydrate.
Table 5: Ruminal liquor pH, ammonia and VFAs concentration of rations containing non-fiber carbohydrates from different sources
Item Groups
Basal-diet (B) Beet pulp-diet (BP) DDG-diet (DD) (Mean±SD)
pH 6.63±0.01 a 6.26±0.01 b 6.64±0.01 a
NH3-N, mg/dL (Ammonia nitrogen) 7.37±0.06 a 7.43± 0.14 a 6.59±0.15 b VFA concentration
Total, mmol/L 115.39±1.88 a 115.43±1.8 a 108.48±1.98 b Acetate, mol/100 mol 61.07±0.94 b 64.77±0.75 a 61.32±0.85 b Propionate, mol/100 mol 26.16±0.54 a 25.76±0.31 a 24.33±0.31 b Butyrate, mol/100 mol 6.54±0.03 a 6.27±0.14 c 6.38±0.14 b Isobutytate, mol/100 mol 2.17±0.07 2.44±0.11 2.35±0.08 Valerate, mol/100 mol 3.23±0.09 b 3.45±0.03 a 3.38±0.07 ab Isovalerate, mol/100 mol 2.3±0.07 2.46±0.07 2.28±0.09
Acetate: propionate 2.35±0.07 2.51±0.08 a 2.5±0.08
a, b, cMeans with different subscripts within each row differ (P < 0.05).
Table 6: the implication of rations containing non-fiber carbohydrates from different sources on milk production and its constituents of lactating-cows
Item Groups
Basal-diet (B) Beet pulp-diet (BP) DDG-diet (DD)
(Mean±SD) Milk production and milk constituents, (kg/d)
Milk 22.97±0.51 b 23.87±0.32 a 22.77±0.39 b
3.5% FCM1 23.52±0.56 a 25.09±0.25 a 22.91±0.4 b
ECM2 23.68±0.65 b 25.15±0.29 a 23.22±0.48 b
Fat 0.84±0.02 b 0.91±0.01 a 0.81±0.02 b
Protein 0.77±0.03 0.81±0.02 0.78±0.02
Lactose 1.07±0.02 1.12±0.02 1.06±0.02
Total solid 2.68±0.07 ab 2.83±0.04 a 2.65±0.06 b
Milk composition, %
Fat 3.65±0.02b 3.82±0.03 a 3.54± 0.05 b
Protein 3.37±0.06 3.38±0.07 3.41±0.06
Lactose 4.67±0.03 4.68±0.03 4.67±0.02
Total solid 11.68±0.04b 11.88±0.02a 11.62±0.12b
a,bMeans with different subscripts within each row differ (P < 0.05).
1Formula for 3.5% fat-corrected milk (FCM): [(0.4324 × kg of milk) + (16.216 x kg of fat)].
2ECM = energy-corrected milk; value corrected for 3.5% fat and 3.2% true protein using formula from NRC (2001): [(0.3246 × kg of milk) +
[image:5.595.137.460.620.763.2]Also, Poorkasegaran and Yansari et al. (2014) observed that propionate affect DMI as our result, but we suppose the propionate effect is concentration dependent not as general, (need more investigation), where we found B was higher DMI followed by BP then DD treatments, and the propionate concentration were 26.16, 25.76 and 24.33 mol/100, respectively. The addition of BP and DDG in the lactating-cow diet resulted in lowering digestibility of DM, and NDF, but increase digestibility of EE and NFC. In the current work, a lower digestibility of fiber in groups BP and DD was in line with decreasing chewing time, pH of ruminal fluid, and VFAs concentrations. The consumption of diets with high NFC has positive effects on fermentation and digestion. We could not neglect the influence of differences in digestible NDF. Valk et al. (1990) and Poorkasegaran and Yansari , et al. (2014) reported that lactating-cow allotted to corn based diet had a higher feed intake and consequently had a higher milk production than cows fed on BP, and this are opposite to our result of MDI but are in line with our result of digestibility, and chewing activity. The values DM digestibility is less than OM digestibility, because the amount of mineralized salt are not calculated with the DMI amount, thus in return increase the apparent loss of DMI.
Rumen liquor characteristics
Ruminal pH levels were decreased lactating- cows allotted to BP, where B and DD groups are higher (6.26, 6.63 and 6.64, respectively). Besides, the ammonia nitrogen concentration differs among groups (P < 0.05). The ammonia level was significantly decreased in B and DD groups than in BP group. Acetate amount were significantly varies among groups. The values of acetate and butyrate were decreased in B group, whereas BB group were the highest value (Table 5). High pectin or NDSC content of Beet pulp, consider the cause of relatively high amounts of acetate, so increase the acetate:propionate ratio but butyrate was lower than other CHO sources (Mansfield et al, 1994). Also, Lees et al. (1990) observed that lactating-cows allotted to BP were much higher values of acetate and butyrate, but propionate value was lower. Van Vuuren et al. (1993) report no variance in ruminal liquor pH or VFAs values in lactating-cows fed on carbohydrate sources. Different source of NFC or starch amount of lactating-cows ration has the ability to change the products concentration of rumen fermentation (Larson, 2003). Whereas, BP has high ruminal digestibility (Torrent etal., 1994), so support high levels of microbial protein production in rumen and milk yield, similar to the observation of corn based rations (Mansfield et al., 1994).
Milk production
The milk production was improved with BP treatment followed with the B and the DD groups come at last (23.87, 22.97 and 22.77Kg/day, respectively) (Table 6), also adding BP improves milk constituents such as fat and lactose percentages. Addition of BP may improve milk production (Huhtanen 1987), decrease (Valk et al., 1990), or still the same (Poorkasegaran and Yansari et al., 2014). This improvement could be attributed to feed intake which had the same order among groups. Besides, change pattern of fermentation in the rumen and VFAs values that implicate the hormonal status of the lactating-cow and alter production and constituents of milk due to the different CHO sources. The improvement of milkfat in treatments BP, consider a reflection to increase acetate,
butyrate and propionate levels in the ruminal fluid. Also, the fat improvement in group BP was caused by the elevation of NDF intake, peNDF and total chewing activity in lactating-cow. In consistent with our result, milk fat improved in animals allotted to BP treatment, Poorkasegaran and Yansari , et al., 2014 and Mansfield et al. (1994) who attributed them to intake of fiber and acetate values that were higher in rumen liquor. Mansfield et al. (1994) observed decrease milk amount, but improve of milk fat and protein in lactating-cows allotted to BP based diet compared with the corn based diet. The milk protein increased with BP, but this finding was in contrast to Mansfield et al. (1994), but was supported by the results of Valk et al. (1990). Chester-Jones et al. (1991) and DePeters et al. (1991) observe reduction in CP intake, ammonia level, and protein digestibility for lactating-cows allotted to BP ration, compared with corn or barley rations. The utilization of the NPN need NDSC that is extensively fermented in the rumen, so may improve microbial protein synthesis. Total VFA concentration in treatments DD was decrease, where lower VFAs level is indicative for decrease fermentation of fiber in the rumen and consequently decrease milk protein production. Rooke et al. (1992), and Chcster-Jones et al. (1991) support our findings, whereas Larson, (2003) and Poorkasegaran and Yansari et al. (2014) not. We could assume that NFC sources and digestibility support microbial population, that supply intestine with microbial protein, and so the protein amount is affected with CHO and crude protein sources, and pH (Poorkasegaran and Yansari et al. 2014 and Valk et al. 1990).
In our current study, we observe an improvement of parameters related to fat of milk and its production with increasing TMR PS. Esmaeili et al. (2016) found a positive relation between milk fat percentage and milk yield that related to forage PS, also they observe that the improvement was inconsistent with chewing activity. In agreement with our results, Kononoff et al. (2003) observe increasing milk fat with constant chewing time, where it explained that to the acetate-to-propionate ratio and long chain trans fatty acids that control milk fat synthesis. Ramirez, et al. (2012) concluded that feeding DDGS lowered lower milk fat production, because of high ruminal fermentation of it and high amount of unsaturated fatty acids.
Conclusion
From the results of this trial, our conclusion is that DM intake, ruminal characteristics, chewing activity, and lactation performance affected by amount of NFC or soluble carbohydrate that have variant digestibility from different sources, besides we recommend the combination of all of treatment for better performance.
REFERENCES
Abdelqader MM, Hippen AR, Kalscheur KF, Schingoethe DJ, Garcia AD 2009. Isolipidic additions of fat from corn
germ, corn distillers grains, or corn oil in dairy cow diets.
J. Dairy Sci., 92: 5523-5533.
Allen MS 2000. Effects of diet on short-term regulation of
feed intake by lactating dairy cattle. J Dairy Sci. 83:1598–
1624.
included at two concentrations in the diets of lactating dairy
cows. J. Dairy Sci. 89: 3133_3142.
Association of Official Analytical Chemists (AOAC) 2002. Official Methods of Analysis, Volume 1. 17th edition. Arlington, VA:1–75.
Bauman DE, Perfield JW, Harvatine KJ, Baumgard LH 2008. Regulation of fat synthesis by conjugated linoleic acid:
Lactation and the ruminant model. J. Nutr. 138: 403_409.
Baumgard LH, Corl BA, Dwyer DA, Saebø A, Bauman DE 2000. Identification of the conjugated linoleic acid isomer
that inhibits milk fat synthesis. Am. J. Physiol. Regul.
Integr. Comp. Physiol. 278: R179_R184.
Belyea RL, Rausch KD, Clevenger TE, Singh V, Johnston DB, Tumbleson ME 2010. Sources of variation in composition
of DDGS. Anim. Feed Sci. Tech. 159: 122_130.
Broderick GA, Luchini ND, Radloff WJ, Varga GA, Ishler VA 2002. Effect of replacing dietary starch with sucrose on milk production in lactating dairy cows. U.S: Dairy Forage Research Center 2000–2001 Research Report; 116–118. Chester-Jones H, Stern MD, Metwally HM, Linn JG, Ziegler
DM 1991. Effects of dietary protein-energy
interrelationships on Holstein steer performance and ruminal bacterial fermentation in continuous culture. J Anim Sci, 69:4956–4966. 69.
DePeters EJ, Fadel JG, Arosemena A. 1991. Digestion kinetics of neutral detergent fiber and chemical composition within some selected by-product feedstuffs. Anim Feed Sci Technol 1991, 67:127–140.
Esmaeili M,Khorvash M, Ghorbani GR, Nasrollahi SM, Saebi M 2016.Variation of TMR particle size and physical characteristics in commercial Iranian Holstein dairies and effects on eating behaviour, chewing activity, and milk production Livestock Science, 191: 22–28
Friggens NC, Emmans GC, Robertson S, Chamberlain DG, Whittemore CT, Oldham JD 1995. The lactational responses of dairy cows to the amount of feed and to the
source of carbohydrate energy. J Dairy Sci, 78:1734–1744.
Gehman AM, Kononoff PJ 2010. Utilization of nitrogen in cows consuming wet distillers grains with solubles in
alfalfa and corn silage-based diets dairy rations. J. Dairy
Sci. 93: 3166_3175.
Grant RJ: Interactions among forages and non-forage fiber sources. J Dairy Sci 1997, 80:1438–1446.
Hall MB, Hoover WH, Jennings JP, Webster TKM 1999. A
method for partitioning neutral detergent-soluble
carbohydrates. J Sci Food Agric, 79:2079–2086.
Hippen AR, Schingoethe DJ, Kalscheur KF, Linke PL,
Rennich DR, Abdelqader MM, Yoon I. 2010.
Saccharomyces cerevisiae fermentation product in dairy
cow diets containing dried distillers grains plus solubles. J.
Dairy Sci. 93: 2661_2669.
Huhtanen, P. 1987. The effect of dietary inclusion of barley, unmolassed sugar beet pulp and molasses on milk production, digestibility and digesta passage in dairy cows
given silage based diet. J Sci Food Agric, 59:l01–111.
Janicek BN, Kononoff PJ, Gehman AM, Doane PH. 2008. The effect of feeding dried distillers grains plussoluble on milk
production and excretion of urinary purine derivatives. J.
Dairy Sci. 91: 3544-3553.
Kononoff PJ 2002. The effect of ration particle size on dairy cows in early lactation, Ph.D. Thesis. The Pennsylvania State Univ: Department of Animal Sci.
Kononoff PJ, Heinrichs AJ, Buckmaster DR 2003. Modification of the Penn State forage and total mixed
ration particle separator and the effects of moisture content
on its measurements. J. Dairy Sci., 86:1858-1863.
Larson CC 2003. The effects of non-fiber carbohydrate sources and protein degrad-ability on performance of Holstein cows, Ph.D. Thesis. University of Florida: Department of Animal Sci.
Lees JA, Oldham ID, Haresign W, Gamsworthy PC. 1990. The effect of patterns of rumen fermentation on the response by
dairy cows to dietary protein concentration. Br J Nutr,
63:177–187.
Leiva E, Hall MB, Van Horn HH 2000. Performance of dairy cattle fed citrus pulp or corn products as sources of neutral
detergent-soluble carbohydrates. J Dairy Sci., 83:2866–
2875.
Mansfield HR, Stern MD, Otterby DE 1994. Effects of beet pulp and animal by-products on milk yield and in vitro
fermentation by rumen microorganisms. J Dairy Sci.,
77:205–216.
Merchen NR, Firkins JL, Berger LL 1986. Effect of intake and forage level on ruminal turnover rates, bacterial protein
synthesis and duodenal amino acid flows in sheep. J Anim
Sci, 62:216–224.
Mertens DR 1997.Creating a system for meeting the fiber
requirements of dairy cows. J.Dairy Sci. 80,1463–1481.
Mjoun K., Kalscheur KF, Hippen AR, Schingoethe DJ 2010. Ruminal degradability and intestinal digestibility of protein and amino acids in soybean and corn distillers grains products. J. Dairy Sci. 93: 4144_4154.
National Research Council (NRC) 2001. Nutrient
Requirements of Dairy Cattle, 7th rev. Washington, DC: Natl. Acad. Sci.
Peterson DG, Matitashvili EA, Bauman DE 2003. Diet-induced milk fat depression in dairy cows results in increased trans-10, cis-12 CLA in milk fat and coordinate suppression of mRNA abundance in mammary enzymes
involved in milk fat synthesis. J. Nutr. 133: 3098_3102.
Poorkasegaran S, Yansari AT 2014. Effects of different sources of carbohydrates on intake, digestibility, chewing,
and performance of Holstein dairy cows. Journal of Animal
Science and Biotechnology, 5:6.
Ramirez HAR, Nestor K., Tedeschi LO, Callaway TR, Dowd SE, Fernando SC, Kononoff PJ 2012. The effect of brown midrib corn silage and dried distillers’ grains with solubles on milk production, nitrogen utilization and microbial
community structure in dairy cows. Can. J. Anim. Sci. 92:
365-380.
Ranathunga SD, Kalscheur KF, Hippen AR, Schingoethe DJ 2010. Replacement of starch from corn with nonforage fiber from distillers grains and soyhulls in diets of lactating
dairy cows. J. Dairy Sci. 93: 1086_1097.
Rius AG, Appuhamy JA D R N, Cyriac J, Kirovski D, Becvar O, Escobar J, McGilliard ML, Bequette B J, Akers RM, Hanigan M D 2010. Regulation of protein synthesis in mammary glands of lactating dairy cows by starch and
amino acids J. Dairy Sci. 93: 3114_3127.
Rooke JA, Rymer C, Maya FM, Armstrong DG 1992. Effect of including barley or molassed sugar beet feed in grass
silage diets on their digestion by cattle and sheep. J Sci
Food Agric, 48:475–489.
Schingoethe DJ, Kalscheur KF, Hippen AR, Garcia AD 2009. Invited review: The use of distiller’s products in dairy
cattle diets J. Dairy Sci. 92: 5802_5813.
Shingfield KJ, Griinari JM 2007. Role of biohydrogenation
intermediates in milk fat depression. Eur. J. Lipid. Sci.
Tafaj M, Zebeli Q, Baes C, Steingass H, Drochner W. 2007. A meta-analysis examining effects of particle size of total mixed rations on intake, rumen digestion and milk production in high yielding dairy cows in early lactation.
Anim Feed Sci Technol, 138:137–161.
Teimouri Yansari A, Primohammadi R. 2009. Effect of particle size of alfalfa hay and reconstitution with water on intake, digestion, and milk production in Holstein dairy cows. Animal, 3:218–227.
Torrent J, Johnson DE, Kujawa MA 1994. Co-product fiber
digestibility: kinetic and in vivo assessment. J Anim Sci,
72:790–795.
Valk H, KleinPoelhuis HW, Wentink HJ. 1990. Effects of fibrous and starchy carbohydrates in concentrates as supplements in a herbage-based diet for high yielding dairy cows. Neth J Agric Sci, 38:475–486.
Van Soest PJ, Robertson JB, Lewis BA 1991. Methods for dietary fiber, neutral detergent fiber, and non-starch
polysaccharide in relation to animal nutrition. J Dairy Sci,
74:3583–3597.
Van Vuuren AM, Van Der Koelen CJ, Vroons-De Bruin J 1993. Ryegrass versus corn starch or beet pulp fiber diet effects of digestion and intestinal amino acids in dairy
cows. J Dairy Sci., 76:2692–2700.
Varga AG 2003. Soluble carbohydrates for lactating dairy cows, Proceeding of Tri-State Dairy Nutrition Conference. Columbus: The Ohio State University, 59–73.
Yang WZ, Beauchemin K.A 2007. Altering physically effective fiber intake through forage proportion and particle
length: chewing and ruminal pH. J. Dairy Sci., 90,2826–
2838.