INTRODUCTION
Hypoxia is a frequently occurring environmental phenomenon in many freshwater and coastal systems, and can be caused by either anthropogenic input, or naturally occurring biological and physical factors (Rosenberg et al., 1991; Pihl et al., 1992; Hoback and Barnhart, 1996; Wu, 1999). Recent studies show that hypoxia in marine waters is not restricted to localized areas, but is more extensive and longer-lasting (weeks to months) than previously thought (Diaz and Rosenberg, 1995; Wu, 1999; Weeks et al., 2002; Bell and Eggleston, 2005; Gilbert et al., 2005). This can create inhospitable habitats for fish and sedentary animals (Wu, 2002), and severe oxygen depletion of coastal waters has significant negative consequences for economically important fisheries, ecosystems and biodiversity (UN Global Environment Outlook Year Book, 2003). These problems become even more serious if large areas are affected by hypoxia for an extended time, as fish may not be able to leave these areas; avoidance being the predominant reaction to hypoxia (Pihl et al., 1991; Claireaux et al., 1995).
Locomotor performance is determined by the interaction of many organ systems, and is considered to be an integrated measure of an animal’s physiological capacity in a particular environment (Nelson, 1989). Thus, measuring the locomotor performance of fishes could provide valuable information on their physiological response to hypoxia. Furthermore, cardiorespiratory adjustments are a prerequisite for vital functions (e.g. locomotion, digestion) and for appropriate responses to environmental changes (Farrell, 2002;
Claireaux et al., 2005; Gollock et al., 2006; Clark and Seymour, 2006; Steinhausen et al., 2008), and an understanding of how chronic hypoxia affects both swimming performance and cardiovascular function could reveal important information about whether fish will survive, and how well they adapt to, hypoxic environments. At present, studies on the effects of chronic (weeks of) hypoxia have been conducted on a limited number of teleost species, and focused on a range of aspects such as food intake (Chabot and Dutil, 1999; Pichavant et al., 2000; Pichavant et al., 2001; Zhou et al., 2001), reproduction (Wu et al., 2003), oxygen carrying capacity (Greaney et al., 1980; Taylor and Miller, 2001; Pichavant et al., 2003), cardiomyocyte physiology (Lennard and Huddart, 1992; Paajanen and Vornanen, 2003) and circulating catecholamine levels (Butler et al., 1979; Montpetit and Perry, 1998). However, to our knowledge only two studies (Kutty, 1968; Bushnell et al., 1984) have investigated how chronic hypoxia affects fish swimming performance and metabolism, and only one study (Burleson et al., 2002) has examined the effect of chronic hypoxia on fish in vivo cardiovascular function. Furthermore, this lack of information is surprising given that: (1) acute exposure to reduced oxygen levels decreases metabolic scope (Claireaux et al., 2000; Evans, 2007) and swimming performance (Dahlberg et al., 1968; Kutty, 1968; Bushnell et al., 1984; Dutil et al., 2007); and (2) hypoxia induces bradycardia in many species, and stroke volume must increase if the fish is to maintain or elevate cardiac output (Saunders, 1963; Wood and Shelton, 1980; Fritsche and Nilsson, 1989; Gamperl et
The Journal of Experimental Biology 213, 808-819 © 2010. Published by The Company of Biologists Ltd doi:10.1242/jeb.033746
Effect of acute and chronic hypoxia on the swimming performance, metabolic
capacity and cardiac function of Atlantic cod (Gadus morhua)
L. H. Petersen* and A. K. Gamperl
†Ocean Sciences Centre, Memorial University of Newfoundland, St John’s, NL, Canada, A1C 5S7
*Present address: Institute of Applied Science, University of North Texas, 1125 Union Circle, PO Box 310559, Denton, TX 76203, USA
†Author for correspondence ([email protected])
Accepted 23 November 2009
SUMMARY
Low water oxygen content (hypoxia) is a common feature of many freshwater and marine environments. However, we have a poor understanding of the degree to which diminished cardiac function contributes to the reduction in fish swimming performance concomitant with acute exposure to hypoxia, or how fish cardiorespiratory physiology is altered by, or adapts to, chronic hypoxia. Thus, we acclimated adult Atlantic cod (Gadus morhua) to either ~8–9kPa O2 (40–45% air saturation) or ~21kPaO2(100% air
saturation; normoxia) for 6–12weeks at 10°C, and subsequently measured metabolic variables [routine oxygen consumption (MO2), maximum MO2, metabolic scope] and cardiac function (cardiac output, Q; heart rate, fH; and stroke volume, VS) in these fish
during critical swimming speed (Ucrit) tests performed at both levels of water oxygenation. Although surgery (flow probe
implantation) reduced the Ucritof normoxia-acclimated cod by 14% (from 1.74 to 1.50BLs–1) under normoxic conditions, exposure
to acute hypoxia lowered the Ucrit of both groups (surgery and non-surgery) by ~30% (to 1.23 and 1.02BLs–1, respectively). This
reduction in swimming performance was associated with large decreases in maximum MO2 and metabolic scope (≥50%), and maximum fH and Q(by 16 and 22%), but not VS. Long-term acclimation to hypoxia resulted in a significant elevation in normoxic
metabolic rate as compared with normoxia-acclimated fish (by 27%), but did not influence normoxic or hypoxic values for Ucrit,
maximum MO2or metabolic scope. This was surprising given that resting and maximum values for Qwere significantly lower in hypoxia-acclimated cod at both levels of oxygenation, because of lower values for VS. However, hypoxia-acclimated cod were able
to consume more oxygen for a given cardiac output. These results provide important insights into how fish cardiorespiratory physiology is impacted by short-term and prolonged exposure to hypoxia, and further highlight the tremendous capacity of the fish cardiorespiratory system to deal with environmental challenges.
al., 1994; Sandblom and Axelsson, 2005; Sandblom and Axelsson, 2006).
The Atlantic cod (Gadus morhuaL.) is a demersal North Atlantic species of significant economic and cultural importance that has experienced dramatic population declines over the past several decades (Myers et al., 1996; Svedäng and Bardon, 2003; Hutchings and Reynolds, 2004). Further, this species has traditionally inhabited areas, such as the Baltic Sea (Gerlach, 1988) and the Gulf of St Lawrence (GSL) (D’Amours, 1993; Kiceniuk and Colbourne, 1997; Gilbert et al., 2005), where they are now likely to encounter environmental oxygen levels that may strongly affect their distribution, growth and reproduction, at least during part of their life history. For example, GSL cod are sensitive to hypoxia (D’Amours, 1993), completely avoid regions of water oxygen partial pressures (PwO2) below a threshold of ~6.6kPa (Kiceniuk and Colbourne, 1997), and there are thus areas in the GSL that are below the threshold for survival (Plante et al., 1998; Gilbert et al., 2005). Given the expanding threat of hypoxia for marine organisms including cod (Breitburg, 2002; Neuenfeldt, 2002; Wu et al., 2002; Gilbert et al., 2005), and our incomplete understanding of fish physiology when exposed to low oxygen conditions, the main goal of the present study was to determine whether Atlantic cod are able to adapt to chronic hypoxia. Thus, we acclimated adult Newfoundland cod to water oxygen levels (PwO2) of 8–9kPa (hypoxia) and 21kPa (normoxia) for 6–12 weeks, fitted them with Transonic®flow probes around their ventral aorta, and measured cardiac function and oxygen consumption during critical swimming speed (Ucrit) tests conducted at both water oxygen levels.
MATERIALS AND METHODS
These studies were conducted in accordance with the guidelines of the Canadian Council on Animal Care, and approved by the Institutional Animal Care Committee of Memorial University of Newfoundland (Protocol # 05-03-KG).
Experimental animals
Experiments were performed on adult (0.62±0.03kg; range0.43–0.78kg; N31) Atlantic cod at the Ocean Sciences Centre (OSC; Memorial University, St John’s, Newfoundland, Canada). Cod were obtained from stocks reared at the OSC’s Aquaculture Research and Development Facility (ARDF), and subsequently held in sea cages at Hermitage Bay (Newfoundland, Canada) for approximately 18months before being transported back to the OSC. At the OSC, the cod were originally held in a 12,000l tank supplied with aerated seawater at 10°C for at least 2months prior to being moved to acclimation tanks. During this period, the fish were fed a commercial cod diet (EWOS, Canada) three times a week, and photoperiod was maintained at 12h:12h light:dark.
Experimental conditions
Acclimation to normoxia
Prior to experiments, 20 fish from the holding tank were acclimated at a PwO2 of 21kPa for 6–12weeks at 10±0.1°C in two ~1300l tanks, each supplied with aerated seawater from a header tank at a flow-rate of ~6-8lmin–1. The header tank was fitted with two submersible heaters (Process Technology, OH, USA; model NA15E-2) and connected to a separate heater/chiller (custom built by Technical Services, Memorial University of Newfoundland). Furthermore, a wooden lid was placed on the tank to reduce stress from external stimuli (presence of people, noise, etc.) and to reduce fluctuations in water temperature. The normoxia acclimation tank was fully aerated to ensure normoxic conditions (>20kPa), and fish
were fed three times a week with commercial cod pellets at a ration equal to that consumed by the hypoxic group.
Acclimation to hypoxia
The hypoxia acclimation tank was supplied with ambient seawater from its own header tank, and fitted with a wooden lid to reduce noise and fluctuations in water temperature, and to reduce the exchange of oxygen with the atmosphere. Temperature in the hypoxic tank was controlled by a small submersible rod-type heater (Process Technology; model DRAE15-1) fitted on the lid and by circulating water in the tank through a custom built heater/chiller (Technical Services, Memorial University of Newfoundland). These two systems were sufficient to maintain water temperature at 10±0.1°C.
Twenty fish were transferred from the holding tank to the hypoxia acclimation tank and held under normoxic conditions (>20kPa) for 1week before the oxygen level was reduced. A hypoxia level of ~8kPa (~40% air saturation) was achieved over the time course of 1week by: (1) slowly reducing the flow rate to the tank to 1–2lmin–1 (i.e. fish metabolism partially reduced the water O2content); and (2) using a custom designed solenoid valve system (Electronics Workshop, Memorial University of Newfoundland). This system continuously monitored the oxygen level in the tank by pumping water through an external circuit of tubing (Tygon Food, ser. 6-419, Cole Parmer, Montreal, QC, Canada) that contained a galvanic oxygen electrode (model CellOx 325, WTW, Weilheim, Germany) housed in a D201 flow cell (WTW). Further, the oxygen probe was connected to an oxygen meter (model Oxi 340, WTW), which was subsequently connected to two solenoid valves; one that bubbled pure N2into the tank when O2 reached an upper limit of 9kPa, and the other bubbled air into the tank when oxygen levels reached 7kPa. This design allowed the oxygen level in the hypoxic tank to be kept within a narrow O2 range (±1kPa), and together with the reduced water flow, proved to be highly efficient in maintaining appropriate O2 levels; average O2 level 8.6±0.2kPa over the 6–12week acclimation period.
Fish were fed three times a week with commercial cod pellets, and most fish were feeding from the first day of reaching 8–9kPa; average food consumption over the period of acclimation 1.4%bodymassday–1. To avoid the build up of carbon dioxide and nitrogen that may have affected the hypoxic fish, we tested water quality (total nitrogen, un-ionized ammonia, PCO2and pH) in the hypoxic tank once a week throughout acclimation.
Surgical procedures
With the exception of the ‘non-surgery’ group, the fish were netted and anaesthetized in seawater containing tricaine methane sulphonate (MS-222; 0.1gl–1) until ventilatory movements ceased. Then the fish were weighed and measured before being transferred to an operating table where chilled (4°C) oxygenated seawater, containing a lower dose of MS-222 (0.05gl–1), was continuously pumped over the fish’s gills.
Once surgery had been completed, the fish were transferred to the swim-tunnel, and all fish commenced ventilation within <2min. The water velocity in the swim-tunnel was set at 0.25body lengths per second (BLs–1; a velocity at which the fish did not swim actively, but had no trouble orienting themselves), and all fish were allowed at least 18h of recovery in normoxic water prior to the first swim trial.
Critical swimming speed tests
Critical swimming speed (Ucrit) tests were performed in a 81l Blazka-type swim-tunnel respirometer (University of Waterloo, Biotelemetry Institute, Waterloo, ON, USA) with an internal diameter of 25cm and a 90cm long working section. The front of the respirometer was fitted with a plastic grid, which created uniform water flow in the swimming section of the respirometer (Taylor and McPhail, 1985), and the rear of the tunnel was fitted with a stainless steel grid connected to an external electrical circuit. This stainless steel grid could be electrified with a small current (<5V, ~0.2A) to discourage the fish from resting on the grid during swimming trials. Furthermore, the tunnel was covered with black plastic to provide the fish with a dark refuge, and to minimize stress from external stimuli (i.e. investigator’s presence).
Water (21 or 8–9kPa) was supplied to the swim-tunnel from a temperature-controlled 270l water reservoir that was maintained at 10±0.1°C using a heater/chiller (Memorial University of Newfoundland, Technical Services). The O2 content of the water was controlled by bubbling pure N2 into the reservoir at rates predetermined to achieve the desired O2level.
Experimental protocol
Resting and active oxygen consumption and cardiac function, and swimming performance, of individual fish were initially measured under normoxic conditions using a critical swimming speed test (Brett, 1964). After measuring cardiac function and oxygen consumption (see below) at the baseline speed of 0.25BLs–1, swimming speed was increased in 0.125BLs–1increments every 20min until the fish were exhausted; exhaustion was determined as the inability of the fish to move away from the electric grid after three successive mild (5V) shocks. Thereafter, water velocity was returned to 0.25BLs–1and the fish left overnight to recover. During the morning of the second day, the oxygen level in the tunnel was reduced over a period of 3h by bubbling pure N2 into the reservoir to reduce the oxygen level in the tunnel to 16kPa in the first hour, 12kPa in the second hour, and 8–9kPa by the end of the third hour. The oxygen level in the swim-tunnel was then maintained at 8–9kPa for 1h before the hypoxic Ucrittrial was performed. The hypoxic
Ucrittrial was identical to that performed during normoxia, and fish swum under hypoxic conditions were also allowed to recover under normoxic conditions; water PwO2increased from 8–9kPa to ~19kPa during the first 20min of recovery. Fish swum under hypoxic conditions (PwO28–9kPa) were not recovered at this oxygen level because preliminary experiments on normoxia-acclimated fish showed that some individuals were having trouble righting themselves or swimming constantly even more than 2h post-exercise. This is also the main reason that the fish were swum in the same order; normoxia, then hypoxia.
For both normoxic and hypoxic swim trials, Ucrit was calculated as:
Ucrit=v+ tf ti ⎛ ⎝⎜
⎞
⎠⎟×vi
⎛ ⎝⎜
⎞
⎠⎟ , (1)
where vis the highest velocity at which the fish swam for the entire time increment (BLs–1); v
iis velocity increment (BLs–1); tfis time elapsed from the last change in current velocity to fatigue (min); and tiis time increment, the time between step increases in velocity (20min).
Measurements of cardiac function and metabolism
Cardiac output (Q) was continuously measured during the Ucrittrial and for ~2h after the fish became exhausted [i.e. measurements were taken immediately after the fish stopped swimming (0 min), and at 25min, 50min, 75min, 100min and 125min of recovery]. Qwas measured by connecting the flow meter to a MP100A-CE data acquisition system and a laptop running AcqKnowledge software (BIOPAC Systems Inc., Santa Barbara, CA, USA). Data were recorded at a frequency of 20Hz, and values of cardiac output were obtained during the last 5min at each swimming speed and during the first 5min of each 25min period during recovery. Cardiac output (Q, in mlmin–1kg–1) was calculated by dividing the raw data (mlmin–1) by the mass of the fish (kg). Heart rate (ƒ
H; beatsmin–1) was calculated by measuring the time required for 20 systolic peaks, and multiplying this value by 60 divided by the measurement period (s). Stroke volume (VS;mlkg–1) was calculated as Q/fH. Maximum values of Q, VSand fHwere measured as the highest value that each individual fish achieved. Finally, the absolute scope for cardiac variables (Q, VS and fH) was calculated by subtracting routine (resting) values from maximum values.
Water temperature and oxygen concentration (mgO2l–1) in the swim tunnel were continuously measured via an external circuit containing an oxygen probe housed in a D201 flow through cell (see description for the hypoxia acclimation tank). Oxygen consumption (MO2) of the cod was measured over 10min intervals at rest, at each swimming speed, and at 0, 25, 50, 75, 100 and 125min of recovery by stopping the flow of water into the swim-tunnel, recording the drop in water-oxygen concentration in the swim-tunnel, and using the following equation (Cech, 1990):
where Ciis water oxygen concentration (mgO2l–1) at the start of
MO2measurement; Cfis oxygen concentration (mgO2l–1) at the end of MO2measurement; Vcis volume of the respirometer and external circuit (81l); Mis fish mass (kg); and tis time required to make
MO2measurement (10min). Note that water oxygen concentration only dropped by ~0.1–0.3mgl–1over the measurement period.
Standard oxygen consumption was obtained from a semi-log plot of swimming speed (BLs–1) vslog M
O2, and using the derived linear regression to extrapolate back to 0BLs–1. Maximum oxygen consumption (MO2max) was measured as the highest oxygen consumption that each individual fish achieved, and absolute metabolic scope was then calculated by subtracting routine (that of fish resting quietly in the tunnel) MO2from MO2max. Finally, each fish’s total excess post-exercise oxygen consumption (EPOC; in mgO2kg–1; a measure of the non-aerobic cost of exercise) was obtained by integrating the area underneath the MO2–time curve until
MO2returned to routine values (see Lee et al., 2003).
The routine metabolic rate of fishes, including cod, scales allometrically with body mass with a slope of ~0.8–0.85 (Saunders, 1963; Post and Lee, 1996; Killen et al., 2007). However, isometrically scaled metabolic rate data (i.e.mgO2h–1kg–1) are reported, because to our knowledge no metabolic scaling exponents have been reported for fish cardiovascular function, and we wanted to report all the variables using common units. Furthermore, the
range of mass of the fish used was small, and thus the error in using isometric units would be minimal. However, we do provide allometrically scaled metabolic rates in the discussion when comparing our data with the literature.
Effect of surgery on swimming performance and metabolism
We did not want to give the hypoxic fish an extended period of exposure to normoxic water prior to the initial Ucrittest. However, we were also cognisant of the fact that surgery and/or the post-surgical recovery period can potentially affect swimming and cardiovascular performance (e.g. Butler et al., 1989; Campbell et al., 2004) [also see figure7 in Webber et al. (Webber et al., 1998)]. Thus, normoxic and hypoxic swim trials were also performed on nine (0.55±0.03kg) normoxia-acclimated cod that did not undergo surgery or anaesthesia (non-surgery group). These fish were placed directly in the swim tunnel after being netted from their acclimation tank and allowed ~18h to recover.
Statistical analyses
A one-way ANOVA was used to examine whether fish mass, length and condition factor were affected by chronic acclimation to hypoxic conditions (Table1). Two-way ANOVAs with repeated measures were used to determine at which swimming speeds or times during recovery MO2and cardiovascular variables were different between: (1) surgery vs non-surgery groups (Fig.1); and (2) normoxia- vs hypoxia-acclimated cod (Fig.2). This analysis was also used to determine at which values of water O2 saturation variables were different between normoxia- and hypoxia-acclimated cod during the step-down period (Fig.3). Furthermore, Dunnett’s post-hoctests were performed to examine if/when variables became different from values at 100% air saturation (Fig.3). Two-way ANOVAs with repeated measures, followed by paired (normoxic vshypoxic swim) or unpaired (normoxia- vshypoxia-acclimated or surgery vsnon-surgery) t-tests were used to identify differences in metabolic and cardiovascular variables (see Tables 2 and 3). Finally Pearson’s correlation analysis was carried out to define the strength of the relationship between oxygen consumption and cardiac output during the normoxic and hypoxic swims and graded hypoxia
(Fig.4). All data presented in figures, tables and the text are means ± standard error (s.e.m.). Statistical analyses were carried out using SPSS (v.13.0; SPSS, Chicago, IL, USA) and a difference was considered significant when P<0.05.
RESULTS
Water quality in the hypoxic tank did not deteriorate during the 6–12weeks of acclimation to hypoxia. Mean values (N10–12) for total nitrogen, un-ionized ammonia, carbon dioxide and pH were 0.03±0.01 p.p.m.: 0.0003±0.0 p.p.m., 2.3±0.6p.p.m. and 7.8±0.1, respectively. Further, although the mass of hypoxia-acclimated cod was ~15% lower as compared with those held under normoxic conditions, neither this variable or condition factor were significantly different between the two groups (Table1).
Effects of anaesthesia and surgery
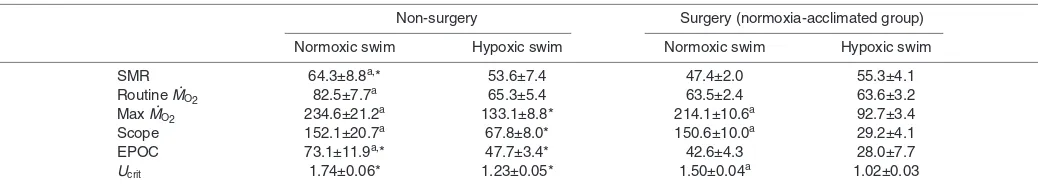
Surgery resulted in a 14% decrease in the normoxic Ucrit value (from 1.74 to 1.50BLs–1). However, the effect of surgery was similar when the fish were swum under hypoxia (17% decrease), and as a result, the reduction in Ucritbetween normoxic and hypoxic conditions was similar for both groups (non-surgery, 29%; surgery, 32%; Table2). This pattern of change in swimming performance was not reflected by most metabolic variables: (1) cod fitted with flow probes had significantly lower routine and standard metabolic rates (by ~25%) when measured under normoxic conditions; (2) surgery had no significant effect on normoxic values of MO2max
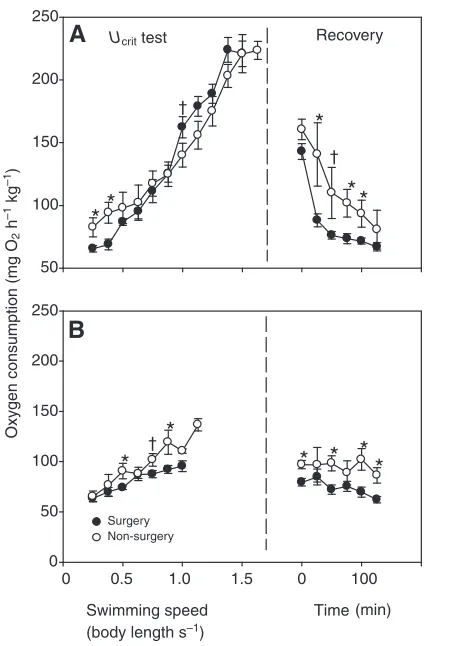
or metabolic scope; and (3) MO2maxand metabolic scope decreased to a much greater extent in the surgery group compared with the non-surgery group when they were swum at 8–9kPa (57% vs43% and 80% vs55%, respectively; Table2, Fig.1). Finally, EPOC was significantly (P<0.05) lower in the surgery group when swum under normoxia and hypoxia (by 42% and 46%, respectively; Table2).
Normoxic Ucrittest
[image:4.612.43.570.80.144.2]In normoxic water, routine ƒH, VS, Q and MO2 averaged 32.9±2.2beatsmin–1, 0.73±0.07mlkg–1, 23.1±1.8mlmin–1kg–1and 63.5±2.4mgO2h–1kg–1, respectively for the 10 normoxia-acclimated
Table 1. Physical characteristics of the Atlantic cod used in the various experiments
Treatment
No surgery Normoxia-acclimated Hypoxia-acclimated
Mass (kg) 0.55±0.03* 0.68±0.03 0.57±0.04
Length (cm) 39.7±0.8 41.9±0.9 40.4±0.8
Condition factor (K) 0.90±0.04 0.94±0.03 0.86±0.03
*Significant difference between non-surgery and normoxia-acclimated groups. N9, 10 and 12 for the three groups. Values are means±s.e.m.
Table 2. The effect of surgery and anaesthesia on swimming performance and oxygen consumption of Atlantic cod measured under normoxia (PwO2~20kPa) and hypoxia (PwO2~8–9kPa)
Non-surgery Surgery (normoxia-acclimated group)
Normoxic swim Hypoxic swim Normoxic swim Hypoxic swim
SMR 64.3±8.8a,* 53.6±7.4 47.4±2.0 55.3±4.1
Routine MO2 82.5±7.7a 65.3±5.4 63.5±2.4 63.6±3.2
Max MO2 234.6±21.2a 133.1±8.8* 214.1±10.6a 92.7±3.4
Scope 152.1±20.7a 67.8±8.0* 150.6±10.0a 29.2±4.1
EPOC 73.1±11.9a,* 47.7±3.4* 42.6±4.3 28.0±7.7
Ucrit 1.74±0.06* 1.23±0.05* 1.50±0.04a 1.02±0.03
[image:4.612.47.566.629.721.2]fish (Fig.2, Table3). Although resting ƒHwas similar in hypoxia-acclimated cod (also N10), MO2was significantly higher (by 40%) in this group, despite the fact that both Qand VS were significantly lower (by 26% and 30%, respectively).
During the normoxic Ucrit test, MO2 and all cardiovascular variables increased with swimming speed, and differences between normoxia- and hypoxia-acclimated cod were generally retained (Fig.2, Table3). For example, standard metabolic rate (SMR) was
30% higher in the hypoxia-acclimated group (68 vs
47mgO2h–1kg–1), and there were no differences in the scope for
MO2 (~150mgO2h–1kg–1) or any of the cardiac variables (ƒH, ~14beatsmin–1; V
S, ~0.25mlkg–1; Q, 17 vs 21mlmin–1kg–1). However, there were some notable differences. First, ƒH became significant elevated in the hypoxia-acclimated group, as compared with normoxia-acclimated fish, at swimming speeds between 1.0 and 1.38BLs–1. Second, although M
O2, ƒH, VS and Q generally increased in normoxia-acclimated fish until exhaustion, these variables either plateaued or decreased slightly in hypoxia-acclimated fish after 1.25BLs–1. Given that there were no differences
0 50 100 150 200 250 Oxygen con su
mption (mg O
2 h –1 kg –1 ) 50 100 150 200 250 Surgery Non-surgery
0 0.5 1.0 1.5 0 100 Recovery
*
A
B
*
*
†*
†*
*
†*
* * * *
Swimming speed Time (body length s–1)
(min)
[image:5.612.335.563.64.387.2]Ucrit test
Table 3. Metabolic and cardiac variables, and swimming performance, in normoxia- and hypoxia-acclimated Atlantic cod subjected
to critical swimming speed (
Ucrit
) tests under both
normoxic ( P wO 2 ~20
kPa) and hypoxic (
P wO 2 ~8–9 kPa) conditions Normoxia-acclimated Hypoxia-acclimated Normoxic swim Hypoxic swim Normoxic swim Hypoxic swim MO 2 fH VS QM O2 fH VS QM O2 fH VS QM O2 fH VS Q Routine 63.5*±2.4 32.9±2.2 0.73*±0.07 23.1*±1.8 63.6±3.2 33.0±1.7 0.73*±0.04 23.2±0.9 80.9 a±3.4 35.2±1.9 0.49 a±0.04 17.0±1.1 72.0±4.3 35.9±2.4 0.56±0.04 19.8±1.5 Max 214.1 a±10.6 46.3 a±0.9 0.99*±0.07 44.5 a,*±2.7 92.7±3.4 38.8*±1.5 0.99*±0.06 34.6±1.7 231.4 a±12.3 50.1±0.8 0.74±0.04 34.2±2.2 100.6±5.1 48.5±3.0 0.71±0.04 31.3±1.8 Scope 150.6 a±10.0 13.4 a±1.9 0.26±0.04 21.5 a±2.2 29.2±4.1 5.8*±1.0 0.27*±0.04 11.4±1.5 150.6 a±12.5 14.9±2.0 0.25 a±0.03 17.3 a±1.9 28.6±2.8 12.6±1.3 0.15±0.03 11.5±1.8 SMR 47.4*±2.0 – – – 55.3±4.1 – – – 68.3±4.0 – – – 63.2±4.1 – – – EPOC 42.6±4.3 – – – 28.0±7.7 – – – 33.0±6.8 – – – 22.3±3.9 – – – Ucrit 1.50 a±0.04 1.02±0.03 1.51 a±0.07 1.02±0.05 MO 2 ,
oxygen consumption (mg
O2 h –1 kg –1 ); fH
, heart rate (beats
min
–1
);
VS
, stroke volume (ml
kg –1 ); Q ,
cardiac output (ml min
–1 kg –1 ) and Ucrit (BL s –1
). Routine refers to values measured at rest (0.25
BL s –1 ).
SMR (standard metabolic rate) was obtained by plotting log
MO
2
of individual fish against swimming speed and extrapolating to 0
BL
s
–1
. EPOC (excess post-exercise oxygen consumption). Values are
means±s.e.m.,
N
10 for both groups.
aA significant difference between normoxic and hypoxic swims within each acclimation condition. *A significant difference betwee
n groups (normoxia-
vs
hypoxia-acclimation) within a particular test condition.
Fig.1. The effect of anaesthesia and surgery (Transonic®flow probe placement around ventral aorta) on the oxygen consumption of cod during normoxic (A) and hypoxic (B; PwO28–9kPa) critical swimming speed tests, and during post-exercise recovery. Non-surgery fish were netted from their holding tank, and placed directly into the swim-tunnel respirometer. All fish were swum in normoxic water on day1 and hypoxic water on day2, but recovery was performed in normoxic water for all swims. N9 for non-surgery fish, and N10 for fish that underwent surgery. *Significant differences between non-surgery and surgery groups at P<0.05;
[image:5.612.101.251.69.755.2]in metabolic scope or the scope for cardiac variables, it was not surprising that Ucrit(~1.5BLs–1) was identical in the two groups.
During recovery from the Ucrit test, MO2 fell rapidly in both groups, and there was no significant difference in EPOC (P0.31; Table3), although it was 30% higher in the normoxia-acclimated group. Interestingly, the post-exercise pattern of change for ƒHwas different than for Qand VS. The ƒHfell slowly after the cod were exhausted, whereas both Q and VSdecreased rapidly (i.e. within 25min) to values comparable to, or below, routine levels and then rebounded (Fig.2).
Graded hypoxia and the hypoxic Ucrit test
At the start of the second day (i.e. at PwO221kPa; Fig.3) MO2and values for cardiac function were very similar to those measured at
the beginning of day 1 (i.e. prior to the normoxic Ucrittest, Fig.2), and the differences between groups were maintained. For example, routine MO2was slightly (by ~10%) higher, and Qand VS were again significantly lower (by ~22 and 30%, respectively), in the hypoxia-acclimated group (Fig.3). There were very few changes in MO2or cardiovascular variables as water O2partial pressure was lowered from 21kPa to 8–9kPa. However, ƒHand Qdid increase slightly, and significantly, after 1h of exposure to water of 8–9kPa O2in the normoxia-acclimated cod.
The pattern of change in MO2and cardiac variables during the hypoxic Ucrittest was qualitatively similar to that seen during the normoxic swim (Fig.2). However, Ucritfor both groups (1.0BLs–1) was only approximately two-thirds of that measured during normoxia (1.5BLs–1), and this diminished swimming performance
0 50 100 150 200 250
Oxygen con
su
mption
(mg O
2
h
–1
kg
–1
)
0 50 100 150 200 250
25 30 35 40 45 50 55
S
trok
e v
ol
u
me (ml kg
–1
)
0.2 0.4 0.6 0.8 1.0 1.2 1.4
0.2 0.4 0.6 0.8 1.0 1.2 1.4
Swimming speed Time (min) Swimming speed Time (min) (body length s–1)
C
a
rdi
a
c o
u
tp
u
t (ml min
–1
kg
–1
)
0 10 20 30 40 50 60
0 10 20 30 40 50 60
Recovery
*
*
*
*
He
a
rt
r
a
te (
b
e
a
t
s
min
–1
)
25 30 35 40 45 50 55
Recovery
Normoxia-acclimated Hypoxia-acclimated
*
*
*
*
*
*
*
*
*
* * *
*
**
* *
*
*
*
*
*
*
*
*
*
*
*
*
*
*
*
*
*
*
*
*
*
*
*
*
*
*
*
*
*
*
* *
*
*
Normoxic swim Hypoxic swim
*
0 0.5 1.0 1.5 25 125
*
A
B
C
D
E
F
G
H
Ucrit test Ucrit test
(body length s–1)
0 0.5 1.0 1.5 25 125
was associated with important differences in how cardiorespiratory variables in normoxia- and hypoxia-acclimated cod responded to the exercise regimen. First, as compared with the normoxic swim,
maximum MO2 was greatly reduced in both groups (214 and 231mgO2h–1kg–1vs93 and 101mgO2h–1kg–1), and this resulted in a dramatically reduced metabolic scope (to ~30mgO2h–1kg–1). Second, although the scope for Qwas reduced to a similar degree in both groups (to ~11.5mlmin–1kg–1) when the cod were swum under hypoxic conditions as compared with normoxia, the reason for the reduced scope for Q was different. In the normoxia-acclimated group, the scope for Qwas diminished because the scope for ƒH was reduced by 50% (normoxia 13.4beatsmin–1; hypoxia 5.8beatsmin–1). In contrast, the scope for V
S fell from 0.25 to 0.15mlkg–1in the hypoxia-acclimated group when the cod were swum at an oxygen level of 8–9kPa (Table3).
During recovery from the hypoxic Ucrittest, the pattern of change in MO2, Qand VSwas similar to that observed after the normoxic swim. However, the pattern of change in ƒHwas quite different. Heart rate increased in both groups between 0 and 25min post-exercise, before declining to pre-swim levels (Fig.2). This was probably due to the fact that these fish were recovered in normoxic, not hypoxic water. As with the normoxic swim, there was no difference in EPOC values between the two groups. However, for both groups, EPOC was ~35% lower than the values for cod swum under normoxic conditions (Table3).
Relationship between oxygen consumption and cardiac output
During the normoxic swim (Fig.4A) there was a strong linear relationship between cardiac output and oxygen consumption in both the normoxic (r20.97) and hypoxic groups (r20.95). However, the relationship for the hypoxia-acclimated fish was shifted decidedly upwards, and this resulted in a substantially greater MO2for a given Qin hypoxia- as compared with normoxia-acclimated fish. There was no clear relationship between MO2and
Qwhen the fish were exposed to graded hypoxia. However, the
MO2 of hypoxia-acclimated fish was generally above that of the normoxia-acclimated fish, and this elevated level of MO2was achieved at reduced levels of Q(Fig.4B). Finally, although the relationship between MO2 and Q was not as strong during the hypoxic swim (r20.83 and 0.84), and the data for the hypoxia-acclimated group was much more variable, it was again apparent that the hypoxia-acclimated fish consumed more O2for a given cardiac output (Fig.4C).
DISCUSSION
The cod in this study were swum to exhaustion, first under normoxia, and then at a PwO2of ~8–9kPa after being allowed to recover from the initial Ucrittest for ~24h. This experimental design has some limitations. Most importantly, the possibility that different degrees of recovery from surgery (18 vs~42h) or effects related to the initial Ucrit test, might have obscured some effects of acute hypoxia on swimming performance, cardiac function and metabolic capacity. We believe that these were minimal given how closely our data fit with those in the literature, that fish recover quickly (within 2h) from exhaustive exercise under normoxic conditions (Jain and Farrell, 2003; Jain et al., 1998), and that the reduction in
Ucrit with acute hypoxia was similar in fish that were simply placed
into the swim-tunnel (non-surgery) vsthose that were implanted with flow probes (see below). Furthermore, it is unlikely that the experimental design significantly affected our major findings with respect to the effects of acclimation to hypoxia on cod cardiorespiratory function. This is because our results are very similar to those obtained in a later study where cod were given a graded hypoxic challenge ~24h after recovering from surgery
He
a
rt
r
a
te
(
b
e
a
t
s
min
–1
)
0 10 20 30 40 50
S
trok
e v
ol
u
me
(ml kg
–1
)
0 0.2 0.4 0.6 0.8 1.0
Water oxygen partial pressure (kPa) 20 16 12 8–9 8–9
Oxygen con
su
mption
(mg O
2
h
–1
kg
–1)
50 55 60 65 70 75 80 85
Normoxia-acclimated Hypoxia-acclimated
*
*
*
*
*
C
a
rdi
a
c o
u
tp
u
t
(ml min
–1
kg
–1
)
0 10 20 30 40
*
*
a
b
a
b
*
a a a
a a a
D
C
B
A
(L.H.P. and A.K.G., unpublished) and to those recently reported by Lamarche et al. (Lamarche et al., 2009).
Effects of surgery
The reduction in normoxic swimming performance (from 1.74 to 1.5Bls–1) associated with surgery and/or anaesthesia was not unexpected (see Butler et al., 1989; Campbell et al., 2004; Bell and Eggleston, 2005). Nonetheless, it is difficult to ascribe a definitive cause for the diminished Ucritunder normoxic conditions. This is because Butler et al. (Butler et al., 1989) report that Ucrit in cod is diminished by 13.5% following sham surgery (a similar decrease to that reported here, 14%), and thus the presence of the flow probe and/or drag associated with the probe lead are unlikely to explain the reduced Ucrit in fish that underwent surgery. Furthermore, maximum MO2and metabolic scope were similar between groups (~220 and 150mgO2h–1kg–1; ~198 and 135mgO2h–1kg–0.8;
Table1), and the scope for Q (21.5mlmin–1kg–1) was almost identical to that obtained for cod fitted with Doppler flow probes that were subjected to a Ucrit test following at least 48h of recovery [23mlmin–1kg–1; Webber et al. (Webber et al. 1998)]. There are, however, two potential explanations. Cod in poor condition (condition factor 0.68) start burst-coast swimming (i.e. switch to a mix of aerobic and anaerobic powered swimming) at lower speeds, and become exhausted at a reduced Ucrit (Lapointe et al., 2006). However, we feel that an earlier initiation of burst-coast swimming is unlikely in this study as there were no significant (P<0.05) differences in MO2between the two groups of fish at swimming speeds above 0.38BLs–1; this finding suggesting that the cost of transport was similar between the two groups. In addition, EPOC [an index of the non-aerobic costs of exercise (Lee et al., 2003)] was significantly lower in the surgery group. This latter result suggests that Ucritwas reduced not because burst-coast swimming was initiated at a lower velocity, but because the number or intensity of burst-coast events prior to exhaustion was diminished. Such a reduction in swimming effort associated with recovery from anaesthesia/surgery would be consistent with the conclusions of McFarlane and McDonald (MacFarlane and MacDonald, 2002) and Peake and Farrell (Peake and Farrell, 2006). These authors indicate that the cessation of activity and decreased swimming performance in Ucrittests is often a behavioural response (i.e. fish are disinclined to perform).
Effects of acute hypoxia and acclimation to hypoxia: measurements at rest
Acclimation to chronic hypoxia (~8kPa) resulted in elevated routine (i.e. measured at 0.25BLs–1) and standard metabolic rates (Table3, Fig.2) in normoxia as compared with normoxia-acclimated cod, despite lower values of VSand Q(0.49 vs0.73mlkg–1and 17.0 vs 21.3mlmin–1kg–1, respectively). The higher routine M
O2in hypoxia-acclimated cod contrasts with the findings of Bushnell et al. (Bushnell et al., 1984) who reported that acclimation to hypoxia did not influence, or significantly reduced, normoxic MO2values in resting rainbow trout. The disparity in results between our study and that of Bushnell et al. (Bushnell et al., 1984) could be related to methodological differences. Bushnell et al. (Bushnell et al., 1984) only acclimated their trout to hypoxia for 3weeks, the level of hypoxia during acclimation (~5.6kPa) was more severe than utilized in the present study, and the hypoxia-acclimated trout were only allowed a brief period at normoxic levels of oxygen prior to measurements of MO2. However, it may also be due to inter-specific differences in how teleost fish are affected by chronic hypoxia. For example, Lomholt and Johansen (Lomholt and Johansen, 1979) report that carp (Cyprinus carpio) acclimated to a PO2of 4kPa for 4weeks had a reduced MO2when they were returned to high oxygen conditions, whereas Pichavant et al. (Pichavant et al., 2000) showed that acclimation to hypoxia (45days at a PO2~10kPa) did not alter the routine MO2of turbot (Scophthalmus maximus) at any water PO2 level. This study did not attempt to elucidate the factors responsible for the elevated routine MO2in hypoxia-acclimated fish. However, it is unlikely that the higher MO2was stress related. This is because circulating catecholamines in resting hypoxia-acclimated cod at 18–24h post surgery are ≤5nmoll–1when measured under normoxia, and similar to those measured in normoxia-acclimated fish (L.H.P. and A.K.G., unpublished).
Standard and routine metabolic rates decreased slightly (non-surgery and hypoxia-acclimated fish) or were unchanged (normoxia-acclimated group) when the cod were acutely exposed to a PwO2 of 8–9kPa (Tables 2 and 3). These results are consistent with recent
Oxygen con
su
mption (mg O
2
h
–1
kg
–1
)
50 55 60 65 70 75 80 85 50 100 150 200 250
Cardiac output (ml min–1 kg–1)
10 20 30 40 50 50
60 70 80 90 100 110 120
Normoxia-acclimated Hypoxia-acclimated
A
B
C
data on juvenile cod at 10°C where both trends have been reported prior to fish reaching their critical oxygen tension (Steffensen et al., 1994; Schurmann and Steffensen, 1997; Gamperl et al., 2009). When normoxia-acclimated cod were exposed to acute hypoxia, VSdid not change significantly, although Qand fHdid increase slightly after 1h at 8–9kPa, as compared with the value recorded at the start of day2 (Table3, Fig.3). The lack of hypoxic bradycardia, and a concomitant increase in VS, in this study as compared with that of Fritsche and Nilsson (Fritsche and Nilsson, 1989) is most likely due to the depth of hypoxia, as: (1) Fritsche and Nilsson exposed their cod to ~5kPaO2as compared to 8–9kPa in the present study; (2) the Scritfor Atlantic cod (i.e. the water O2saturation at which they transitioned from being an oxyregulator to an oxyconformer) at 10°C (Schurmann and Steffensen, 1997; Gamperl et al., 2009) is at or below the lowest level of hypoxia used in this study; and (3) Petersen and Gamperl (L.H.P. and A.K.G., unpublished) have shown that ƒH falls (and VSincreases) rapidly in normoxia- and hypoxia-acclimated cod when PwO2 falls below ~5kPa (ƒH and VS in normoxia-acclimated cod ~20beatsmin–1 and 1.3mlkg–1, respectively, at 2.7kPa). However, we cannot exclude the possibility that the rapid induction of hypoxia in the Fritsche and Nilsson study (Fritsche and Nilsson, 1989) (i.e. over ~60s), vsexposure to graded hypoxia over a period of 3h (present study), contributed to the contrasting effects of hypoxia on fHbetween the two studies.
Effects of acute hypoxia: exercise
When the two normoxia-acclimated groups (i.e. surgery and non-surgery) were exposed to a PwO2of 8-9kPa, Ucritwas reduced by 33 and 29%, respectively. This decrease in Ucritis very similar to that reported by Dutil et al. (Dutil et al., 2007) for 7°C cod swum at 8.5kPa (1.72 vs1.26BLs–1), and comparable to those for rainbow trout [~25% at 5.6kPa; Bushnell et al. (Bushnell et al., 1984)] and coho salmon [Oncorhynchus kisutch; 27% at ~8.5kPa; Dahlberg et al. (Dahlberg et al., 1968)]swum at 15 and 20°C, respectively. However, it is much greater than that recorded for largemouth bass (Micropterus salmoides) at 25°C (10% at ~8.5kPa) (Dahlberg et al., 1968) and mullaway (Argyrosomus japonicus) at 21–23°C (17% at both ~10 and 5kPa) (Fitzgibbon et al., 2007). When combined, these data suggest that there are considerable inter-specific differences in the sensitivity of swimming performance to reduced oxygen levels, and that this variation is related to the likelihood that a species will encounter hypoxic conditions during its life history. For example, most salmonids inhabit well-aerated fluvial environments and cod normally avoid water oxygen levels less than 9kPa (40–45% air saturation) (Claireaux et al., 2005). By contrast, largemouth bass prefer shallow, warm, weedy areas (Heidinger, 1975) and the mullaway spends its early life in estuaries (Fitzgibbon et al., 2007), both environments where water quality and oxygenation can vary considerably.
It is clear that reduced metabolic scope (by 55 and 80% in non-surgery and non-surgery groups, respectively; Table2) restricted the swimming performance of our normoxia-acclimated cod during acute hypoxic exposure; and that this was, in large part, related to a diminished maximum cardiac performance. The dependence of fish swimming performance on metabolic scope is well established (e.g. Fry, 1971; Arnott et al., 2006; Chatelier et al., 2006), and the magnitude of the decreases in metabolic scope when the cod were swum under hypoxic conditions are consistent with other studies that have examined the relationship between metabolic scope and reduced water oxygen levels in this species. For example, at a PwO2 of 8–10kPa cod forced to swim in respirometers to Ucrit show reductions in metabolic scope ranging from 65–75% (Claireaux et
al., 1995; Dutil et al., 2007), whereas scope calculated on free-living fishes using limiting oxygen concentration curves (Claireaux and Lagardére, 1999) falls by ~53% (Claireaux et al., 2000). Furthermore, myocardial performance is a primary factor limiting metabolic rate and Ucrit in many active teleosts (Farrell, 2002; Claireaux et al., 2005; Clark et al., 2005), and maximum Q was reduced by 47% when normoxia-acclimated cod were swum under hypoxic conditions. Although a diminished maximum Q under hypoxic as compared with normoxic conditions (from 45.5 to 34.6mlmin–1kg–1) was not unexpected (e.g. Hanson et al., 2006), we were surprised to find that the reduction in Qwas solely related to a lower maximum ƒH(and scope for ƒH); maximum VSreaching the same value as measured under normoxia (0.99mlkg–1). This is because, in contrast to the rainbow trout (e.g. Faust et al., 2004; Gamperl et al., 2004), acute exposure of the in situcod heart to severe hypoxia does not affect ƒHduring resting or maximum levels of cardiac performance (Petersen and Gamperl, 2010), and maximum ƒH and scope for ƒH were not different in hypoxia-acclimated cod when swum under hypoxic and normoxic conditions (Fig.2, Table3). Furthermore, it is unlikely that the lowered ƒHwas the result of the stimulation of branchial O2receptors as this level of hypoxia (8–9kPa) did not elicit bradycardia under resting conditions. This raises the distinct possibility that venous O2 receptors located at or before the heart, as proposed by Barrett and Taylor (Barrett and Taylor, 1984), were stimulated by severe hypoxemia associated with exercise under hypoxic conditions and mediated a reduction in heart rate through the efferent limb of the cardiac vagus.
Effects of acclimation to hypoxia: exercise
Cod chronically acclimated to moderate hypoxia (8–9kPa) had values of maximum MO2, metabolic scope and Ucritunder normoxia and hypoxia that were not significantly different from those measured in normoxia-acclimated fish (Table3). These results are in agreement with the results of Bushnell et al. (Bushnell et al., 1984) and Kutty (Kutty, 1968), who showed that neither the swimming speed–oxygen consumption relationship or Ucritvalues were altered when rainbow trout and goldfish, respectively, were acclimated to hypoxic conditions. Collectively, these data indicate that the swimming performance of fish living in areas impacted by prolonged hypoxia will be diminished significantly, and that they may be more vulnerable to predation. This would be especially true if they encountered mammalian (e.g. seals, cetaceans) or avian (e.g. diving birds) predators whose aerobic requirements are not dependent upon water oxygen levels.
The similar values for metabolic variables and Ucrit in the two groups was surprising given that maximum Qwas lower in hypoxia-acclimated fish at all swimming speeds in both Ucrittests, and that maximum Q during the normoxic swim test was 23% lower in hypoxia-acclimated cod as compared with normoxia-acclimated individuals due to diminished values for VS (Fig.2, Table3). This apparent discrepancy is resolved, however, when the relationship between Qand oxygen consumption is examined for the two groups (Fig.4). During both the normoxic and hypoxic swims, hypoxia-acclimated cod consumed more oxygen for a given cardiac output. For example, at a Q of 30mlmin–1kg–1, hypoxia-acclimated cod consumed ~185mlO2h–1kg–1 when swimming under normoxic conditions as compared with ~130ml O2h–1kg–1 in normoxia-acclimated fish. This upward shift in the relationship between Q
because: (1) several authors have reported increases in haematocrit, blood haemoglobin levels and/or haemoglobin oxygen affinity in response to hypoxia acclimation (e.g. Bushnell et al., 1984; Driedzic et al., 1985; Timmerman and Chapman, 2004); and (2) subsequent experiments in our lab have shown that tissue O2 extraction efficiency is significantly enhanced (by 15%) in hypoxia-acclimated cod under normoxic conditions, while blood haemoglobin levels are slightly or significantly (depending on water PO2) higher in hypoxia-acclimated cod at rest (L.H.P. and A.K.G., unpublished). Furthermore, although cod heart function does not appear to be modulated by circulating catecholamines (Axelsson, 1988), these hormones activate Na+/H+exchange in cod red blood cells [and presumably improve blood oxygen carrying capacity (Berenbrink and Bridges, 1994)], and hypoxia-acclimated cod have significantly higher stress-induced catecholamine levels (Petersen and Gamperl, 2010).
One of the major findings of this study was that hypoxia-acclimated cod had significantly lower values for resting and maximum VSand Qin both swim tests, and a significantly lower scope for VSwhen swum under hypoxic conditions, as compared with the normoxia-acclimated group (Fig.2, Table3). Given that neither cod heart size or relative ventricular mass (RVM) are affected by exposure to chronic hypoxia (Petersen and Gamperl, 2010), the most obvious explanation for this diminished cardiac function is that long-term acclimation to hypoxia had a direct negative effect on the heart’s pumping capacity. Indeed, this hypothesis is directly supported by the results of a recent study that investigated the effects of chronic hypoxia on in situcardiac function (present study). These authors showed that acclimation to hypoxia reduced maximum in situ Q and VS by 19 and 28%, respectively, under oxygenated conditions. However, whether this reduced pumping capacity is due myocardial stunning (Bolli and Marban, 1999), myocardial necrosis (e.g. Lennard and Huddart, 1992) or remodelling of the myocardium that resulted in a smaller ventricular lumen and outflow tract (Marques et al., 2008) has not been resolved.
Hypoxia-acclimated cod were able to increase ƒH during the hypoxic swim to levels measured during normoxia (Fig.2, Table3). This resulted in them having a significantly greater scope for ƒH (12.6 vs 5.8beatsmin–1)
, and allowed them to achieve the same maximum Q, as compared with normoxia-acclimated fish when swum at 8–9kPa O2. The mechanism(s) resulting in the differential regulation of ƒH in the two groups when swum under hypoxic conditions cannot be ascertained from the present study or the literature. However, this result, in combination with recent data showing that rainbow trout at 24°C can maintain Qeven when ƒH is halved using the pharmacological agent zatebradine (Gamperl et al., 2007), highlights the tremendous plasticity in how fish cardiorespiratory physiology responds to environmental challenges and that our understanding of control mechanisms that mediate myocardial function and adaptation in this taxa is far from complete.
Conclusion
In this study we made the first measurements of fish cardiorespiratory function during exercise under hypoxia (8–9kPa O2), and of how acclimation to this same level of hypoxia for 6–12weeks influenced resting and exercise-induced in vivocardiac function under both hypoxic and normoxic conditions. These studies revealed that: (1) when cod were swum under hypoxic conditions cardiac function was diminished, and this was associated with reduced aerobic scope, and a ~30% lower Ucrit; (2) acclimation to hypoxia does not improve the cod’s swimming capacity, maximum metabolic rate or scope for activity when swum to Ucritunder either
normoxic or hypoxic conditions; and (3) although the resting and maximal cardiac output of hypoxia-acclimated cod were diminished due to a reduced VS, this does not significantly affect the swimming speed–O2 consumption relationship, maximum MO2 or aerobic scope. These results offer novel insights into how cod cardiorespiratory physiology is impacted by short-term and prolonged exposure to environmental hypoxia. Furthermore, they provide indirect evidence that venous O2receptors may be important in regulating cardiac function in fishes, and are another important example of how incredibly flexible cardiac function, and its control, is in fishes. However, the fact that these experiments were performed with hatchery-reared (as opposed to wild) fish, and the paucity of data on the effects of exposure to hypoxia on fish cardiorespiratory physiology, leaves numerous questions unanswered. These include: to what extent are reductions in maximal exercise and cardiac pumping capacity in fish following exposure to hypoxia related to a species life history and/or hypoxia tolerance? Is the diminished pumping capacity of the cod heart following acclimation to hypoxia a consequence of myocardial damage or remodelling? What mechanisms allowed the cod’s maximum oxygen consumption to be maintained following acclimation to hypoxia despite a considerable reduction in cardiac pumping capacity?
ACKNOWLEDGEMENTS
This research was funded by a Natural Sciences and Engineering Research Council of Canada Discovery Grant to A.K.G. and a Memorial University of Newfoundland (MUN) graduate fellowship to L.H.P. We thank Terry Harris for his electronics expertise, MUN technical services for manufacturing several pieces of equipment used in this study, Darrell Green for taking and analysing the water quality samples and Danny Boyce and the Atlantic Innovation Fund for providing the experimental fish.
REFERENCES
Arnott, S. A., Chiba, S. and Conover, D. O.(2006). Evolution of intrinsic growth rate: metabolic costs drive trade-offs between growth and swimming performance in Menidia menidia. Evolution60, 1269-1278.
Axelsson, M.(1988). The importance of nervous and humoral mechanisms in the control of cardiac performance in the Atlantic cod Gadus morhua at rest and during non-exhaustive exercise. J. Exp. Biol. 137, 287-303.
Barrett, D. J. and Taylor, E. W.(1984). Changes in heart rate during progressive hyperoxia in the dogfish Scyliorhinus canicula L.: evidence for a venous oxygen receptor. Comp. Biochem. Physiol. 78, 697-703.
Bell, G. W. and Eggleston, D. B.(2005). Species-specific avoidance responses by blue crabs and fish to chronic and episodic hypoxia. Mar. Biol. 146, 761-770. Berenbrink, M. and Bridges, C. R.(1994). Catecholamine-activated sodium/proton
exchange in the red blood cells of the marine teleost Gadus morhua. J. Exp. Biol. 192, 253-267.
Bolli, R. and Marban, E.(1999). Molecular and cellular mechanisms of myocardial stunning. Physiol. Rev. 79, 609-634.
Breitburg, D.(2002). Effects of hypoxia, and the balance between hypoxia and enrichment, on costal fishes and fisheries. Estuaries25, 767-781.
Brett, J. R.(1964). The respiratory metabolism of swimming performance of young sockeye salmon. J. Fish. Res. Bd. Can. 21, 1183-1226.
Burleson, M. L., Carlton, A. L. and Silva, P. E.(2002). Cardioventilatory effects of acclimatization to aquatic hypoxia in channel catfish. Resp. Physiol. Neurobiol. 131, 223-232.
Bushnell, P. G., Steffensen, J. F. and Johansen, K.(1984). Oxygen consumption and swimming performance in hypoxia-acclimated rainbow trout, Salmo gairdneri. J. Exp. Biol. 113, 225-235.
Butler, P. J., Taylor, E. W., Capra, M. F. and Davison, W.(1979). The effect of hypoxia on the levels of circulating catecholamines in the dogfish Scyliorhinus canicula. J. Comp. Physiol. 127, 325-330.
Butler, P. J., Axelsson, M., Ehrenström, F., Metcalfe, J. D. and Nilsson, S. (1989). Circulating catecholamines and swimming performance in the Atlantic cod, Gadus morhua. J. Exp. Biol. 141, 377-387.
Campbell, H. A., Taylor, E. W. and Egginton, S.(2004). The use of power spectral analysis to determine cardiorespiratory control in the short-horned sculpin Myxocephalus scorpius. J. Exp. Biol. 207, 1969-1976.
Cech, J. J., Jr(1990). Respirometry. In Methods of fish Biology (ed. C. B. Schreck and P. B. Moyle). Bethesda, MD: American Fisheries Society.
Chabot, D. and Dutil, J. D.(1999). Reduced growth of Atlantic cod in non-lethal hypoxic conditions. J. Fish. Biol. 55, 472-491.
Chatelier, A., McKenzie, D. J., Prinet, A., Galois, R., Robin, J., Zambonino, J. and Claireaux, G.(2006). Associations between tissue fatty acid composition and physiological traits of performance and metabolism in the seabass (Dicentrarchus labrax). J. Exp. Biol. 209, 3429-3439.
Claireaux, G., Webber, D. M., Kerr, S. R. and Boutilier, R. G.(1995). Physiology and behaviour of free-swimming Atlantic cod (Gadus morhua) facing fluctuating salinity and oxygenation conditions. J. Exp. Biol. 198, 61-69.
Claireaux, G., Webber, D. M., Lagardère, J. P. and Kerr, S. R.(2000). Influence of water temperature and oxygenation on the aerobic metabolic scope of Atlantic cod (Gadus morhua). J. Sea Res. 44, 257-265.
Claireaux, G., McKenzie, D. J., Genge, A. G., Chatelier, A., Aubin, J. and Farrell, A. P.(2005). Linking swimming performance, cardiac pumping ability and cardiac anatomy in rainbow trout. J. Exp. Biol. 208, 1775-1784.
Clark, T. D. and Seymour, R. S.(2006). Cardiorespiratory physiology and swimming energetics of a high-energy-demand teleost, the yellowtail kingfish (Seriola lalandi). J. Exp. Biol.209, 3940-3951.
Clark, T., Ryan, T., Ingram, B., Woakes, A., Butler, P. and Frappell, P.(2005). Factorial aerobic scope is independent of temperature and primarily modulated by heart rate in exercising Murray cod (Maccullochella peelii peelii). Physiol. Biochem. Zool. 78, 347-355.
Dahlberg, M. L., Shumway, D. L. and Doudoroff, O.(1968). Influence of dissolved oxygen and carbon dioxide on swimming performance of largemouth bass and coho salmon. J. Fish. Res. Bd. Can. 25, 49-70.
D’Amours, D.(1993). The distribution of cod (Gadus morhua) in relation to temperature and oxygen levels in the Gulf of St. Lawrence. Oceanography2, 24-29.
Diaz, R. J. and Rosenberg, R.(1995). Marine benthic hypoxia: a review of its ecological effects and the behavioural responses of benthic macrofauna. Oceangr. Mar. Biol. 33, 245-303.
Driedzic, W. R., Gesser, H. and Johansen, K.(1985). Effects of hypoxic adaptation on myocardial performance and metabolism of Zoarces viviparus. Can. J. Zool. 63, 821-823.
Dutil, J. D., Sylvestre, E. L., Gamache, L., Larocque, R. and Guderley, H.(2007). Burst and coast use, swimming performance and metabolism of Atlantic cod Gadus morhua in sub-lethal hypoxic conditions. J. Fish. Biol. 71, 363-375. Evans, D. O.(2007). Effects of hypoxia on scope-for-activity and power capacity of
lake trout (Salvelinus namaycush). Can. J. Fish. Aquat. Sci. 64, 345-361. Farrell, A. P.(2002). Cardiorespiratory performance in salmonids during exercise at
high temperature: Insights into cardiovascular design limitations in fishes. Comp. Biochem. Physiol. 132A, 797-810.
Faust, H. A., Gamperl, A. K. and Rodnick, K. J.(2004). All trout are not created equal: intra-specific varaition in cardiac hypoxia tolerance. J. Exp. Biol.207, 1005-1015.
Fitzgibbon, Q. P., Strawbridge, A. and Seymour, R. S.(2007). Metabolic scope, swimming performance and the effects of hypoxia in the mulloway, Argyrosomus japonicus (Pisces: Sciaenidae). Aquaculture270, 358-368.
Fritsche, R. and Nilsson, S.(1989). Cardiovascular responses to hypoxia in the Atlantic cod, Gadus morhua. Exp. Biol. 48, 153-160.
Fry, F. E. J.(1971). The effects of environmental factors on the physiology of fish. In Fish Physiology, Vol. 6 (ed. W. S. Hoar and D. J. Randall). New York: Academic Press.
Gamperl, A. K., Pinder, A. W., Grant, R. R. and Boutilier, R. G.(1994). Influence of hypoxia and adrenaline administration on coronary blood flow and cardiac performance in seawater rainbow trout (Oncorhynchus mykiss). J. Exp. Biol. 193, 209-232.
Gamperl, A. K., Faust, H. A., Dougher, B. and Rodnick, K. J.(2004). Hypoxia tolerance and preconditioning are not additive in the trout (Oncorhynchus mykiss) heart. J. Exp. Biol. 207, 2497-2505.
Gamperl, A. K., Swafford, B. L. and Rodnick, K. J.(2007). The impact of elevated water temperature and zatebradine-induced bradycardia on cardiovascular function in male and female rainbow trout (Oncorhynchus mykiss). Integr. Comp. Biol. 47 (S1), e182.
Gamperl, A. K., Busby, C. D., Hori, T. S. F., Afonso, L. O. B. and Hall, J. R. (2009). Haemoglobin genotype has minimal influence on the physiological response of Atlantic cod (Gadus morhua) to environmental challenges. Physiol. Biochem. Zool. 82, 483-494.
Gerlach, S. A.(1988). The Baltic environment. Proceedings of the 10thsymposium of the Baltic marine biologists. Sonderheft Kieler Meeresforschungen. 6, 1-462. Gilbert, D., Sundby, B., Gobeil, C., Mucci, A. and Tremblay, G. H.(2005). A
seventy-two year record of diminishing deep water oxygen in the St. Lawrence estuary: The northwest Atlantic connection. Limnol. Oceanogr. 50, 1654-1666. Gollock, M. J., Currie, S., Petersen, L. H. and Gamperl, A. K.(2006).
Cardiovascular and haematological responses of Atlantic cod (Gadus morhua) to acute temperature increase. J. Exp. Biol. 209, 2961-2970.
Greaney, G. S., Allen, R. P., Cashon, R. E., Smith, G. and Powers, D. A.(1980). Time course of changes in enzyme activities and blood respiratory properties of killifish during long-term acclimation to hypoxia. Physiol. Zool. 53, 136-144. Hanson, L. M., Obradovich, S., Mouniargi, J. and Farrell, A. P.(2006). The role
of adrenergic stimulation in maintaining maximum cardiac performance in rainbow trout (Oncorhynchus mykiss) during hypoxia, hyperkalemia and acidosis at 10°C. J. Exp. Biol. 209, 2442-2445.
Heidinger, R. C.(1975). Life history and biology of largemouth bass. In Black Bass Biology and Management (ed. R. H. Stroud and H. Clepper), pp. 11-20. Washington DC: Sport Fishing Institute.
Hoback, W. W. and Barnhart, M. C.(1996). Lethal limits and sublethal effects of hypoxia on the amphipod Gammarus pseudolimnaeus. J. Nth. Amer. Benth. Soc. 15, 117-126.
Hutchings, J. A. and Reynolds, J. D.(2004). Marine fish population collapses: consequences for recovery and extinction risk. Bioscience54, 297-309. Jain, K. E. and Farrell, A. P.(2003). Influence of seasonal temperature on the
repeat swimming performance of rainbow trout Oncorhynchus mykiss. J. Exp. Biol. 206, 3569-3579.
Jain, K. E., Birtwell, I. K. and Farrell, A. P.(1998). Repeat swimming performance of mature sockeye salmon following a brief recovery period: a sensitive measure of fish health and water quality. Can. J. Zool. 76, 1488-1496.
Kiceniuk, J. W. and Colbourne, E.(1997). Relating oxygen levels in the Newfoundland offshore waters to the physiology of Atlantic cod (Gadus morhua). Can. J. Fish. Aqua. Sci. 54, 81-87.
Killen, S. S., Costa, I., Brown, J. A. and Gamperl, A. K.(2007). Little left in the tank: metabolic scaling in marine teleosts and its implications for aerobic scope. Proc. Royal. Soc. B Biol. Sci. 274, 431-438.
Kutty, M. N.(1968). Influence of ambient oxygen on the swimming performance of goldfish and rainbow trout. Can. J. Zool. 46, 647-653.
Lamarche, M. C., Chabot, D. and Guderley, H.(2009). Effects of acute and chronic hypoxia on metabolic capacity of Atlantic cod (Gadus morhua) from the Gulf of St Lawrence. Comp. Biochem. Physiol. 153A, S142-S142.
Lapointe, D., Guderley, H. and Dutil, J. D.(2006). Changes in the condition factor have an impact on metabolic rate and swimming performance relationships in Atlantic cod (Gadus morhua L.). Physiol. Biochem. Zool. 79, 109-119. Lee, C. G., Farrell, A. P., Lotto, A., Hinch, S. G. and Healy, M. C.(2003). Excess
post-exercise oxygen consumption in adult sockeye (Oncorhynchus nerka) and coho (O. kisutch) salmon following critical speed swimming. J. Exp. Biol. 206, 3253-3260.
Lennard, R. and Huddart, H.(1992). The effects of hypoxic stress on the fine structure of the flounder heart (Platichthys flesus). Comp. Biochem. Physiol. 101A, 723-732.
Lomholt, J. P. and Johansen, K.(1979). Hypoxia acclimation in carp-how it affects O2uptake, ventilation and O2extraction from water. Physiol. Zool. 5, 38-49.
MacFarlane, W. J. and MacDonald, D. G.(2002). Relating intramuscular fuel use to endurance in juvenile rainbow trout. Physiol. Biochem. Zool. 75, 250-259. Marques, I. J., Leito, J. T. D., Spaink, H. P., Testerink, J., Jaspers, R. T., Witte,
F., van den Berg, S. and Bagowski, C. P.(2008). Transcriptome analysis of the response to chronic constant hypoxia in zebrafish hearts. J. Comp. Physiol. B 178, 77-92.
Monpetit, C. J. and Perry, S. F.(1998). The effects of chronic hypoxia on the acute adrenergic stress response in the rainbow trout (Oncorhynchus mykiss). Physiol. Zool. 71, 377-386.
Myers, R. A., Hutchings, J. A. and Barrowman, N. J.(1996). Hypotheses for the decline of cod in the North Atlantic. Mar. Ecol. Prog. Ser. 138, 293-308. Nelson, J. A.(1989). Critical swimming speeds of yellow perch Perca flavescens:
comparison of populations from a naturally acidic lake and a circumneutral lake in acid and neutral water. J. Exp. Biol. 145, 239-254.
Neuenfeldt, S.(2002). The influence of oxygen saturation on the distributional overlap of predator (cod, Gadus morhua) and prey (herring, Clupea harengus) in the Bornholm Basin of the Baltic Sea. Fish. Ocean. 11, 11-17.
Paajanen, V. and Vornanen, M.(2003). Effect of hypoxia in inward rectifier K+ current (IKI) in ventricular myocytes of crucian carp (Carassius carassius) heart. J. Membr. Biol. 194, 119-127.
Peake, S. J. and Farrell, A. P.(2006). Fatigue is a behavioural response in respirometer confined smallmouth bass. J. Fish. Biol. 68, 1742-1755. Petersen, L. H. and Gamperl, A. K. (2010). In situ cardiac function in Atlantic
cod (Gadus morhua): effects of acute and chronic hypoxia. J. Exp. Biol.213, 820-830.
Pichavant, K., Person-Le Ruyet, J., Le Bayon, N., Sèvère, A., Le Roux, A., Quèmèner, L., Maxime, V., Nonotte, G. and Bœuf, G.(2000). Effect of hypoxia on growth and metabolism of juvenile turbot. Aquaculture188, 103-114. Pichavant, K., Person-Le-Ruyet, J., Le Bayon, N., Sèvère, A., Le Roux, A. and
Bœuf, G.(2001). Comparative effects of long-term hypoxia on growth, feeding, and oxygen consumption in juvenile turbot and European sea bass. J. Fish. Biol. 59, 875-883.
Pichavant, K., Maxime, V., Soulier, P., Boeuf, G. and Nonnotte, G.(2003). A comparative study of blood oxygen transport in turbot and sea bass: effect of chronic hypoxia. J. Fish. Biol. 62, 928-937.
Pihl, L., Baden, S. P. and Diaz, R. J.(1991). Effects of periodic hypoxia on distribution of demersal fish and crustaceans. Mar. Biol. 108, 349-360. Pihl, L., Baden, S. P., Diaz, R. J. and Schaffer, L. C.(1992). Hypoxia-induced
structural changes in the diet of bottom-feeding fish and crustacea. Mar. Biol. 112, 349-361.
Plante, S., Chabot, D. and Dutil, J. D.(1998). Hypoxia tolerance in Atlantic cod. J. Fish. Biol. 53, 1342-1356.
Post, J. R. and Lee, J. A.(1996). Metabolic ontogeny of teleost fishes. Can. J. Fish. Aquat. Sci. 53, 910-923.
Rosenberg, R., Hellman, B. and Johansson, B.(1991). Hypoxic tolerance of marine benthic fauna. Mar. Eco. Prog. Ser. 79, 127-131.
Sandblom, E. and Axelsson, M.(2005). Effects of hypoxia on the venous circulation in rainbow trout (Oncorhynchus mykiss). Comp. Biochem. Physiol. 140A, 233-239.
Sandblom, E. and Axelsson, M.(2006). Adrenergic control of venous capacitance during moderate hypoxia in the rainbow trout (Oncorhynchus mykiss): role of neural and circulating catecholamines. Am. J. Physiol. Regul. Integr. Comp. Physiol. 291, R711-R718.
Saunders, R. L.(1963). Respiration of Atlantic cod. J. Fish. Res. Bd. Can. 20, 373-386.
Schurmann, H. and Steffensen, J. F.(1997). Effects of temperature, hypoxia and activity on the metabolism of juvenile cod. J. Fish. Biol. 50, 1166-1180. Steffensen, J. F., Schurmann, H. and Bushnell, P. G.(1994). Oxygen-consumption in four species of teleosts from Greenland – no evidence of metabolic cold adaptation. Polar Biol. 14, 49-54.
performance of resting and swimming sockeye salmon (Oncorhynchus nerka). J. Exp. Biol. 211, 3915-3926.
Svedäng, H. and Bardon, G.(2003). Spatial and temporal aspects of the decline in cod (Gadus morhua L.) abundance in the Kattegat and eastern Skagerrak. ICES J. Mar. Sci. 60, 32-37.
Taylor, E. B. and McPhail, J. D.(1985). Variation in burst and prolonged swimming performance among British Columbia populations of coho salmon, Oncorhynchus kisutch. Can. J. Fish. Aquat. Sci. 42, 2029-2033.
Taylor, J. C. and Miller, J. M.(2001). Physiological performance of