INTRODUCTION
The scaling of mammalian energy metabolism to body size has been a subject of scientific study for more than a century (Rubner, 1883) (for reviews, see Schmidt-Nielsen, 1975; Savage et al., 2004), and that history has included considerable controversy over both the scaling relationship per seand its mechanistic causality. In mammals, the range of metabolic measures is generally bracketed by basal metabolic rate (BMR) at the lower limit (Lovegrove, 2006) and maximum oxygen consumption elicited during whole-body exercise (V·O2,max) at the upper limit (Seeherman et al., 1981; Jones and Lindstedt, 1993; Levine, 2008; Hillman et al., 2012; Spurway et al., 2012). Although V·O2,maxis not a measure of locomotor performance per se(Careau and Garland, 2012), it does set an upper limit to the intensity of work that can be sustained aerobically, and hence might often be subject to natural or sexual selection in the wild.
Across a wide range of mammalian diversity, it is clear that body mass (Mb) is the most important ‘global’ factor affecting
physiological traits in general and metabolic rates in particular. Mb and metabolic rate scale non-linearly in good accord with a power function: metabolism=a×MbX, where Xis commonly referred to as the allometric scaling exponent. For many decades the allometry of BMR and V·O2,maxhas sparked enormous interest and been much debated. Originally, a scaling exponent of 0.67 was suggested for the relationship between BMR and Mb, based on a comparison of domestic dogs of various sizes (Rubner, 1883). Scaling to Mb0.67 has also been proposed as theoretically appropriate given the geometry of surface–volume relationships, a concept often termed ‘geometric similarity’ (Heusner, 1985). Kleiber’s analysis of an interspecific data set including birds and mammals pointed to a scaling exponent of ~3/4 for BMR (Kleiber, 1932). Since that pioneering paper, numerous other studies have suggested a scaling exponent of 0.75 (referred to by some as the ‘universal scaling exponent’) for metabolic traits. The emphasis on ‘three-quarter’ power scaling has been based on empirical findings, consideration SUMMARY
We compiled published values of mammalian maximum oxygen consumption during exercise (V·O2,max) and supplemented these
data with new measurements of V·O2,maxfor the largest rodent (capybara), 20 species of smaller-bodied rodents, two species of weasels and one small marsupial. Many of the new data were obtained with running-wheel respirometers instead of the treadmill systems used in most previous measurements of mammalian V·O2,max. We used both conventional and phylogenetically informed allometric regression models to analyze V·O2,maxof 77 ‘species’ (including subspecies or separate populations within species) in
relation to body size, phylogeny, diet and measurement method. Both body mass and allometrically mass-corrected V·O2,max showed highly significant phylogenetic signals (i.e. related species tended to resemble each other). The Akaike information criterion corrected for sample size was used to compare 27 candidate models predicting V·O2,max(all of which included body mass). In addition to mass, the two best-fitting models (cumulative Akaike weight=0.93) included dummy variables coding for three species previously shown to have high V·O2,max (pronghorn, horse and a bat), and incorporated a transformation of the phylogenetic branch lengths under an Ornstein–Uhlenbeck model of residual variation (thus indicating phylogenetic signal in the residuals). We found no statistical difference between wheel- and treadmill-elicited values, and diet had no predictive ability for V·O2,max. Averaged across all models, the allometric scaling exponent was 0.839, with 95% confidence limits of 0.795 and 0.883,
which does not provide support for a scaling exponent of 0.67, 0.75 or unity.
Supplementary material available online at http://jeb.biologists.org/lookup/suppl/doi:10.1242/jeb.088914/-/DC1
Received 28 March 2013; Accepted 3 September 2013
Key words: allometry, comparative method, exercise, locomotion, mammals, maximum oxygen consumption, phylogeny,VO2max. The Journal of Experimental Biology 216, 4712-4721
© 2013. Published by The Company of Biologists Ltd doi:10.1242/jeb.088914
RESEARCH ARTICLE
Phylogenetic analysis of mammalian maximal oxygen consumption during exercise
Elizabeth M. Dlugosz
1,*, Mark A. Chappell
1, Thomas H. Meek
1,†, Paulina A. Szafra
ń
ska
2, Karol Zub
2,
Marek Konarzewski
2,3, James H. Jones
4, J. Eduardo P. W. Bicudo
5, Roberto F. Nespolo
6, Vincent Careau
1,‡and Theodore Garland, Jr
1,§1Department of Biology, University of California, Riverside, CA 92521, USA, 2Mammal Research Institute, Polish Academy of
Sciences, Waszkiewicza 1, 17-230 Białowieża, Poland, 3Institute of Biology, University of Bialystok, 15-950 Białystok, Poland,
4Department of Surgical and Radiological Sciences, School of Veterinary Medicine, University of California, Davis, CA 95616, USA,
5Departamento de Fisiologia, Instituto de Biociências, Universidade de São Paulo, 05508-900 São Paulo, SP, Brazil and
6Instituto de Ciencias Ambientales y Evolutivas, Universidad Austral de Chile, Casilla 567, Valdivia, Chile
*Present address: Mitrani Department of Desert Ecology, The Jacob Blaustein Institutes for Desert Research, Ben-Gurion University of the Negev, 84990 Midreshet Ben-Gurion, Israel
†Present address: Diabetes and Obesity Center of Excellence, Department of Medicine, University of Washington, Seattle, WA 98109, USA ‡Present address: Centre for Integrative Ecology, School of Life and Environmental Science, Deakin University, 75 Pigdons Road,
4713 Phylogenetic analysis of mammalian VO2,max
of how surface areas and body composition change with body size, biomechanical ‘elastic similarity’ concepts and, most recently, mathematical modeling of the fractal nature of nutrient distribution ‘trees’ (Kleiber, 1932; McMahon, 1973; Weibel et al., 1991; Weibel et al., 1992; Weibel et al., 2004; West et al., 1997; Savage et al., 2004). Most of this work (particularly empirical testing of scaling theory) has focused on BMR or resting metabolic rate (RMR).
The maximal aerobic performance limit represented by V·O2,max has been less systematically examined, in part because its measurement often entails considerable technical challenges (see Thomas and Suthers, 1972; Seeherman et al., 1981) and hence the dataset is considerably smaller than that for BMR or RMR. Nevertheless, several studies have found that mammalian V·O2,max scaling deviates from the ‘universal’ 0.75 exponent, with exponents as high as 0.87 reported for exercise-induced V·O2,max(Taylor et al., 1981; Weibel et al., 1991; Weibel et al., 2004; Weibel and Hoppeler, 2005; White and Seymour, 2005; White et al., 2008). Despite the substantial number of theoretical and experimental estimates, there is still no agreed-upon allometric scaling exponent for exercise V·O2,max(Darveau et al., 2002; Hochachka et al., 2003; White and Seymour, 2005). Given that the evolution of enzymatic, cellular and/or organ-system flux capacities, distribution networks, etc., will be affected by the maximal demands upon the animal, greater attention to the scaling of V·O2,maxis appropriate.
In studies of the upper limit to the intensity of aerobic power production, V·O2,maxhas become something of a benchmark (Wagner, 2012). Numerous studies, especially in the exercise physiology literature, have attempted to explain the mechanistic foundations of, and limiting factors for, V·O2,maxin mammals [e.g. Jones, 1998; Hochachka et al., 2003; Rezende et al., 2006 (and references therein); White et al., 2008; Longworth et al., 1989; Spurway et al., 2012] and other taxa (Hillman et al., 2012). Various potential constraints, such as aerobic enzyme catalytic capacity, muscle mitrochondrial density, microvasculature, capillary volume, hematocrit, cardiac output and lung O2 diffusion capacities have been considered in investigations of V·O2,max(Weibel et al., 2004; White and Seymour, 2005). Theoretical limitations, including O2flux, network design and temperature effects have also been discussed (West et al., 1997; White et al., 2008; Hillman et al., 2012). Despite a long list of proposed explanatory factors and measurements from species spanning a wide mass range (e.g. Taylor et al., 1981; Garland and Huey, 1987), few solid conclusions regarding either scaling exponents or the functional factors limiting to V·O2,maxhave been reached (but see Noakes, 2011; Wagner, 2011; Hillman et al., 2012; Spurway et al., 2012).
Another problematic issue in studies of V·O2,maxis the historical reliance on conventional statistical methods (least-squares regression and analysis of covariance) to estimate mass-scaling exponents. An inherent – usually implicit – assumption of conventional regression models is that all species in the analysis are equally related and hence provide statistically independent data points. Incorporating phylogenetic relationships accounts for the biological reality that all species are not equally related (Garland et al., 2005; Nunn, 2011; Rezende and Diniz-Filho, 2012) and that shared evolutionary history may affect differences among species. Various phylogenetic statistical methods have been incorporated into a number of comparative studies of physiology, biochemistry, morphology and behavior, including a recent analysis of mammalian basal metabolic rate (White et al., 2009). However, no comprehensive study of mammalian V·O2,maxhas employed phylogenetically aware statistics. To date, most tests of exercise V·O2,maxhave been performed on treadmills but some recent studies have utilized running wheel
respirometry chambers (e.g. Chappell and Bachman, 1995; Chappell et al., 2004; Chappell and Dlugosz, 2009; Dlugosz et al., 2009; Dlugosz et al., 2012). Different methodologies can provide unequal V·O2,maxvalues in treadmill tests (e.g. Kemi et al., 2002) and it is possible that different V·O2,maxvalues could be elicited by exercise in treadmills versuswheels. Hence it is appropriate to perform robust comparisons of the two methods. Here, we include new data on a number of species tested in wheel respirometers and provide the first large multispecies analysis of wheel- versustreadmill-elicited V·O2,maxin small mammals.
Beyond studying mass scaling and comparing wheel and treadmill methods, we had several additional goals. We included new data for 21 rodent species (including the largest rodent, the capybara Hydrochoerus hydrochaeris, the small marsupial Dromiciops gliroides, and the smallest member of the order Carnivora, the least weasel Mustela nivalis) in addition to data compiled from the literature, for a total of 77 ‘species’ (including some subspecies or separate populations within species). We searched for phylogenetic signal (the tendency of related species to resemble each other) in body mass-corrected V·O2,max, and in particular tested whether three species previously reported to have particularly high V·O2,max(the bat Phyllostomus hastatus, the domestic horse Equus caballusand the pronghorn Antilocapra americana) (Thomas and Suthers, 1972; Lindstedt et al., 1991; Jones and Lindstedt, 1993; Weibel and Hoppeler, 2005) are statistically unusual when accounting for phylogenetic relationships. We tested for an effect of diet type (five categories) on V·O2,max, as has been reported for basal metabolism (e.g. McNab, 1992; Muñoz-Garcia and Williams, 2005; White and Kearney, 2013). Finally, we estimated the allometric scaling exponent for mammalian V·O2,max through a model-averaging approach.
MATERIALS AND METHODS Data collection
We used literature searches (Google, Google Scholar, Web of Science, PubMed) for ‘V·O2max’ and ‘aerobic capacity’ to compile published values of mammalian exercise-induced V·O2,maxand body mass for 54 ‘species’ [including some subspecies or separate populations within species (Nowak, 1999)] (supplementary material Table S1) (Segrem and Hart, 1967; Pasquis et al., 1970; Wunder, 1970; Hoppeler et al., 1973; Lutton and Hudson, 1980; Hiernaux and Ghesquiere, 1981; Elsner and Ashwell-Erikson, 1982; Williams, 1983; Chappell and Snyder, 1984; Chappell et al., 1995; Chappell et al., 2004; Chappell et al., 2007; MacMillen and Hinds, 1992; Ong, 1993; Williams et al., 1993; Dohm et al., 1994; Schaeffer et al., 2001; Dawson et al., 2004; Sadowska et al., 2005; Sadowska, 2009; Gaustad et al., 2010). We chose to use the data for horses (Equus caballus) from Kayar et al. (Kayar et al., 1989) in order to maximize comparability with the data for steer (Bos taurus) included in the same study. Since that study, several studies have published data on horse V·O2,maxthat indicate higher values (e.g. Nieto et al., 2009; Ohmura et al., 2010). Use of these alternative values would not change our overall statistical results, as the horse turns out to be a large, positive statistical outlier in any case (see Results).
box; capybaras: 2.1 m long×0.8 m wide box). Agoutis wore a lightweight plastic mask that captured expired gas. Air was pulled through the mask at 90 l min–1. Capybaras wore no mask; instead, air was pulled through the respirometry box (flow rate 250–300 l min–1; volume ~180 l after excluding the animal’s body volume). O2was measured in agoutis over a period of 1–2 h while they rested within the box; in capybaras, it was measured over a period of 6–12 h at different times of the day and after the animals had been kept off feed for 12–24 h. After a warm-up, animals were run at high speed for 1–2 min (agoutis) or 2–3 min (capybaras) while O2was recorded. Only one high-speed run was performed per day. The V·O2,maxwas identified as the highest O2when further increases in speed elicited no increase in O2, when the respiratory exchange ratio exceeded 1.0 (capybaras) and at running speeds (1.8 m s–1for agoutis, <3 m s–1 for capybaras) at which plasma lactate accumulation rates approached 7–10 mmol l–1min–1[as suggested previously (Seeherman et al., 1981)].
In addition to capybaras and agoutis, we measured V·O2,maxin 22 species of small mammals (Table 1). Wild specimens were live-trapped at several locations in western USA (including Boyd Deep Canyon Research Center, the Motte Rimrock Reserve and the University of California, Riverside campus, all in Riverside County, CA, USA, and the Sierra Nevada Aquatic Research Laboratory in Mono County, CA, USA), northeastern Poland (the Mammal Research Institute in Bialowieza, and the University of Bialystok’s Gugny field station) and central and southern Chile (Santiago and Valdivia). Captured animals were immediately transported to the laboratory and their V·O2,maxwas measured within 24 h of capture (for most species, within 4 h of capture). Food, water, bedding and shelter were available to animals prior to V·O2,maxtests. Wild-caught individuals were released at the site of capture.
Capture, handling and measurement protocols were approved by the University of California, Riverside, University of California, Davis, and Harvard University Institutional Animal Care and Use Committee, the California Department of Fish and Game, the Polish
Nature Conservancy authorities (permit nos DOLPiK-po/ogiz-4200/IV-6.1/2979/8742/07/aj, LKE42/2008 and LKE28/2009) and the Chilean Servicio Agricola y Ganadero (permit 444-2007), and conform to US National Institutes of Health Guidelines (NIH publication 78-23) and US, Polish and Chilean laws.
Wheel respirometry
We used forced exercise in enclosed running wheel respirometers to elicit V·O2,maxin the 22 species of small mammals mentioned above (Chappell and Bachman, 1995). Wheels were supplied with dry air under positive pressure from upstream mass flow controllers (Tylan, Bedford, MA, USA or Sensirion, Staefa, Switzerland) calibrated against an accurate dry volume meter. Flow entered and exited the wheels through airtight axial bearings. A dispersive manifold on the incurrent side helped ensure even perfusion of the wheel volume, and mixing was also assisted by animal motion and the rotation of the wheel. A subsample of excurrent air (about 150 ml min–1) was dried with Drierite, scrubbed of CO2with soda lime, redried, and flowed through an oxygen analyzer (Sable Systems Oxzilla or FC-10, Las Vegas, NV, USA). Outputs from the instruments were digitized by an A–D converter (Sable Systems UI-2) and recorded every 1.0 s on a computer running LabHelper software (Warthog Systems, www.warthog.ucr.edu).
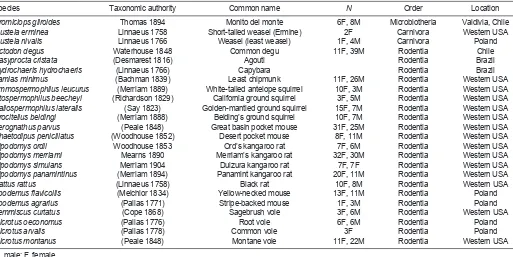
[image:3.612.52.565.80.337.2]We used four respirometer wheels with different flow rates to accommodate a range of animal sizes and V·O2,max. California ground squirrels (Otospermophilus beecheyi; >700 g) were tested in a wheel with an internal volume of 57 l (54 cm diameter×25 cm width) and a flow rate of 23 l min–1at standard pressure and temperature (STP). Species weighing 120–400 g were measured in a 9 l wheel (32 cm diameter×11 cm width) at 5 l min–1 STP. A 3.8 l wheel (24 cm diameter×8.5 cm width) and flow rates of 2–2.5 l min–1STP were used for 60–120 g animals, and for smaller species we used a 1.5 l wheel (16.5 cm diameter×7 cm width) at flow rates of 1.5–2 l min–1. The two large wheels were padded with carpet to provide traction and prevent injury; smaller wheels were lined with friction tape. Flow Table 1. List of species for which we present new measurements of V·O2,max
Species Taxonomic authority Common name N Order Location
Dromiciops gliroides Thomas 1894 Monito del monte 6F, 8M Microbiotheria Valdivia, Chile
Mustela erminea Linnaeus 1758 Short-tailed weasel (Ermine) 2F Carnivora Western USA
Mustela nivalis Linnaeus 1766 Weasel (least weasel) 1F, 4M Carnivora Poland
Octodon degus Waterhouse 1848 Common degu 11F, 39M Rodentia Chile
Dasyprocta cristata (Desmarest 1816) Agouti Rodentia Brazil
Hydrochaeris hydrochaeris (Linnaeus 1766) Capybara Rodentia Brazil
Tamias minimus (Bachman 1839) Least chipmunk 11F, 26M Rodentia Western USA
Ammospermophilus leucurus (Merriam 1889) White-tailed antelope squirrel 10F, 3M Rodentia Western USA
Otospermophilus beecheyi (Richardson 1829) California ground squirrel 3F, 5M Rodentia Western USA
Callospermophilus lateralis (Say 1823) Golden-mantled ground squirrel 15F, 7M Rodentia Western USA
Urocitellus beldingi (Merriam 1888) Belding’s ground squirrel 10F, 7M Rodentia Western USA
Perognathus parvus (Peale 1848) Great basin pocket mouse 31F, 25M Rodentia Western USA
Chaetodipus penicillatus (Woodhouse 1852) Desert pocket mouse 8F, 11M Rodentia Western USA
Dipodomys ordii Woodhouse 1853 Ord’s kangaroo rat 7F, 6M Rodentia Western USA
Dipodomys merriami Mearns 1890 Merriam’s kangaroo rat 32F, 30M Rodentia Western USA
Dipodomys simulans Merriam 1904 Dulzura kangaroo rat 7F, 7F Rodentia Western USA
Dipodomys panamintinus (Merriam 1894) Panamint kangaroo rat 20F, 11M Rodentia Western USA
Rattus rattus (Linnaeus 1758) Black rat 10F, 8M Rodentia Western USA
Apodemus flavicollis (Melchior 1834) Yellow-necked mouse 13F, 11M Rodentia Poland
Apodemus agrarius (Pallas 1771) Stripe-backed mouse 1F, 3M Rodentia Poland
Lemmiscus curtatus (Cope 1868) Sagebrush vole 3F, 6M Rodentia Western USA
Microtus oeconomus (Pallas 1776) Root vole 6F, 6M Rodentia Poland
Microtus arvalis (Pallas 1778) Common vole 3F Rodentia Poland
Microtus montanus (Peale 1848) Montane vole 11F, 22M Rodentia Western USA
4715 Phylogenetic analysis of mammalian VO2,max
was measured upstream of the wheels and CO2was absorbed prior to O2measurements, so we computed oxygen consumption as:
V·O2= V· (FIO2– FEO2) / (1 – FEO2) . (1) Here,V· is flow rate (STP), FIO2is the fractional content of O2in incurrent gas (0.2095), and FEO2is the fractional content of O2in excurrent gas. Because tests were generally too brief to attain steady-state conditions, we used the ‘instantaneous’ adjustment (Bartholomew et al., 1981) to accurately measure rapid changes in O2. Effective volumes (derived from washout kinetics during rotation) for the four wheels at the flow rates described above were 56, 8.3, 3.1 and 0.9 l, respectively.
To measure V·O2,max, we weighed animals (±0.1 g; ±1 g for California ground squirrels) and placed them into the chamber. A reference reading of unbreathed air was obtained, after which we recorded ‘resting’ O2for several minutes with the wheel locked. Wheel rotation began at low RPM. After animals oriented appropriately, we increased rotation speed approximately every 30 s while monitoring behavior and O2. Rotation was halted when animals were no longer able to maintain position or O2 did not increase with further speed increases. We recorded O2for several minutes during the recovery period and then took a second reference reading. After applying the ‘instantaneous correction’, we calculated V·O2,maxas the highest 1 min running average of O2during the period of forced exercise. All tests were performed at room temperature (18–23°C). Whenever possible, repeated measurements were taken on the same individual, and the highest of the V·O2,maxmeasurements was used in analyses.
Phylogenetic tree construction
We constructed the phylogenetic tree using Mesquite (Maddison and Maddison, 2009) and phylogenetic hypotheses from several previously published studies (Table 2). The basic tree structure is from Meredith et al. (Meredith et al., 2011). Within-clade structure was determined according to the sources listed in Table 2. Arbitrary branch lengths were set according to the method of Pagel (Pagel, 1992). Electronic versions of the tree are available in supplementary material Tables S3 and S4.
Statistical analyses
We first tested for phylogenetic signal in log10body mass and in log10 mass-corrected V·O2,max following Blomberg et al. [see pp. 720–721 (Blomberg et al., 2003)]. In brief, V·O2,maxwas divided by body mass raised to the scaling exponent determined from a regression performed with phylogenetically independent contrasts; this quantity was then log-transformed. We used the PHYSIG_LL.m Matlab program provided by Blomberg et al. (Blomberg et al., 2003) to calculate the K-statistic, the randomization test for phylogenetic
signal based on the mean squared error, and the likelihood of the specified phylogenetic tree (see ‘Phylogenetic tree construction’ above), and an assumed model of Brownian motion-like trait evolution, versusthe likelihood of a star phylogeny. The K-statistic is measured on the interval of zero to infinity and indicates the amount of phylogenetic signal relative to a Brownian motion expectation of 1.00 (Blomberg et al., 2003; Revell et al., 2008). Values below unity indicate less tendency for related species to resemble each other than expected under a Brownian motion model of character evolution, whereas values above one indicate more than expected. It is important to note that values substantially below unity can still be associated with statistically significant phylogenetic signal, based on the randomization test developed by Blomberg and colleagues (Blomberg et al., 2003).
We computed (multiple) regressions in three ways (reviewed in Garland et al., 2005; Lavin et al., 2008): conventional, non-phylogenetic, ordinary least squares (OLS); phylogenetic generalized least squares (PGLS); and regression in which the residuals are modeled as having evolved viaan Ornstein–Uhlenbeck process (RegOU), which is intended to mimic stabilizing selection on the specified phylogenetic tree. Values of r2were calculated using eqn 2.3.16 (p. 32) in Judge et al. (Judge et al., 1985) [see p. 546 of Lavin et al. (Lavin et al., 2008)]. These three models form a continuum between assuming a star phylogeny with no hierarchical structure (OLS), a specified phylogeny (PGLS) and a phylogeny whose branch lengths are altered such that it can take on values intermediate between the star and the original phylogeny, or even become more strongly hierarchical than the original tree (RegOU). The RegOU model contains an additional parameter, d, that estimates the transformation of the phylogenetic tree (Blomberg et al., 2003; Lavin et al., 2008). Hence, its fit can be compared with the OLS or PGLS models by a ln maximum likelihood ratio test, where twice the difference in the ln maximum likelihood is assumed (asymptotically) to be distributed as a χ2with 1 d.f., for which the critical value at α=0.05 is 3.841. Similar tests can be used to compare the fit of models within the OLS, PGLS or RegOU classes when they contain nested subsets of independent variables (e.g. Lavin et al., 2008; Gartner et al., 2010).
[image:4.612.45.564.616.731.2]All regression models included log10body mass as a predictor of log10V·O2,max. Additional candidate independent variables were wheel versustreadmill measurement (WHEEL), a variable coding for clade membership (CLADE2), which subdivided the tree into a total of 12 monophyletic groups (see color coding in Fig. 1), and thus involved 11 dummy variables, and three dummy variables coding for species previously shown to have a high V·O2,maxfor their body size (pronghorn, horse and bat). Although it has been noted that domestic dogs have a relatively high V·O2,max(e.g. Weibel and Hoppeler, 2005), they were not singled out for analysis here
Table 2. List of sources used to construct phylogeny
Order Family Source
Marsupialia Meredith et al., 2008
Cetartiodactyla Prothero and Foss, 2007
Carnivora Bininda-Emonds et al., 2007; Nyakatura and Bininda-Emonds, 2012 Carnivora Canidae Bardeleben et al., 2005
Rodentia Veniaminova et al., 2007; Churakov et al., 2010; Sobrero et al., 2011 Rodentia Sciuridae Harrison et al., 2003; Banbury and Spicer, 2007; Helgen et al., 2009 Rodentia Heteromyidae Alexander and Riddle, 2005; Hafner et al., 2007
Rodentia Cricetidae Robovský et al., 2008
Rodentia Muridae Martin et al., 2000; Michaux et al., 2002; Steppan et al., 2005 Rodentia Cricetidae Chaline and Graf, 1988
because the data set includes three other canids, and canids in general have relatively high V·O2,maxfor their body mass (Weibel et al., 1983; Garland and Huey, 1987; Longworth et al., 1989; Bicudo et al., 1996).
We also considered testing for differences between wild-caught versusdomestic forms. However, we found it problematic to code some species because of a lack of information concerning their origin (e.g. fox, Vulpes vulpes) or ambiguity as to the appropriate category (e.g. some human populations). In the first large-scale comparative study of mammalian V·O2,max, Taylor et al. [see p. 35 (Taylor et al., 1981)] noted that ‘... domestic animals provide the extremes of adaptation for oxygen demand within a size class, and it is interesting to note that the wild animals generally fall midway between these extremes ... For this reason, including the domestic animals in the allometric relationship between V·O2,maxand [body mass] of wild
animals changes the scaling factor little, but does increase the range of the 95% confidence interval for the coefficient and the exponent of the equation.’ Although we did not attempt the comparison in this paper, all of the raw data are presented, so readers can perform such comparisons as desired.
We utilized a model selection approach to objectively choose among models corresponding to different combinations of adaptive hypotheses for each of the regression methods (OLS, PGLS and RegOU) (e.g. see Gartner et al., 2010). For each model, we report the ln maximum likelihood, Akaike information criterion [AIC=(−2×ln maximum likelihood)+(2×number of parameters)], and AIC corrected for small sample size [AICc=(−2×ln maximum likelihood)+(2×p×n/(n–p–1)], where pis the number of parameters and nis the sample size (in these formulations, smaller numbers indicate better-fitting models) (see Burnham and Anderson, 2002). Because AICc converges to AIC with larger sample sizes, it is recommended to always use AICc to select the best model (Burnham and Anderson, 2002). When comparing a series of models, nested or not, the one with the lowest AICc is considered to be the most parsimonious. Note that maximum likelihoods are used for computing AIC and likelihood ratio tests, whereas restricted maximum likelihood (REML) is used for estimating coefficients in the model, such as the allometric scaling exponent. REML estimates of the OU transformation parameter, d, are also reported. All of the regression models were computed using the Matlab Regressionv2.m program (Lavin et al., 2008).
We also calculated an Akaike weight (wi), or model probability,
for each model. For the whole set of models considered, the wisum
to 1. For these models, wiis the probability that model iwould be
selected as the best-fitting model if the data were collected again under identical circumstances. As another way to quantify the strength of evidence, we calculated the evidence ratio (ER) between the best model and each model in the set: ER has a ‘raffle ticket’ interpretation, in the sense that an ER value of 8 means that the best model has 8 tickets, whereas the other model only has one (Anderson, 2008). Another way to say this is that the ER indicates the relative amount of evidence favoring the best model over the others.
Because the wiare probabilities, it is possible to sum these for
models containing given variables to identify the variables that are more strongly represented across all well-supported models and are thus more likely to have important predictive value (Burnham and Anderson, 2002). For instance, if one considers diet (here coded as five categories in the DIET1 variable: 1=carnivore, 2=herbivore, 3=omnivore, 4=insectivore, 5=piscivore), one can calculate the sum of the wiof all the models including diet, and this is the probability
that, of the variables considered, diet would be included in the best approximating model were the data collected again under identical circumstances. This procedure allows one to compare the relative importance of candidate independent variables.
Finally, we used model averaging to estimate the allometric exponent of Mb. For every model, estimated coefficients and standard errors (s.e.) are conditional on the model being correct, but if we are unsure about the model structure (because more than one model has a relatively high AICc), then these estimates should incorporate this source of uncertainty. Therefore, we weighted the allometric exponent estimates from alternative candidate models by the evidence for the respective models (e.g. measured as wi), and averaged across models
(Burnham and Anderson, 2002).
RESULTS
The K-statistic (Blomberg et al., 2003) indicated a high level of phylogenetic signal for log10 body mass (K=1.322), and the DSC
order CLADE2
Mesquite name 1 12 DL_Dromiciops_gliroides 2 12 MR_Macropus_rufus 3 12 BP_Bettongia_penicillata
4 11 CH_Capra_hircus 5 11 CZ_Capra_aegagrus_hircus 6 11 OA_Ovis_aries 7 11 CT_Connochaetes_taurinus 8 11 GG_Gazella_granti 9 11 MK_Madoqua_kirkii 10 11 KD_Kobus_defassa 11 11 NM_Neotragus_moschatus 12 11 TO_Taurotragus_oryx 13 11 BI_Bos_indicus 14 11 BM_Bos_taurus 15 11 AA_Antilocapra_americanus
16 10 TT_Tursiops_truncatus 17 9 SS_Sus_scrofa 18 8 PY_Panthera_leo 19 8 GT_Genetta_tigrina 20 8 HP_Helogale_pervula 21 8 MB_Mungos_mungo 22 8 PV_Phoca_vitulina_richardsi 23 8 MV_Mustela_vison 24 8 ME_Mustela_erminea 25 8 MN_Mustela_nivalis 26 8 TF_Vulpes_vulpes 27 8 CL_Canis_latrans 28 8 TW_Canis_lupus 29 8 CF_Canis_familiaris 30 7 EC_Equus_caballus
31 6 PH_Phyllostomus_hastatus 32 5 H1_Homo_sapiens_Zaire 33 5 HS_Homo_sapiens_European 34 5 H2_Homo_sapiens_Chinese 35 4 OC_Oryctolagus_cuniculus 36 3 OD_Octodon_degus 37 3 DC_Dasyprocta _cristata 38 3 CC_Cavia_cobaya 39 3 HH_Hydrochaeris_hydrochaeris 40 3 TS_Tamias_striatus 41 3 EM_Tamias_merriami 42 3 TM_Tamias_minimus 43 3 AN_Ammospermophilus_leucurus 44 3 BY_Otospermophilus_beecheyi 45 3 SL_Callospermophilus_lateralis 46 3 SB_Urocitellus_beldingi 47 3 ST_Ictidomys_tridecemlineatus 48 2 LS_Liomys_salvini 49 2 HD_Heteromys_desmarestianus 50 2 PP_Perognathus_parvus 51 2 PF_Chaetodipus_fallax 52 2 PT_Chaetodipus_penicillatus 53 2 MG_Microdipodops_megacephalus 54 2 DO_Dipodomys_ordii 55 2 DM_Dipodomys_merriami 56 2 DS_Dipodomys_simulans 57 2 DP_Dipodomys_panamintinus 58 1 PC_Pedetes_capensis 59 1 MU_Meriones_unguiculatus 60 1 RR_Rattus_rattus 61 1 RN_Rattus_norvegicus 62 1 NA_Notomys_alexis 63 1 MM_Mus_domesticus 64 1 MD_Mus_domesticus 65 1 AF_Apodemus_flavicollis 66 1 A9_Apodemus_agrarius 67 1 BT_Baiomys_taylori 68 1 PL_Peromyscus_leucopus
[image:5.612.49.296.68.510.2]69 1 PM_Peromyscus_maniculatus_nebrascensis 70 1 P2_Peromyscus_maniculatus_rufinus 71 1 P3_Peromyscus_maniculatus_sonoriensis 72 1 CA_Mesocricetus_auratus 73 1 CG_Myodes_glareolus 74 1 LC_Lemmiscus_curtatus 75 1 MO_Microtus_oeconomus 76 1 MA_Microtus_arvalis 77 1 MT_Microtus_montanus
4717 Phylogenetic analysis of mammalian VO2,max
randomization test for statistical significance based on the mean squared error was highly significant (P<0.0005). The ln maximum likelihood for the specified phylogeny was −88.40 versus−135.65 for a star phylogeny, thus indicating a much better fit of the former to the data for log10body mass. For log10mass-corrected V·O2,max, the K-statistic was substantially lower (K=0.532), but the randomization test again indicated strong statistical significance (P<0.0005). The ln maximum likelihood for V·O2,maxon the specified phylogeny was 24.38 versus11.79 for a star phylogeny, indicating a better fit of the former.
In all 27 regression models (see supplementary material Table S2 for full results), AICc indicated that the PGLS and RegOU models fit the data better than their OLS (non-phylogenetic) counterparts. Likelihood ratio tests indicated that in all cases, the RegOU models fit the data significantly better than the OLS models (all P<0.03). Stated another way, a model that assumed a star phylogeny was never the most appropriate. These results highlight the importance of accounting for hypothesized phylogenetic relationships in the statistical analyses.
The top three models that accounted for 98% of the cumulative evidence (cumulative wi) are all RegOU models (Table 3). In addition to log10 body mass (included in all models), the most influential independent variables were the indicators coding for the bat (BAT), pronghorn (PRONG) and horse (HORSE). Likewise, P -values associated with BAT, PRONG and HORSE in the top three models were always statistically significant (all P<0.02; and see Fig. 2). These three species have long been viewed as having very high V·O2,maxfor their body mass, but this has not been subjected to formal statistical tests that incorporate phylogenetic information (Thomas and Suthers, 1972; Lindstedt et al., 1991; Jones and Lindstedt, 1993; Weibel and Hoppeler, 2005). Our results with phylogenetically aware analyses confirm that the bat, pronghorn and horse have unusually high aerobic capacity.
The independent variable WHEEL (indicating wheel versus treadmill data collection method) was found in the second-ranked
model, but its cumulative weight across all models was small (only 0.247; supplementary material Table S2). Additionally, the P-value for WHEEL in this model did not approach statistical significance (P=0.48). DIET1 and CLADE2 did not appear in the top three models. The cumulative weight of DIET1 across all models was 0.005 and the cumulative weight of CLADE2 (which, in order of AICc values, does not appear until model 20 of 27) was only 0.000005.
Finally, values from all models were averaged to estimate the allometric scaling exponent: 0.839±0.022 (±s.e.). The corresponding 95% confidence interval is 0.795 to 0.883 (based on degrees of freedom provided by the most inclusive model: d.f.=64).
If one desires a simple equation to predict log10 V·O2,max(in ml O2[STPD] h–1), then the first one in Table 3 can be used:
log10 V·O2,max= 1.2664 + 0.8371 ×
log10body mass + 0.5232 if a bat , (2)
+ 0.7273 if a pronghorn ,
+ 0.5045 if a horse .
where body mass is in grams.
Considering the models that include only body mass, the best fitting one is a PGLS model that provides the following equation (see supplementary material Table S2):
log10 V·O2,max= 1.3295 + 0.8485 × log10body mass . (3) The ordinary least-squares version is:
log10 V·O2,max= 1.2360 + 0.8578 × log10body mass . (4)
DISCUSSION
[image:6.612.47.570.79.311.2]Our findings strongly underscore the importance of utilizing phylogenetically informed statistics when evaluating comparative V·O2,maxdata. Using three versions of a given statistical model (i.e. Table 3. The three best statistical models in our analysis (ranked by AICc; smaller is better)
Independent ln Maximum Mean squared s.e. of the r2for
variable Model dREML likelihood AIC (ML) AICc (ML) error estimate model
log10Body mass, BAT, RegOU 0.5157 37.5766 −61.1531 −59.5299 0.0237 0.1540 0.9615
PRONG, HORSE
log10Body mass, WHEEL, RegOU 0.5240 37.7939 −59.5878 −57.4701 0.0239 0.1546 0.9613
BAT, PRONG, HORSE
log10Body mass, BAT, RegOU 0.6066 33.6792 −55.3585 −54.1585 0.0259 0.1608 0.9526
PRONG
Cumulative Independent
wi wi ER variable Coefficient s.e. F d.f. P
0.6874 0.69 1.0000 Body mass 0.8371 0.0213 1548.85 1,72 1.9704 E–50
BAT 0.5232 0.1894 7.63 1,72 0.0073
PRONG 0.7273 0.1853 15.40 1,72 0.0002
HORSE 0.5045 0.1866 7.31 1,72 0.0086
0.2454 0.93 2.8008 Body mass 0.8425 0.0228 1366.36 1,71 1.4565 E–48
WHEEL 0.0316 0.0447 0.50 1,71 0.4822
BAT 0.5360 0.1920 7.79 1,71 0.0067
PRONG 0.7272 0.1868 15.16 1,71 0.0002
HORSE 0.4962 0.1882 6.95 1,71 0.0102
0.0469 0.98 14.6685 Body mass 0.8515 0.0226 1415.84 1,73 1.5198 E–49
BAT 0.5235 0.2106 6.18 1,73 0.0152
PRONG 0.7043 0.2017 12.19 1,73 0.0008
REML, restricted maximum likelihood; AIC, Akaike information criterion; AICc, AIC corrected for small sample size; ML, maximum likelihood; RegOU, regression in which the residuals are modeled as having evolved viaan Ornstein–Uhlenbeck process; wi, Akaike weight; ER, evidence ratio. BAT, PRONG and HORSE code for bat, pronghorn and horse, respectively; WHEEL codes for data obtained from running wheel respirometers versus
a given set of independent variables), we determined which model (OLS, PGLS or RegOU) best fitted our dataset, based on the Akaike information criterion corrected for small sample size (AICc). log10 Body mass was used in all models; it has been previously shown to have high phylogenetic signal (the tendency for related species to resemble each other), and our estimate of the K-statistic (K=1.322) agrees with this general result. Importantly, mass-corrected V·O2,max also had highly significant phylogenetic signal (P<0.001), but at a lower level (K=0.532), also consistent with previous studies of other physiological traits, such as BMR (Blomberg et al., 2003; Rezende et al., 2004; Rezende and Diniz-Filho, 2012).
The best model (smallest AICc) included body mass, BAT, PRONG and HORSE as independent variables. To identify their relative importance, all independent variables used in the analyses were weighted according to the predictive values of the models (i.e. Akaike weights) in which they appeared, and summed across all models (Burnham and Anderson, 2002) (see supplementary material Table S2). The top three independent variables (not including body mass, which has a relative importance of 100% because it is present in all models) were PRONG, BAT and HORSE. For each of these, there is >95% probability that of all the models considered, these variables will be present in the best model (if data were collected again under identical circumstances). Thus, the very high V·O2,max of bats, pronghorns and horses is substantially different from that of the rest of the included species, supporting the conclusions of several previous studies (e.g. Thomas and Suthers, 1972; Lindstedt et al., 1991; Jones and Lindstedt, 1993; Weibel and Hoppeler, 2005). Although these results might be viewed as largely confirmatory, it is important to note that in conventional statistical analyses, potentially unusual species (coded as dummy variables) are compared with all other species in the data set in an equally weighted fashion, ignoring phylogenetic position. With the methods we used, however, as with phylogenetically independent contrasts (see Garland and Janis, 1993; Garland and Adolph, 1994; Garland and
Ives, 2000; Rezende and Diniz-Filho, 2012), a focal species is, in effect, compared most directly with its nearest relative in the data set, and less directly with species that are further removed in terms of phylogenetic relationships. In other words, the statistical comparisons are performed in a phylogenetically principled fashion. Note that other models, not presented here, may also be of interest. For example, the original reason for studying the capybara (the largest extant rodent) was to test whether the scaling of V·O2,maxmight differ between rodents and other mammals. Conventional statistical analyses of our data set for 77 species indicate that the scaling exponent is not statistically different between rodents and other mammals, but that rodents on average have a lower V·O2,max(whether or not BAT, PRONG and HORSE are included as dummy variables). For Canidae, conventional statistical analyses indicate a higher average V·O2,maxas compared with other mammals (also whether or not BAT, PRONG and HORSE are included as dummy variables). Out of the 27 models, the top four were RegOU models. REML dvalues associated with each model were considerably greater than zero, indicating that some intermediate transformation of the branch lengths (between a star phylogeny and the specified phylogeny) yielded the best fit of the regression model to the V·O2,maxdata. This finding demonstrates phylogenetic signal in mass-corrected V·O2,max. Even after accounting for three species with a particularly high V·O2,max(bat, pronghorn, horse) – two of which are dummy-coded individually for the CLADE2 variable because they are the only member of that lineage included in our data set – CLADE2 was not among the most important variables in the models. As the cumulative weight of CLADE2 is extremely low (<0.001%) and the top three models all indicate the presence of phylogenetic signal in the residuals, we conclude that phylogenetic signal in V·O2,maxcannot be adequately accounted for by modeling differences among the 12 major clades identified for these analyses. Rather, the tendency for related species to have a somewhat similar V·O2,maxis distributed throughout the phylogeny. It is also important to note that all models including only body mass had very low support, and the worst model of all was an OLS regression with only body mass as an independent variable (see supplementary material Table S2).
Diet has been implicated in interspecific differences in metabolic rates, particularly in BMR (e.g. McNab, 1992; Muñoz-Garcia and Williams, 2005; White and Kearney, 2013). This effect is proposed to derive from differences in the nutrient content, digestibility, or predictability and abundance of various food types, which somehow leads to variation in the selective regime that acts on BMR. For example, diets of low caloric value might lead to selection that favors reduced BMR because it lowers the overall energy requirements of an animal. In addition, selection related to diet variation could lead to the evolution of other traits (e.g. gut size, body composition, circulating hormone concentrations) (Konarzewski and Książek, 2013) that affect whole-animal BMR. Diet is also thought to be associated with a suite of other traits, including home range size, which may also show strong phylogenetic signal (Garland et al., 1993; Muñoz-Garcia and Williams, 2005; Rezende et al., 2004). However, we found diet to be of little importance in our analysis of V·O2,max, considering all models (Table 3). It is not clear why diet might be directly related to exercise V·O2,max, but diet is likely related to body size (Rezende et al., 2004), which is accounted for in every model in our analysis. Unsurprisingly, ANOVA of body mass in relation to diet in the 77 ‘species’ in our study indicate statistically significant differences in mass among diet types, irrespective of the assumed model of evolution (Table 4).
Intuitively, differences in measurement technique might be expected to influence such performance measures as V·O2,max(e.g. 2
3 4 5 6 7
0 1 2 3 4 5 6
log10 Body mass (g)
log
10
Maximal O
2
consumption (ml O
2
h
–1)
Kangaroo Canids Humans
Horse
Pronghorn
[image:7.612.54.290.70.266.2]Bat
Fig. 2. Relationship between log10body mass and log10V·O2,maxfor the 77
4719 Phylogenetic analysis of mammalian VO2,max
mice running uphill on treadmills had higher V·O2,max than when running on the level) (Kemi et al., 2002). The species in our study were tested with either traditional treadmill exercise techniques or forced running in enclosed wheel respirometers. In terms of practicality, wheel respirometers offer several advantages over treadmills for measuring exercise V·O2,maxin small (<1 kg) animals. Wheels are smaller, simpler and less expensive than typical treadmills. Most individuals require no training to exercise intensively in a wheel, and many species, particularly rodents, spontaneously run in them. Wheels lack a treadmill’s characteristic interface between rigid walls and moving tread, and hence are less likely to cause injury, particularly at the high speeds typically necessary to elicit V·O2,max. These benefits are substantial, but it is important to verify whether results from wheels are similar to those from treadmills. In our analysis, the variable WHEEL (coding for measurements made using a wheel versusa treadmill) was included in the second-best model (Table 3), but the significance level was not close to 0.05, and the relative importance of WHEEL averaged across all models was quite low. Therefore, we conclude that V·O2,max was not significantly affected by testing using treadmills versus running wheels. We caution, however, that wheel respirometers have thus far been used only for mammals of relatively small body size (1 kg or less) and would likely be too unwieldy for use with large mammals.
We conclude by briefly considering our findings in the context of the decades-old and continuing controversy about the manner in which energy metabolism is – or should be – related to body mass among species of animals (e.g. Kleiber, 1932; McMahon, 1973; Weibel, 1973; Schmidt-Nielsen, 1975; Taylor et al., 1981; Heusner, 1985; McNab, 1988; West et al., 1997; Darveau et al., 2002; West et al., 2002; Chown et al., 2007; Hochachka et al., 2003; Agutter and Wheatley, 2004; Savage et al., 2004; Weibel et al., 2004; Weibel and Hoppeler, 2005; White and Seymour, 2005; White et al., 2009; White and Kearney, 2014). In both vertebrates and invertebrates, the majority of theoretical models of mass scaling of energy metabolism yield a predicted scaling exponent between 2/3 and 3/4, and most of the empirical tests of these models have relied on the very extensive datasets for endotherm BMR (which include hundreds of species of birds and mammals) (White et al., 2006; White et al., 2007) or standard metabolic rate (SMR) in ectotherms. Most analyses of these large BMR or SMR datasets do report interspecific scaling consistent with mass exponents of 2/3 to 3/4 (e.g. Rezende et al., 2004; McKechnie and Wolf, 2004; Chown et al., 2007; White and Kearney, 2013) (but see White et al., 2009).
In contrast, we found a signficantly higher mass scaling exponent for mammalian exercise V·O2,max, averaging 0.839 (±0.022 s.e.) across all models. The species in our study span almost 5 orders of magnitude in mass (7.2 g to 475 kg) and include much of the size range in the mammalian lineage, with the caveat that data are lacking for the largest mammals (e.g. elephants, whales). The most conservative estimate of a 95% confidence interval (CI) for the mass exponent (based on 64 degrees of freedom in the most inclusive model) is 0.795–0.883. That CI excludes the ‘universal scaling
constant’ of 0.75, but includes the value of 0.809 reported for the large mass range of species analyzed by Taylor et al. (Taylor et al., 1981) (see also Garland and Huey, 1987) and is also consistent with several more recent studies of exercise V·O2,maxin mammals (Weibel et al., 2004; Weibel and Hoppeler, 2005; White and Seymour, 2005; White et al., 2008), all of which report scaling exponents significantly greater than 0.75. In other words, the empirical findings are not consistent with the most commonly considered theoretical constructs of relationships between body mass and metabolic rate. These include geometric similarity (predicting scaling to mass2/3) (Heusner, 1985), elastic similarity (derived from biomechanical properties and predicting scaling to mass3/4) (McMahon, 1973), and the recent and widely discussed concept of scaling imposed by the 3-dimensional fractal geometry of nutrient distribution networks (e.g. West et al., 1997; West et al., 2002; Savage et al., 2004), which also predicts scaling to mass3/4across multiple levels of biological organization. It must also be noted that none of our analyses incorporated estimates of measurement error in the independent variables, and so all of them likely underestimate the true allometric scaling exponent (Ives et al., 2007). Empirically, among species of mammals, the allometric variation of V·O2,maxis directly related to the scaling of the total effective surface areas of mitochondria and capillaries [Weibel et al., 2004; Weibel and Hoppeler, 2005 (and references therein)].
Although the idea of a ‘universal scaling constant’ is appealing, our analyses (and several others cited above) indicate that no theoretical model, including the recent fractal geometry concept, adequately describes the scaling of maximal aerobic metabolism in mammals. Moreover, we concur with Darveau et al. (Darveau et al., 2002) that the allometry of V·O2,max is a substantially more rigorous test of scaling ‘laws’ than analyses based on BMR, as the selective factors and sub-organismal mechanisms responsible for whole-animal aerobic metabolism seem far more likely to be driven by the maximal demands upon the system represented by V·O2,max (which sets an upper limit to the intensity of work that can be sustained aerobically) than by the ‘idling’ power requirements respresented by BMR. Indeed, it is arguable that BMR is largely an epiphenomenon, unlikely to experience direct selection except in unusual and rare circumstances (e.g. those emphasizing fasting endurance in resting animals in thermoneutrality, or minimization of heat production of resting animals in hot environments) (see also Careau and Garland, 2012) (but see Lovegrove, 2006).
ACKNOWLEDGEMENTS
We thank M. Springer for an electronic version of the Meredith et al. (Meredith et al., 2011) tree, and both the Mammal Research Institute in Bialowieza, Poland, and the Instituto de Ciencias Ambientales y Evolutivas, Universidad Austral de Chile in Valdivia, Chile, for hosting M.A.C. during part of the study.
AUTHOR CONTRIBUTIONS
[image:8.612.44.567.81.139.2]T.G., M.A.C., E.M.D. and T.H.M. conceived and designed the study, and drafted the article. All authors were involved in the execution of the study, interpretation of the findings and revising the article.
Table 4. ANOVA of body mass in relation to diet (coded in five categories)
Model ln Maximum Mean squared s.e. of the r2for Ffor DIET1
type dREML likelihood AIC (ML) AICc (ML) error estimate model (4 and 72 d.f.) P
OLS −129.5930 271.1850 272.3850 1.8136 1.3467 0.1455 3.0656 0.02169
PGLS −80.9650 173.9300 175.1300 0.5129 0.7161 0.1757 3.8354 0.00699
RegOU 1.0342 −80.9636 175.9270 177.5500 0.5134 0.7165 0.1767 3.8636 0.00671
COMPETING INTERESTS
No competing interests declared.
FUNDING
This study was supported in part by the University of California, Riverside Academic Senate, a Biomedical Research Support Grant from University of California, Davis to J.H.J., a Marie Curie Transfer of Knowledge project BIORESC within the European Commission’s 6th Framework Programme (contract no. MTKD-CT-2005-029957) to M.A.C., a University of São Paulo and Conselho Nacional de Desenvolvimento Científico e Tecnológico – CNPq, Brazil to J.E.P.W.B., the Polish Committee for Scientific Research (2 P04F 01329 to P.A.S.), and National Science Foundation (NSF) IOS-1121273 to T.G.
REFERENCES
Agutter, P. S. and Wheatley, D. N.(2004). Metabolic scaling: consensus or controversy? Theor. Biol. Med. Model.1, 13.
Alexander, L. F. and Riddle, B. R.(2005). Phylogenetics of the new world rodent family Heteromyidae. J. Mammal.86, 366-379.
Anderson, D. R.(2008). Model Based Inference in the Life Sciences: a Primer on Evidence. New York, NY: Springer.
Banbury, J. L. and Spicer, G. S.(2007). Molecular systematics of chipmunks (Neotamias) inferred by mitochondrial control region sequences. J. Mamm. Evol.14, 149-162.
Bardeleben, C., Moore, R. L. and Wayne, R. K.(2005). A molecular phylogeny of the Canidae based on six nuclear loci. Mol. Phylogenet. Evol.37, 815-831.
Bartholomew, G. A., Vleck, D. and Vleck, C. M.(1981). Instantaneous measurements of oxygen consumption during pre-flight warm-up and post-flight cooling in sphingid and saturnid moths. J. Exp. Biol.90, 17-32.
Bicudo, J. E. P. W., Longworth, K. E., Jones, J. H., Taylor, C. R. and Hoppeler, H. (1996). Structural determinants of maximal O2transport in muscles of exercising
foxes. Respir. Physiol.103, 243-251.
Bininda-Emonds, O. R. P., Cardillo, M., Jones, K. E., MacPhee, R. D. E., Beck, R. M. D., Grenyer, R., Price, S. A., Vos, R. A., Gittleman, J. L. and Purvis, A. (2007). The delayed rise of present-day mammals. Nature446, 507-512. Blomberg, S. P., Garland, T., Jr and Ives, A. R.(2003). Testing for phylogenetic
signal in comparative data: behavioral traits are more labile. Evolution57, 717-745. Burnham, K. P. and Anderson, D. R.(2002). Model Selection and Inference: A
Practical Information-Theoritical Approach. New York, NY: Springer-Verlag. Careau, V. and Garland, T., Jr(2012). Performance, personality, and energetics:
correlation, causation, and mechanism. Physiol. Biochem. Zool.85, 543-571. Chaline, J. and Graf, J.(1988). Phylogney of the Arvicolidae (Rodentia): biochemical
and paleontological evidence. J. Mammal.69, 22-33.
Chappell, M. A. and Bachman, G. C.(1995). Aerobic performance in Belding’s ground squirrels, Spermopholis beldingi: variance, ontogeny, and the aerobic capacity model of endothermy. Physiol. Zool.68, 421-442.
Chappell, M. A. and Dlugosz, E. M.(2009). Aerobic capacity and running performance across a 1.6 km altitude difference in two sciurid rodents. J. Exp. Biol. 212, 610-619.
Chappell, M. A. and Snyder, L. R. G.(1984). Biochemical and physiological correlates of deer mouse alpha-chain hemoglobin polymorphisms. Proc. Natl. Acad. Sci. USA81, 5484-5488.
Chappell, M. A., Bachman, G. C. and Odell, J. P.(1995). Repeatability of maximal aerobic performance in Belding’s ground squirrels, Spermophilus beldingi. Funct. Ecol.9, 498-504.
Chappell, M. A., Garland, T., Jr, Rezende, E. L. and Gomes, F. R.(2004). Voluntary running in deer mice: speed, distance, energy costs and temperature effects. J. Exp. Biol.207, 3839-3854.
Chappell, M. A., Garland, T., Jr, Robertson, G. F. and Saltzman, W.(2007). Relationships among running performance, aerobic physiology and organ mass in male Mongolian gerbils. J. Exp. Biol.210, 4179-4197.
Chown, S. L., Marais, E., Terblanche, J. S., Klok, C. J., Lighton, J. R. B. and Blackburn, T. M.(2007). Scaling of insect metabolic rate is inconsistent with the nutrient supply network model. Funct. Ecol.21, 282-290.
Churakov, G., Sadasivuni, M. K., Rosenbloom, K. R., Huchon, D., Brosius, J. and Schmitz, J.(2010). Rodent evolution: back to the root. Mol. Biol. Evol.27, 1315-1326.
Darveau, C.-A., Suarez, R. K., Andrews, R. D. and Hochachka, P. W.(2002). Allometric cascade as a unifying principle of body mass effects on metabolism. Nature417, 166-170.
Dawson, T. J., Mifsud, B., Raad, M. C. and Webster, K. N.(2004). Aerobic characteristics of red kangaroo skeletal muscles: is a high aerobic capacity matched by muscle mitochondrial and capillary morphology as in placental mammals? J. Exp. Biol.207, 2811-2821.
Dlugosz, E. M., Chappell, M. A., McGillivray, D. G., Syme, D. A. and Garland, T., Jr(2009). Locomotor trade-offs in mice selectively bred for high voluntary wheel running. J. Exp. Biol.212, 2612-2618.
Dlugosz, E. M., Harris, B. N., Saltzman, W. and Chappell, M. A.(2012). Glucocorticoids, aerobic physiology, and locomotor behavior in California mice. Physiol. Biochem. Zool.85, 671-683.
Dohm, M. R., Richardson, C. S. and Garland, T., Jr(1994). Exercise physiology of wild and random-bred laboratory house mice and their reciprocal hybrids. Am. J. Physiol.267, R1098-R1108.
Elsner, R. and Ashwell-Erikson, S.(1982). Maximum oxygen consumption of exercising harbor seals. Physiologist25, 279.
Fedak, M. A., Rome, L. and Seeherman, H. J.(1981). One-step N2-dilution technique
for calibrating open-circuit VO2measuring systems. J. Appl. Physiol.51, 772-776.
Garland, T., Jr and Adolph, S. C.(1994). Why not to do two-species comparative studies: limitations on inferring adaptation. Physiol. Zool.67, 797-828.
Garland, T., Jr and Huey, R. B.(1987). Testing symmorphosis: does structure match functional requirements? Evolution41, 1404-1409.
Garland, T., Jr and Ives, A. R.(2000). Using the past to predict the present: confidence intervals for regression equations in phylogenetic comparative methods. Am. Nat.155, 346-364.
Garland, T., Jr and Janis, C. M.(1993). Does metatarsal/femur ratio predict maximal running speed in cursorial mammals? J. Zool. (Lond.)229, 133-151.
Garland, T., Jr, Dickerman, A. W., Janis, C. W. and Jones, J. A.(1993). Phylogenetic analysis of covariance by computer simulation. Syst. Biol.42, 265-292.
Garland, T., Jr, Bennett, A. F. and Rezende, E. L.(2005). Phylogenetic approaches in comparative physiology. J. Exp. Biol.208, 3015-3035.
Gartner, G. E. A., Hicks, J. W., Manzani, P. R., Andrade, D. V., Abe, A. S., Wang, T., Secor, S. M. and Garland, T., Jr(2010). Phylogeny, ecology, and heart position in snakes. Physiol. Biochem. Zool.83, 43-54.
Gaustad, S. E., Rolim, N. and Wisløff, U.(2010). A valid and reproducible protocol for testing maximal oxygen uptake in rabbits. Eur. J. Cardiovasc. Prev. Rehabil.17, 83-88.
Hafner, J. C., Light, J. E., Hafner, D. J., Hafner, M. S., Reddington, E., Roger, D. S. and Riddle, B. R.(2007). Basal clades and molecular systematics of heteromyid rodents. J. Mammal.88, 1129-1145.
Harrison, R. G., Bogdanowicz, S. M., Hoffmann, R. S., Yensen, E. and Sherman, P. W.(2003). Phylogeny and evolutionary history of the ground squirrels (Rodentia: Marmotinae). J. Mamm. Evol.10, 249-276.
Helgen, K. M., Cole, F. R., Helgen, L. E. and Wilson, D. E.(2009). Generic revision in the holarctic ground squirrel genus Spermophilus. J. Mammal.90, 270-305. Heusner, A. A.(1985). Body size and energy metabolism. Annu. Rev. Nutr.5,
267-293.
Hiernaux, J. and Ghesquiere, J.(1981). Statistical methods for studying the relationship between maximum aerobic power and body weight: comparison between Twa and Oto of the lake Tumba area (Zaire). J. Hum. Evol.10, 627-631. Hillman, S. S., Hancock, T. V. and Hedrick, M. S.(2013). A comparative
meta-analysis of maximal aerobic metabolism of vertebrates: implications for respiratory and cardiovascular limits to gas exchange. J. Comp. Physiol. B183, 167-179. Hochachka, P. W., Darveau, C.-A., Andrews, R. D. and Suarez, R. K.(2003).
Allometric cascade: a model for resolving body mass effects on metabolism. Comp. Biochem. Physiol.134A, 675-691.
Hoppeler, H., Lüthi, P., Claassen, H., Weibel, E. R. and Howald, H.(1973). The ultrastructure of the normal human skeletal muscle. A morphometric analysis on untrained men, women and well-trained orienteers. Pflugers Arch.344, 217-232. Ives, A. R., Midford, P. E. and Garland, T., Jr(2007). Within-species variation and
measurement error in phylogenetic comparative methods. Syst. Biol.56, 252-270. Jones, J. H.(1998). Optimization of the mammalian respiratory system: symmorphosis
versus single species adaptation. Comp. Biochem. Physiol.120B, 125-138. Jones, J. H. and Lindstedt, S. L.(1993). Limits to maximal performance. Annu. Rev.
Physiol.55, 547-569.
Kayar, S. R., Hoppeler, H., Lindstedt, S. L., Claassen, H., Jones, J. H., Essen-Gustavsson, B. and Taylor, C. R.(1989). Total muscle mitochondrial volume in relation to aerobic capacity of horses and steers. Pflugers Arch.413, 343-347. Kemi, O. J., Loennechen, J. P., Wisløff, U. and Ellingsen, Ø.(2002). Intensity-controlled treadmill running in mice: cardiac and skeletal muscle hypertrophy. J. Appl. Physiol.93, 1301-1309.
Kleiber, M.(1932). Body size and metabolism. Hilgardia6, 315-353.
Konarzewski, M. and Książek, A.(2013). Determinants of intra-specific variation in basal metabolic rate. J. Comp. Physiol. B183, 27-41.
Lavin, S. R., Karasov, W. H., Ives, A. R., Middleton, K. M. and Garland, T., Jr (2008). Morphometrics of the avian small intestine compared with that of nonflying mammals: a phylogenetic approach. Physiol. Biochem. Zool.81, 526-550. Levine, B. D.(2008). VO2max: what do we know, and what do we still need to know? J.
Physiol.586, 25-34.
Lindstedt, S. L., Hokanson, J. F., Wells, D. J., Swain, S. D., Hoppeler, H. and Navarro, V.(1991). Running energetics in the pronghorn antelope. Nature353, 748-750.
Longworth, K. E., Jones, J. H., Bicudo, J. E. P. W., Taylor, C. R. and Weibel, E. R. (1989). High rate of O2consumption in exercising foxes: large PO2difference drives
diffusion across the lung. Respir. Physiol.77, 263-276.
Lovegrove, B. G.(2006). The power of fitness in mammals: perceptions from the African slipstream. Physiol. Biochem. Zool.79, 224-236.
Lutton, L. M. and Hudson, J. W.(1980). Running performance of the thirteen-lined ground squirrel, the eastern chipmunk, and the albino Norway rat. Comp. Biochem. Physiol.65A, 85-90.
MacMillen, R. E. and Hinds, D. S.(1992). Standard, cold induced and exercise-induced metabolism of rodents. In Mammalian Energetics: Interdisciplinary Views of Metabolism and Reproduction (ed. T. E. Tomasi and T. H. Horton), pp. 16-33. Ithaca, NY: Comstock Publishing Associates.
Maddison, W. P. and Maddison, D. R.(2009). Mesquite: a Modular System for Evolutionary Analysis.http://mesquiteproject.org.
Martin, Y., Gerlach, G., Schlötterer, C. and Meyer, A.(2000). Molecular phylogeny of European muroid rodents based on complete cytochrome b sequences. Mol. Phylogenet. Evol.16, 37-47.
McKechnie, A. E. and Wolf, B. O.(2004). The allometry of avian basal metabolic rate: good predictions need good data. Physiol. Biochem. Zool.77, 502-521. McMahon, T.(1973). Size and shape in biology. Science179, 1201-1204.
McNab, B. K.(1988). Complications inherent in scaling the basal rate of metabolism in mammals. Q. Rev. Biol.63, 25-54.