RESEARCH ARTICLE
Directionality of nose-emitted echolocation calls from bats without
a nose leaf (Plecotus auritus)
Lasse Jakobsen1,*, John Hallam2, Cynthia F. Moss3and Anders Hedenström4
ABSTRACT
All echolocating bats and whales measured to date emit a directional bio-sonar beam that affords them a number of advantages over an omni-directional beam, i.e. reduced clutter, increased source level and inherent directional information. In this study, we investigated the importance of directional sound emission for navigation through echolocation by measuring the sonar beam of brown long-eared bats,
Plecotus auritus.Plecotus auritusemits sound through the nostrils but has no external appendages to readily facilitate a directional sound emission as found in most nose emitters. The study shows that
P. auritus, despite lacking an external focusing apparatus, emits a directional echolocation beam (directivity index=13 dB) and that the beam is more directional vertically (−6 dB angle at 22 deg) than horizontally (−6 dB angle at 35 deg). Using a simple numerical model, we found that the recorded emission pattern is achievable ifP. auritus
emits sound through the nostrils as well as the mouth. The study thus supports the hypothesis that a directional echolocation beam is important for perception through echolocation and we propose that animals with similarly non-directional emitter characteristics may facilitate a directional sound emission by emitting sound through both the nostrils and the mouth.
KEY WORDS: Biosonar, Acoustic signals, Chiroptera, Animal bioacoustics
INTRODUCTION
Organisms throughout the animal kingdom rely on acoustic signals for a wide range of survival behaviours, including communication, territorial defence, predator evasion and navigation (Bradbury and Vehrencamp, 2011). Acoustically guided behaviours are robust under all light conditions, but are also constrained by the transmission properties of sound (Wiley and Richards, 1978). Most bats use echolocation to forage and navigate by emitting high-frequency (short-wavelength) sound pulses and localizing objects in their surroundings from information carried by the returning echoes; the emission and propagation of the echolocation signals thus play a crucial role in how bats perceive their surroundings. Signal energy, frequency and directionality define the active space of bat sonar (in combination with the bats’ hearing threshold and ambient noise levels), i.e. the volume of space over which echoes from objects are
received and processed by the animal. Bats readily adjust sonar signal parameters to suit a given environmental or behavioural context (Jensen and Miller, 1999; Surlykke and Moss, 2000). All bats investigated to date emit sound directionally; that is, sound pressure is highest in front of the bat and the pressure attenuates progressively at increasing off-axis angles (Jakobsen et al., 2013a). The directional emission probably carries a number of advantages for bats. It acts as a spatial filter, reducing echo returns from the periphery and behind the bat, and hence limiting the amount of sensory information that the animal must process. A directional sound beam also adds inherent spatial information, i.e. returning echoes probably originate from the forward direction, and it increases the source-level of the calls by focusing the sound energy in a narrower cone, affording bats a longer detection range (Hartley and Suthers, 1987).
The directionality of any given sound emitter depends on the relationship between the size of the emitter and the sound frequency emitted (Kinsler et al., 2000); a small emitter is less directional than a large emitter, and an emitter of a given size is less directional when radiating low frequencies than high frequencies. The majority of bats emit sound through the open mouth, and the directionality of their emission is probably dictated by the frequency of the emitted call and the size of the open mouth (Strother and Mogus, 1970). However, of the approximately 1000 echolocating bat species, around 300 emit sound through the nostrils, often referred to as ‘nose-emitting’bats. Most prominent amongst the nose emitters are the Phyllostomidae, Rhinolophidae and Hipposideridae, accounting for more than 90% of all known nose-emitting species (Pedersen, 1993; Eick et al., 2005). A common feature for nose-emitting bats is a prominent nasal structure thought to be closely associated with sound emission from the nostrils. Phyllostomid bats have prominent nose leaves, consisting of a lower part immediately surrounding the nostrils and a pronounced lancet extending dorsally, while rhinolophids have a complex horseshoe-like structure surrounding the nostrils (Hartley and Suthers, 1987; Schnitzler and Grinnell, 1977).
Investigations into the function of the phyllostomid nose leaf show that it probably focuses the sonar beam in the vertical plane, accounting for much of the observed vertical directionality (Hartley and Suthers, 1987; Vanderelst et al., 2010). This is also inherently logical if the nostrils are viewed as two closely spaced small sound sources (Strother and Mogus, 1970). If two small emitters are placed close together, the interference pattern between the two will generate a more directional beam than either of the two sources independently, but only in the horizontal plane. The vertical directionality still depends on the size of the individual emitters and any related structure, e.g. a nose leaf. With this in mind, and given the apparent benefits of emitting a directional sound beam, it is intriguing that nose-emitting bat species are found that do not have prominent nose structures, e.g. vespertilionid bats of the genera
Barbastella,PlecotusandCorynorhinus(Pye, 1960; Griffin, 1958).
We hypothesize that all echolocating bats emit a directional beam,
Received 11 October 2017; Accepted 6 December 2017
1Centre for BioRobotics, Department of Biology, University of Southern Denmark,
DK-5230 Odense M, Denmark.2Centre for BioRobotics, Maersk McKinney Moller
Institute, University of Southern Denmark, DK-5230 Odense M, Denmark.3Johns
Hopkins University, Baltimore, MD 21218, USA.4Centre for Animal Movement
Research, Department of Biology, Lund University, 223 62 Lund, Sweden.
*Author for correspondence (lasse@biology.sdu.dk)
L.J., 8496-5576; C.F.M., 0000-0001-6916-0000; A.H., 0000-0002-1757-0945
Journal
of
Experimental
including nose-emitting bats without apparent nose leaves. To test this hypothesis, we investigated whether bats without prominent nasal structures emit directional sound in the vertical plan or whether they radiate sound with limited vertical directionality. To this end, we studied brown long-eared bats (Plecotus auritus) as they foraged by echolocation in a wind tunnel.
MATERIALS AND METHODS
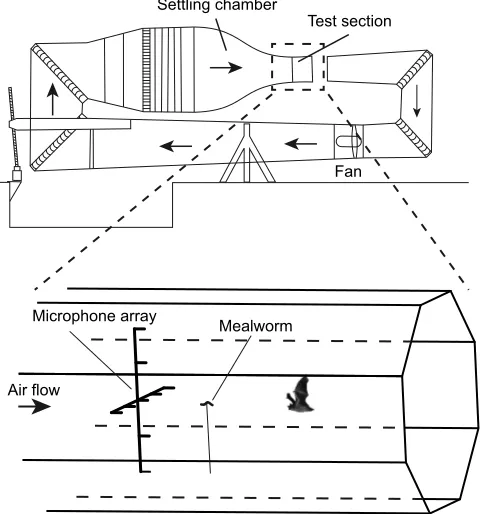
We trained three wild-caughtP. auritus(Linnaeus 1758) to capture mealworms in the wind tunnel at Lund University, Sweden (Pennycuick et al., 1997) over a period of 2 months. In between prey captures, the bats would sit in the settling chamber and fly into the measurement section when presented with an acoustic cue signalling that food was available. The wind speed in the measurement section was set to 1.5 m s−1 for all trials. The
mealworms were fastened to a thin carbon rod (1 mm diameter) located 0.25 m in front of a microphone array consisting of nine 40BF GRAS 1/4 in microphones (GRAS Sound & Vibration A/S, Holte, Denmark), five microphones on a horizontal line and two above and below the middle microphone, all with 0.2 m separation (Fig. 1). The microphones were high-pass filtered at 15 kHz and amplified by 30 dB using Avisoft power modules (Avisoft Bioacostics, Glienicke, Germany), and sounds were digitized at 300 kHz by a 1216H Avisoft USGH A/D converter. We recorded 3 s files, 2 s pre-trigger and 1 s post-trigger. Recordings were manually triggered when the bat attempted to land on the carbon rod. The microphones were calibrated before and after each recording session (full feeding of all three bats) using a B&K sound calibrator (type 4231, Brüel & Kjær, Nærum, Denmark). We also recorded each capture attempt with a Photron SA 1.1 high-speed camera (Tokyo, Japan) at 1000 frames s−1using Bosch Aegis UFLED10-8BD IR
lights (850 nm, 10 deg; Stuttgart, Germany) to illuminate the bats. The study was performed in compliance with approved
experimental guidelines (approved by Malmö–Lund animal ethics committee, M 33-13) and the animals were released at their capture site after the final experiment.
We calculated the location of the bats at the time of each call emission using triangulation of the differences in arrival time of the sound at each of the nine microphones. Given the location of the bats at each call emission, we compensated the recordings on each microphone for spherical spreading loss, atmospheric attenuation (ANSI, 1995) and the directionality of each receiving microphone (Kjær, 1982) by filtering the call with the impulse response of the combined loss (0.1–110 kHz) (Jakobsen et al., 2012). We then calculated the root mean square (RMS) sound pressure of the 95% energy content of a 2 ms window containing the call. We obtained the beam aim for each emission by fitting a second-order polynomial to the RMS sound pressure from each microphone in the horizontal and vertical planes using the peak of the polynomial as a proxy for beam aim. Given the beam aim and the bat’s position, we calculated the angle at which each microphone recorded the call relative to the beam aim, which, combined with the measured RMS pressure, gives us the beam shape in the horizontal and vertical plane. We only used calls aimed within 10 deg of the centre microphone to estimate beam shape. We calculated directionality both for the entire call and at the approximate peak frequencies of the first and second harmonic (40 and 65 kHz) using a third-octave filter centred on the selected frequencies (for details, see Jakobsen et al., 2012).
For each bat, we calculated the directivity index (DI) from the measured beam shape. The DI is a comparison of the measured beam pattern with that of an omnidirectional sound source, i.e. it is a measure of how much intensity increases along the acoustic axis as directionality increases (Møhl et al., 2003):
DI¼10log10 PN 2
i¼1ðbisinðviÞDvÞ
!
; ð1Þ
wherebiis theith value of an interpolation of the measured beam
pattern,viis the angle (between 0 andπradians),Δvis the interval
between the interpolation points andNis the number of values. We obtained the beam interpolation by pooling the measured beam shapes, combining vertical and horizontal measurements, for each bat into 1 deg bins, averaging them and extrapolating out to 180 deg in 1 deg steps using simple linear extrapolation.
Finally, we modelled the beam pattern using five different approaches: (i) a single sound source radiating sound as per the piston model (Strother and Mogus, 1970); (ii) two isotropic sound sources placed as for the two nostrils (Strother and Mogus, 1970): (iii) two directional piston sources placed as for the two nostrils; (iv) three isotropic sound sources placed as for the two nostrils and the mouth; (v) three directional piston sources placed as for the two nostrils and the mouth–this model includes the scenario where the mouth acts as an isotropic source. Models i and ii have simple analytical solutions. Models iii, iv and v were constructed numerically in Matlab (MathWorks, Inc., Natick, MA, USA) by calculating the phase differences between the sources, applying individual directionality to each source and summing the contribution from all sources across a half dome with 1 deg resolution. For each piston sound source, we applied a DI (Urick, 1983):
DI¼20log10ð2pa=lÞ; ð2Þ
whereais the radius of the sound source andλis the wavelength of the emitted sound, to account for the assumed difference in sound
Settling chamber
Test section
Fan
Microphone array
Mealworm
[image:2.612.55.296.446.703.2]Air flow
Fig. 1. Experimental setup.Schematic diagram of the wind-tunnel (adapted
from Pennycuick et al., 1997) and magnification of the test section showing
microphone placement and feeder positioning.
Journal
of
Experimental
energy emitted by the different sources, i.e. larger sources emit more sound. We evaluated the goodness of fit for each model using standardR2statistics:
R2¼1SSres=SStot; ð3Þ
where SSresis the residual sum of squares and SStotis the total sum
of squares.
Model selection was based on the Akaike information criterion (AIC):
AIC¼nlnðSSres=nÞ þ2k; ð4Þ
where n is the number of observations and k is the number of parameters in each model.
RESULTS
We recorded echolocation signals in 214 insect capture sequences from three bats over 5 days. We selected four recordings from each individual where the bats flew in a straight line towards the prey and the majority of the emitted calls (>50%) were aimed within 10 deg of the centre microphone. The video recordings showed no mouth movement connected to call emission or any visible mouth opening before the bat attempted to capture the mealworm (Movie 1).
The bats emitted frequency-modulated calls containing most energy in the second harmonic, with peak frequency at 65±2.9 kHz (Fig. 2). The frequency content of the calls remained relatively unchanged as the bats approached the mealworm {linear regression of target distance versus peak frequency [P≫0.05, for bats 1 and 2; bat 3 shows a slight decrease in peak frequency (PF) as it approaches the target, PF (kHz)=5.2×distance (m)+63,R2=0.15] and−15 dB
bandwidth [P≫0.05 for bats 1 and 3; bat 2 shows a slight decrease in bandwidth (BW) as it approaches the target, BW (kHz)=5×distance (m)+21, R2=0.36]}. Both call duration and
source level decreased continuously from approximately 0.4 m until prey contact. At distances greater than 0.4 m, the bats emitted calls with an average duration of 0.8±0.05 ms and average source level of 79±0.5 dB (RMS at 0.1 m re. 20μPa). From 0.4 m to contact, call duration dropped continuously down to 0.4±0.05 ms and source level dropped continuously to 64±2 dB (RMS at 0.1 m re. 20μPa) (Fig. 3). The low values are calculated as the mean of the lowest 10% duration and source level below 0.4 m. Pulse interval gradually decreased as the bats approached the mealworm, terminating at ca.
20 ms with no apparent plateau at distances great than 0.4 m as seen in call duration and source level. Bats 2 and 3 consistently produced call groups consisting of two or three calls during the approach, while bat 1 did so only rarely. Directionality, like frequency, remained unchanged during the approach, with a DI for the entire call (15–110 kHz) of 12.5±0.5 dB, a DI at 40 kHz of 9.5±0.5 dB and a DI at 65 kHz of 13±1 dB. The beam (15–110 kHz) was more directional in the vertical plane than in the horizontal plane, with a vertical −6 dB angle of 22.0±1.5 deg versus 34.5±4 deg in the horizontal plane (one-sided measure; Fig. 4). This pattern was also present at 65 kHz (vertical−6 dB angle: 19.5±1.5 deg, horizontal
−6 dB angle: 33.5±4 deg) but absent at 40 kHz (vertical −6 dB angle: 45.5±7.5 deg, horizontal−6 dB angle: 43±2.2 deg).
Fitting the five models to the emission pattern at 65 kHz yielded a best fit for model v, with the nostrils as small pistons and the mouth as a point source (R2=0.81; Table 1, Fig. 5). Model v performed
dramatically better than any of the other models. The second-best fit was model iii, the two-piston model (R2=0.59), and it is clear that
the difference in the vertical emission pattern accounted for much of the observed difference between model v and the other four models. The two-point-source model (model ii) performed very poorly, because it is isotropic in the vertical plane. For model v, using three directional pistons, we found similar correlations to the parameters in Table 1 when the mouth was a circular piston with a radius of Time (ms)
Frequency (kHz) 0
Time (ms)
0 1 2 3
1 2
0 20 40 60 80 100
Frequency (kHz)
0 120
40 80
60
20 100
Pressure (Pa)
0.4
–0.4 0.2
–0.2 0
0
–20 –10
–30 –40 10
[image:3.612.322.561.59.419.2]Power (dB)
Fig. 2. Call structure.Oscillogram (top left), frequency spectrum (bottom left)
and spectrogram (right) of an exemplary call emitted during prey capture in the wind tunnel.
0 0.4 0.8 1.2
Duration (ms)
90
80
70
60
40 50
Source level
(dB RMS re. 20
µ
Pa at 0.1 m)
Pulse interval (ms)
0 40 80
60
20 100
0 0.4 0.8 1.2 1.6 2
[image:3.612.51.298.538.701.2]Distance to mealworm (m)
Fig. 3. Prey-capture call parameters.Measured duration, source level and
pulse interval (from call start to call start) as a function of distance to prey. Black, bat 1; cyan, bat 2; blue, bat 3.
Journal
of
Experimental
1 mm (R2=0.81). Given that the two variations of model v
performed equally well, and the bats showed no visible mouth opening during echolocation, we selected the two-piston one-point-source version because it is the most parsimonious model. At 40 kHz, all models performed almost equally, except model ii (two
point sources), again primarily because of its isotropic vertical component (Fig. 5, Table 1).
DISCUSSION
This study shows that brown long-eared bats emit directional echolocation calls in both the horizontal plane and the vertical plane, without any elaborate external structures connected to the nostrils, as seen in many other echolocating bats that emit sonar signals through the nostrils, i.e. nose-emitting bats (e.g. the pronounced lancet in phyllostomid bats). The DI of P. auritus’ sonar beam is comparable to that of other vespertilionid bats (Jakobsen et al., 2013b). It is noteworthy that the directionality of the sonar beam of other vespertilionid bats is roughly the same in the horizontal and vertical planes, while the sonar beam ofP. auritusis clearly more directional in the vertical plane. The same asymmetric directionality of the sonar beam pattern is also observed in other free-flying nose-emitting bats (Brinkløv et al., 2011; Surlykke et al., 2013; Matsuta et al., 2013), but these all have elaborate nose leaves and the vertical directionality is believed to be produced primarily by the lancet (Hartley and Suthers, 1987). It is clear thatP. auritusis not using a similar directional mechanism because this species lacks the nose-leaf structure of other nose-emitting bats. Instead, supported by our modelling, we propose that sound is also radiated from the mouth, and the interference pattern generated between the two nostrils and the mouth generates the observed directionality ofP. auritussonar signals. Our video recordings show no measurable mouth opening; hence, if sound is emitted through the mouth, the emitter size is too small to register with our video recordings, which is in line with our model predicting an isotropic source at the position of the mouth. Furthermore, Griffin (1958) observed a significant reduction in the emitted intensity of echolocation calls produced byCorynorhinus rafinesquii(∼6 dB) when the mouth was covered with a tight layer of collodion, consistent with our hypothesis that sound is radiated from the nostrils and the mouth at the same time to generate the observed beam pattern. Further experiments are needed to determine empirically whether the observed beam pattern is indeed generated by this three-source interference pattern. An obvious setup would be to repeat Griffin’s (1958) approach; if indeed the emitted pattern is generated by interference between sound coming from the two nostrils and the mouth, vertical directionality should diminish substantially when the mouth is covered.
It is clear that the two-point-source model does not adequately explain the emission pattern from nose-emitting bats, mainly 0 deg
30 deg
60 deg 30 deg
60 deg
0 –12 –24 dB
0 deg
60 deg 30 deg 30 deg 60 deg
–24 –12 0 dB
0 –12 –24 dB
–24 –12 0 dB
0 –12 –24 dB
–24 –12 0 dB Entire call
65 kHz
40 kHz
0 deg
30 deg
60 deg 30 deg
60 deg
0 deg
30 deg
60 deg 30 deg
60 deg
0 deg
60 deg 30 deg 30 deg 60 deg
0 deg
[image:4.612.52.298.59.436.2]60 deg 30 deg 30 deg 60 deg
Fig. 4. Measured horizontal and vertical beam pattern for the entire call
(15–110 kHz), and at 65 and 40 kHz.Black, bat 1; cyan, bat 2; blue, bat 3.
Table 1. Model fit parameters at 65 and 40 kHz
Model 65 kHz (40 kHz) R2 AIC re. lowest value Parameters
(i) Piston model 0.58 (0.61) 1631 (57) Horizontala=3 mm (4.4 mm)
Verticala=3.5 mm (4.4 mm)
(ii) Two point sources −0.51 (−0.25) 4386 (1847) Nostril distance=2.6 mm (3.9 mm)
(iii) Two pistons 0.59 (0.61) 1609 (104) Horizontala=2.5 mm (3.7 mm)
Verticala=3.4 mm (4.4 mm) Nostril distance=1.9 mm (2.6 mm)
(iv) Three point sources 0.54 (0.60) 1871 (47) Nostril distance=3.4 mm (5.1 mm)
Mouth–nostril line distance=3.9 mm (4.8 mm)
(v) Two pistons, one point source 0.81 (0.63) 0 (0) Nostrils: horizontala=2.6 mm (3.3 mm)
verticala=4.1 mm (3.0 mm) Nostril distance=2.4 mm (4.0 mm)
Mouth–nostril line distance=6.8 mm (5.0 mm)
The 40 kHz values are given in parentheses.a, piston radius.
Journal
of
Experimental
[image:4.612.48.561.572.727.2]because the vertical plane is isotropic, but also because of the very large side lobes generated if the distance between the two points exceeds half the emitted wavelength. Most sonar beam patterns of free-flying nose-emitting bats measured to date are considerably more directional than the pattern generated by the two-point-source model at λ/2, and none of them show large side lobes in their emission pattern (Brinkløv et al., 2011; Surlykke et al., 2013; Matsuta et al., 2013). Replacing the two isotropic sources with directional piston sources reduces the size of the side lobes substantially and may, as proposed by Vanderelst et al. (2010), explain the horizontal directionality measured from nose-emitting bats. Questions still remain surrounding the vertical directionality, and while it has been shown that the nose leaf plays a key role in shaping the beam (Hartley and Suthers, 1987), there are multiple nose-emitting bats with very small (e.g. bats from the genus Leptonycteris) or highly modified nose leaves (e.g. the vampire bats and the wrinkle-faced bat, Centurio senex). Many phyllostomid species are known to echolocate with the mouth open (Surlykke et al., 2013; Fenton, 2013) and, consequently, variations in the sound emission scheme that we propose may apply to many of these. The relatively simple model that we employ has its limitations; the equivalent piston size of the nostrils clearly exceeds the physical size of the actual nostrils, such that the directional characteristics are greater than those that can be generated by a simple emitter of similar size. As discussed by Pedersen and Müller (2013), many plecotine bats have fleshy masses in connection with the nostrils and these may very well function to increase directionality of the nasal emissions. Future work should be aimed at understanding the mechanisms influencing directionality of the emitted beam pattern from nose-emitting bats, not only those without nose leaves.
In comparison with findings of previous studies ofP. auritus, bats in our study emitted calls with lower intensity and lower duration. Waters and Jones (1995) measured maximum source levels above 90 dB ( peak at 0.1 m re. 20μPa) and durations of 2 ms. This substantial difference is probably caused by the relatively confined space in the wind tunnel and the different behavioural scenarios ( prey capture versus orientation flight). Similar to Waters and Jones (1995), our results show thatP. auritus adjust their echolocation output as they approach the target, lowering the source level and the duration of the calls. Unlike some previous studies ofP. auritusand other gleaning bats, we did not observe any capture attempts in which the bats stopped
echolocating (Anderson and Racey, 1991; Faure and Barclay, 1994), but given the extremely low source levels emitted prior to prey capture (65 dB RMS at 0.1 m. re 20μPa) and the high directionality, it is easy to envisage a scenario where these calls are not detected by the recording equipment.
To the best of our knowledge, this is the first study of echolocation-beam directionality in a gleaning vespertilionid bat. Previously, directionality measurements of the sonar beam patterns of two species of free-flying phyllostomid gleaners (Carollia
perspicillata and Trachops cirrhosis: Brinkløv et al., 2011;
Surlykke et al., 2013) and one megadermatid gleaner (Megaderma lyra: Möhres and Neuweiler, 1966) have been obtained. Both phyllostomids emit very directional echolocation beams (DI≈17 dB) while M. lyra shows roughly the same directionality asP. auritus(DI=12 dB).It has been proposed that gleaning bats emit a narrow echolocation beam to reduce the impact of clutter (Surlykke et al., 2013) and to focus the acoustic signals used by the animal’s sonar receiver on a much smaller area, thus increasing the probability of detecting inconspicuous prey (Dukas, 2004; Brinkløv et al., 2011). However, the current study, in conjunction with results from M. lyra, indicates that a very directional echolocation beam is not needed to glean prey. Given the wind-tunnel setup in our experiment, the bats were effectively chasing a prey item moving at 1.5 m s−1; this may have affected
their echolocation behaviour, potentially evoking the emission of a broader echolocation beam than that evoked by a stationary prey, but given the capture behaviour of the bats (landing on the carbon rod) and the very low air speed, we believe that the sonar calls recorded in this experiment are still representative of a gleaning scenario.
As more studies on echolocation beam directionality emerge, in both bats and whales, it is becoming increasingly apparent that emitting a directional beam is a common element for all echolocators (Au, 1993; Rasmussen et al., 2004; Yovel et al., 2011; Jakobsen et al., 2013a; Wisniewska et al., 2015; Ladegaard et al., 2017). The current study emphasizes this in showing that even bats without an obvious directional emission system, i.e. nose emission without a prominent nose leaf, broadcast a directional sound beam. Our study thus strongly supports the hypothesis that a directional echolocation beam is a key element for perception through echolocation, and we propose that bat species with similar emitter characteristics may also achieve directionality of the sonar beam through simultaneous mouth and nose emission.
Single piston XX Two point sources Two pistons Three point sources
X
X X Two pistons, one point source X
0 –12 –24 dB
–24 –12 0 dB
40 kHz 65 kHz
0 deg
30 deg
60 deg 30 deg
60 deg
0 –12 –24 dB
0 deg
60 deg 30 deg 30 deg
–24 –12 0 dB
4 4 4
4
0 deg
30 deg
60 deg 30 deg
60 deg 60 deg
0 deg
30 deg 30 deg 60 deg
[image:5.612.53.562.56.207.2]60 deg
Fig. 5. Modelled beam pattern fitted to the measurements.The best fit of each model to the measured emission pattern at 40 and 65 kHz. Individual
models are colour coded (see key) and the overall model configuration is indicated with a cross representing a point source and a solid circle representing a piston source.
Journal
of
Experimental
Acknowledgements
We are very grateful to two anonymous reviewers for their useful suggestions to improve the manuscript.
Competing interests
The authors declare no competing or financial interests.
Author contributions
Conceptualization: L.J., A.H.; Methodology: L.J., J.H., C.F.M., A.H.; Software: L.J., J.H.; Formal analysis: L.J.; Investigation: L.J., A.H.; Writing - original draft: L.J.; Writing - review & editing: L.J., J.H., C.F.M., A.H.; Visualization: L.J.; Funding acquisition: L.J., J.H., C.F.M., A.H.
Funding
The establishment of the wind tunnel was made possible by a grant from the Knut och Alice Wallenbergs Stiftelse. The research received support from the Centre for BioRobotics (L.J., J.H.), Det Frie Forskningsråd, Natur og Univers (L.J.), Vetenskapsrådet (A.H.) (621-2012-3585) and the Centre for Animal Movement Research (CAnMove) financed by a Linnaeus grant (349-2007-8690) from Vetenskapsrådet and Lund University (A.H.). C.F.M. worked on this manuscript while participating at the 2017 Kavli Institute for Theoretical Physics Workshop, the Physics of Hearing: From Neurobiology to Information Theory and Back. C.F.M. also received support from Air Force Office of Scientific Research (AFOSR) Center of Excellence (FA9550-14-1-039) and was supported in part by the National Science Foundation under grant no. NSF PHY11-25915.
Supplementary information
Supplementary information available online at
http://jeb.biologists.org/lookup/doi/10.1242/jeb.171926.supplemental
References
Anderson, M. E. and Racey, P. A.(1991). Feeding behaviour of captive brown long-eared bats,Plecotus auritus.Anim. Behav.42, 489-493.
ANSI. (1995). American national standard. Method for the calculation of the absorption of sound by the atmosphere. Standards Secretariat. New York: Acoustical Society of America.
Au, W. W. L.(1993).The Sonar of Dolphins. New York: Springer.
Bradbury, J. W. and Vehrencamp, S. L. (2011). Principles of Animal Communication. Sunderland, MA: Sinauer Associates, Inc.
Brinkløv, S., Jakobsen, L., Ratcliffe, J. M., Kalko, E. K. V. and Surlykke, A.
(2011). Echolocation call intensity and directionality in flying short-tailed fruit bats, Carollia perspicillata(Phyllostomidae).J. Acoust. Soc. Am.129, 427-435.
Dukas, R.(2004). Causes and consequences of limited attention.Brain Behav. Evol.63, 197-210.
Eick, G. N., Jacobs, D. S. and Matthee, C. A.(2005). A nuclear DNA phylogenetic perspective on the evolution of echolocation and historical biogeography of extant bats (chiroptera).Mol. Biol. Evol.22, 1869-1886.
Faure, P. A. and Barclay, R. M. R.(1994). Substrate-gleaning versus aerial-hawking: plasticity in the foraging and echolocation behaviour of the long-eared bat, Myotis evotis.J. Comp. Physiol. A174, 651-660.
Fenton, M. B.(2013). Questions, ideas and tools: lessons from bat echolocation. Anim. Behav.85, 869-879.
Griffin, D. R.(1958).Listening in the Dark, 2nd edn. New York: Yale Univ. Press. 1986 Cornell University.
Hartley, D. J. and Suthers, R. A.(1987). The sound emission pattern and the acoustical role of the noseleaf in the echolocating bat,Carollia perspicillata. J. Acoust. Soc. Am.82, 1892-1900.
Jakobsen, L., Kalko, E. K. V. and Surlykke, A.(2012). Echolocation beam shape in emballonurid bats,Saccopteryx bilineataandCormura brevirostris.Behav. Ecol. Sociobiol.66, 1493-1502.
Jakobsen, L., Brinkløv, S. and Surlykke, A.(2013a). Intensity and directionality of bat echolocation signals.Front. Physiol.4, 89.
Jakobsen, L., Ratcliffe, J. M. and Surlykke, A.(2013b). Convergent acoustic field of view in echolocating bats.Nature493, 93-96.
Jensen, M. E. and Miller, L. A.(1999). Echolocation signals of the batEptesicus serotinusrecorded using a vertical microphone array: effect of flight altitude on searching signals.Behav. Ecol. Sociobiol.47, 60-69.
Kinsler, L. R., Frey, A. R., Coppens, A. B. and Sanders, J. V. (2000). Fundamentals of Acoustics. New York: John Wiley & Sons.
Kjær, B. (1982). Condenser Microphones and Microphone Preamplifiers for Acoustic Measurements. Data Handbook. Nærum, Denmark: Brüel & Kjær.
Ladegaard, M., Jensen, F. H., Beedholm, K., da Silva, V. M. F. and Madsen, P. T.
(2017). Amazon river dolphins (Inia geoffrensis) modify biosonar output level and directivity during prey interception in the wild.J. Exp. Biol.220, 2654-2665.
Matsuta, N., Hiryu, S., Fujioka, E., Yamada, Y., Riquimaroux, H. and Watanabe, Y.(2013). Adaptive beam-width control of echolocation sounds by CF-FM bats, Rhinolophus ferrumequinum nippon, during prey-capture flight.J. Exp. Biol.216, 1210-1218.
Møhl, B., Wahlberg, M., Madsen, P. T., Heerfordt, A. and Lund, A.(2003). The monopulsed nature of sperm whale clicks.J. Acoust. Soc. Am.114, 1143-1154.
Möhres, F. P. and Neuweiler, G.(1966). Die Ultraschallorientierung der Grossblatt-Fledermäuse (Chiroptera - Megadermatidae).JCP53, 195-227.
Pedersen, S. C.(1993). Cephalometric correlates of echolocation in the chiroptera. J. Morphol.218, 85-98.
Pedersen, S. C. and Müller, R.(2013). Nasal-Emission and Nose leaves. InBat Evolution, Ecology, and Conservation(ed. R. A. Adams and S. C. Pedersen), pp. 71-79. New York, NY: Springer New York.
Pennycuick, C. J., Alerstam, T. and Hedenstrom, A.(1997). A new low-turbulence wind tunnel for bird flight experiments at Lund University, Sweden.J. Exp. Biol.
200, 1441-1449.
Pye, J. D.(1960). A theory of echolocation by bats.J. Laryngol. Otol.74, 718-729.
Rasmussen, M. H., Wahlberg, M. and Miller, L. A.(2004). Estimated transmission beam pattern of clicks recorded from free-ranging white-beaked dolphins (Lagenorhyncus albirostris).J. Acoust. Soc. Am116, 1826-1831.
Schnitzler, H.-U. and Grinnell, A. D.(1977). Directional sensitivity of echolocation in the horseshoe bat,Rhinolophus ferrumequinum. I Directionality of sound emission.J. Comp. Physiol. A116, 51-61.
Strother, G. K. and Mogus, M.(1970). Acoustical beam patterns for bats: some theoretical considerations.J. Acoust. Soc. Am.48, 1430-1432.
Surlykke, A. and Moss, C. F.(2000). Echolocation behavior of big brown bats, Eptesicus fuscus, in the field and the laboratory. J. Acoust. Soc. Am. 108, 2419-2429.
Surlykke, A., Jakobsen, L., Kalko, E. K. V. and Page, R. A.(2013). Echolocation intensity and directionality of perching and flying fringe-lipped bats, Trachops cirrhosus (Phyllostomidae).Front. Physiol.4, 143.
Urick, R. J.(1983).Principles of Underwater Sound. New York, NY: Peninsula Publishing.
Vanderelst, D., De Mey, F., Peremans, H., Geipel, I., Kalko, E. K. V. and Firzlaff, U.(2010). What noseleaves do for FM bats depends on their degree of sensorial specialization.PLoS ONE5, e11893 (1)-e11893 (13).
Waters, D. A. and Jones, G.(1995). Echolocation call structure and intensity in five species of insectivorous bats.J. Exp. Biol.198, 475-489.
Wiley, R. H. and Richards, D. G. (1978). Physical constraints on acoustic communication in the atmosphere: implications for the evolution of animal vocalizations.Behav. Ecol. Sociobiol.3, 69-94.
Wisniewska, D. M., Ratcliffe, J. M., Beedholm, K., Christensen, C. B., Johnson, M., Koblitz, J. C., Wahlberg, M. and Madsen, P. T.(2015). Range-dependent flexibility in the acoustic field of view of echolocating porpoises (Phocoena phocoena).Elife4, e05651.
Yovel, Y., Falk, B., Moss, C. F. and Ulanovsky, N.(2011). Active control of acoustic field-of-view in a biosonar system.PLoS Biol.9, e1001150.