RESEARCH ARTICLE
Visual resolution and contrast sensitivity in two benthic sharks
Laura A. Ryan1,2,*, Nathan S. Hart1,2,3, Shaun P. Collin1,2and Jan M. Hemmi1,2ABSTRACT
Sharks have long been described as having‘poor’vision. They are cone monochromats and anatomical estimates suggest they have low spatial resolution. However, there are no direct behavioural measurements of spatial resolution or contrast sensitivity. This study estimates contrast sensitivity and spatial resolution of two species of benthic sharks, the Port Jackson shark,Heterodontus portusjacksoni, and the brown-banded bamboo shark,Chiloscyllium punctatum, by recording eye movements in response to optokinetic stimuli. Both species tracked moving low spatial frequency gratings with weak but consistent eye movements. Eye movements ceased at 0.38 cycles per degree, even for high contrasts, suggesting low spatial resolution. However, at lower spatial frequencies, eye movements were elicited by low contrast gratings, 1.3% and 2.9% contrast inH.portusjacksoniandC. punctatum, respectively. Contrast sensitivity was higher than in other vertebrates with a similar spatial resolving power, which may reflect an adaptation to the relatively low contrast encountered in aquatic environments. Optokinetic gain was consistently low and neither species stabilised the gratings on their retina. To check whether restraining the animals affected their optokinetic responses, we also analysed eye movements in free-swimmingC. punctatum. We found no eye movements that could compensate for body rotations, suggesting that vision may pass through phases of stabilisation and blur during swimming. As C. punctatum is a sedentary benthic species, gaze stabilisation during swimming may not be essential. Our results suggest that vision in sharks is not ‘poor’ as previously suggested, but optimised for contrast detection rather than spatial resolution.
KEY WORDS: Optokinetic eye movements, Contrast sensitivity, Acuity, Spatial resolving power
INTRODUCTION
Sharks are often described as having‘poor’vision. This conclusion is based on their lack of colour vision (Hart et al., 2011; Schluessel et al., 2014) and low spatial resolving power (Hueter, 1990; Lisney and Collin, 2008; Litherland and Collin, 2008). Although they percieve their world through a number of other sensory modalities such as electroreception, olfaction, audition, the mechanosensory lateral line and possibly even magnetoreception (Hueter et al., 2004; Meyer et al., 2005; Gardiner et al., 2012), vision is still important for communication (Ritter and Godknecht, 2000; Martin, 2007), navigation (Parker, 1910; Fuss et al., 2014), as well as the detection and identification of prey and predators (Hobson, 1963;
Gilbert, 1970; Strong, 1996; Hammerschlag et al., 2012; Seamone et al., 2014).
The information content of vision is, to a large extent, determined by the spatial resolving power and contrast sensitivity of the eye (Eckert and Zeil, 2001; Land and Nilsson, 2012). Both contrast sensitivity and spatial resolving power influence an animal’s ability to discriminate objects against a background and affect the distance at which detection can occur (Land, 1999; Eckert and Zeil, 2001). Anatomical estimates of spatial resolving power have been obtained for a number of shark species and range from two to 11 cycles per degree (cpd) (Hueter, 1990; Lisney and Collin, 2008; Litherland and Collin, 2008). However, no estimates of contrast sensitivity or behavioural estimates of spatial resolution currently exist, suggesting that categorising sharks as having ‘poor’vision may be presumptuous. In aquatic environments, absorption and light scattering strongly affect the visual contrast of an object as the distance from the observer increases (Lythgoe, 1980, 1988; McFarland, 1990; Land and Nilsson, 2012). Thus, underwater contrast, rather than spatial resolving power, is often the limiting factor in the early detection and identification of objects. Sharks may trade off spatial resolving power and enhance contrast sensitivity.
The contrast sensitivity function was assessed by measuring eye movements in response to computer-generated optokinetic stimuli in two benthic shark species, Port Jackson sharks, Heterodontus
portusjacksoni(F. A. A. Meyer 1793), and brown-banded bamboo
sharks,Chiloscyllium punctatumJ. P. Müller & Henle 1838. The contrast sensitivity function is an important descriptor of the visual system as it describes contrast sensitivity as a function of spatial frequency (Land, 1999; Eckert and Zeil, 2001; Land and Nilsson, 2012). It therefore measures both spatial resolving power and contrast sensitivity.
Optokinetic experiments used to measure the contrast sensitivity function in a range of vertebrates typically have been based on a striped pattern (grating) on the inside of a rotating drum, which induces reflex eye movements aimed at stabilising the image on the retina (cat, Donaghy, 1980; primates, Miller et al., 1980; opossum, Silveira et al., 1982; chicken, Jarvis et al., 2009; and teleost fish, Fritsches and Marshall, 2002; Rinner et al., 2005). Optokinetic eye movements consist of a slow phase, in which the eyes rotate smoothly in the direction of the stimulus in order to remove the rotational component of optic flow, and a fast phase, in which a saccadic eye movement resets the eye to a more central position, often alternating repeatedly in a rhythmic pattern (Fernald, 1985; Mandecki and Domenici, 2015).
The optokinetic apparatus also provides an opportunity to investigate gaze stabilisation in sharks. Most animals move through their environment and must cope with image motion on the retina, or optic flow, which can lead to optic blur. To reduce optic blur, animals use head, eye and/or body movements to stabilise the image on the retina. A failure to stabilise gaze against background movement reduces both perceived contrast as well as spatial resolving power (Land, 1999, 2015). Eye movements can Received 14 September 2015; Accepted 11 October 2016
1School of Animal Biology, The University of Western Australia, 35 Stirling Highway, Crawley, WA 6009, Australia.2The UWA Oceans Institute, The University of Western Australia, 35 Stirling Highway, Crawley, WA 6009, Australia.3Department of Biological Sciences, Macquarie University, North Ryde, NSW 2109, Australia.
*Author for correspondence ([email protected])
L.A.R., 0000-0002-8981-286X
Journal
of
Experimental
also be used to fixate a moving object on the most sensitive region of the retina (Collewijn, 1977; Frost, 1978; Land, 1999, 2015).
Eye movements in sharks are thought to be controlled through efference copy, a neural mechanism in which a copy of the signal that controls the movement of the tail and body during swimming is sent to the eye muscles, thereby causing eye movements that counteract body rotation (Harris, 1965; Combes et al., 2008; Land, 2015). Sharks have a unique organisation of oculomotor neurones (Graf and Brunken, 1984), suggesting that the optokinetic responses in sharks may differ from other vertebrates. Considering the phylogenetic importance of sharks in that they evolved over 400 million years ago (Miller et al., 2003) and are the oldest living descendants of the first jawed vertebrates, they may represent a phylogenetically conserved design for optokinetic eye movements (Davis et al., 2012). However, to date, no optokinetic responses have been observed in sharks (Masseck and Hoffmann, 2009; Land, 2015). The study speciesH. portusjacksoniandC. punctatumare the most primitive of the modern sharks (galeomorphs) (Shirai, 1992, 1996; Winchell et al., 2004). Understanding contrast sensitivity, spatial resolving power and gaze stabilisation in these species may therefore provide insights into the origins of visual perception in modern sharks and other contemporary vertebrates.
In this study, eye movements of restrained sharks were measured in response to stimuli simulating different forms of self motion: horizontal motion (translation), vertical motion and rotation around the longitudinal body axis (roll). Eye movements were also measured in free-swimmingC. punctatumto assess the effects of restraining the animals and to estimate the impact of motion blur, by calculating the distance at which objects are stabilised on the retina during a swimming cycle.
MATERIALS AND METHODS
Ethics statement and experimental animals
Three captive-bred brown-banded bamboo sharks, C. punctatum
[fork length (FL) 35–40 cm, eye diameter 7.5–9.5 mm], and three wild-caught Port Jackson sharks,H. portusjacksoni(FL 20–30 cm, eye diameter 9.5–11 mm), were used for the optokinetic
experiments. Heterodontus portusjacksoni were held in a large 2800 litre aquarium and C. punctatum were held in a 1000 litre aquarium before and after any experimental procedures. Eye movements in free-swimming individuals were only recorded
from C. punctatum, as they were held in a glass aquarium that
was suitable for the video recordings. The experiments complied with the Western Australia Animal Welfare Act (2002) and were covered by an ethics protocol (RA/3/100/1220), approved by the animal ethics committee of The University of Western Australia.
Optokinetic apparatus
During optokinetic experiments, sharks were gently restrained in a small square tank (30×25 cm) by placing small wooden pegs along the side of the body. The head and tail were secured with flexible plastic straps. A 1 cm clear Perspex plate in front of the shark maintained the animal’s head 5 cm from the front edge of the tank. The tank was positioned in the centre of four radiance-calibrated LCD computer monitors (Dell E2310Hc, Dell Inc.) with the midpoint between the animals’eyes positioned 25 cm away from all monitors (Fig. 1A,B). The monitors had a light intensity of 3.2×10⁻⁵ W sr−1 cm−2, measured using a calibrated light meter
(International Light Technologies, ILT1700). The monitors covered approximately 65 deg of the sharks’vertical visual field and 360 deg of their horizontal field. The visual fields of the species used in this study have not been measured, but the monitors would have covered approximately 68% of the total visual field of a lemon shark
(Negaprion brevirostris), which have comparable eye position to
the species used in this study (McComb et al., 2009).
All visual stimuli were constructed in MATLAB (The MathWorks, Natick, MA, USA) utilising the Psychtoolbox 3 extension (Brainard, 1997; Pelli, 1997). Eye movements were recorded using a Sony Handycam (HDR CX700 or HDR CX550) set to night mode and positioned below the monitor. Infrared LED (850 nm) lights aided the detection of the pupil, without affecting the light intensity perceived by the sharks. Videos were converted to avi format using FFmpeg (git-1654ca7; https://www.ffmpeg.org/) and imported into a custom MATLAB program (J.M.H.; modified
Front
Camera
T1
T2
T2
T1
x
x reye
Top
A
B
C
D
Camera
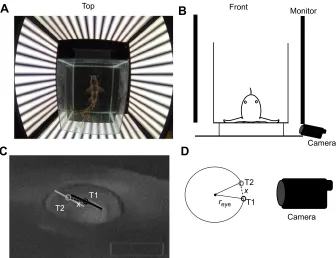
Monitor Fig. 1. Virtual optokinetic drum setup andcalculation of eye movements.(A) Top view
photograph ofChiloscyllium punctatumpositioned at the centre of the virtual drum. The animal is surrounded by four computer monitors with vertical gratings, which move horizontally. (B) Position of the recording camera. The schematic shows a frontal view with the camera positioned underneath a side monitor and focused on the eye. (C) Eye movements were calculated in degrees by comparing the position of the pupil in one frame (T1) with the next frame (T2). (D) The inverse sine of the distance (x) the pupil moved and the radius of the eye (reye) were used to calculate eye movements per
degree.
Journal
of
Experimental
[image:2.612.49.385.478.736.2]from How et al., 2007) to automatically track the position of the pupil. Spatial sampling resolution was half a pixel, equivalent to 0.05 deg in gaze rotation. Eye movements were calculated in degrees by comparing the relative position of the pupil between frames (Fig. 1C,D) and calibrating pixels for absolute size at the plane of the eye. Eye diameter was initially estimated as the maximum diameter of a circle fitted to the exposed eye. These estimates of eye diameter were later confirmed in euthanised individuals. The inverse sine of the distance (x) the pupil moved on screen and the radius of the eye (reye) was used to calculate eye
movements in degrees (Fig. 1C,D). However, these calculations did not take into account the 3D path of the eye’s rotation. However, given the small eye movements of the sharks, the error was estimated to be very small–approximately 0.2% for eye movement of 10 deg.
Experimental procedure
Sharks were acclimated to the experimental setup for 10 min. Each trial tested one particular spatial frequency and contrast combination and consisted of eight 10 s motion segments. Stimulus direction was reversed after each segment. The start direction for each trial (clockwise or anticlockwise) was chosen at random.
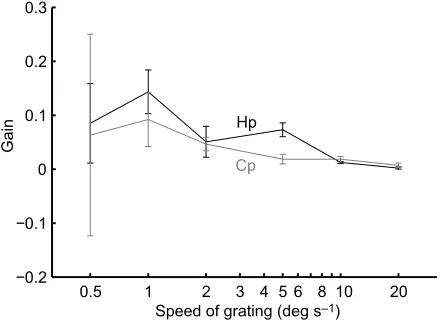
In a pilot study, we tested the ability of sharks to track gratings at different speeds. A vertical sine-wave grating with a spatial frequency of 0.14 cpd and speeds of 0.5, 1, 2, 5, 10, 20 deg s−1
were used to estimate the tracking gain (i.e. the speed of the eye relative to the speed of the stimulus). Speeds were presented in a randomised order. The gain decreased with stimulus speeds above 5 deg s−1; a speed of 2 deg s−1 produced the most consistent
[image:3.612.65.287.533.695.2]eye movements with the highest and most reliable tracking gain (low s.e.m.) in both species and was used for all further experiments (Fig. 2).
Contrast sensitivity and spatial resolution
For each animal, a contrast threshold was determined for every spatial frequency. The contrast threshold was reached when the sharks no longer tracked the stimulus as judged by the fact that recorded eye movements were smaller than during control conditions, which were not expected to elicit stimulus-directed eye movements. For each individual, three different controls were used: (1) a high spatial frequency grating of 5 cpd, which is significantly greater than the anatomical estimates of spatial
resolving power for both species (Harahush et al., 2014; L. Peel, S.P.C. and N.S.H., unpublished data); (2) a stationary grating with a spatial frequency of 0.24 cpd ( preliminary trials suggested that sharks were able to track a grating of this size); and (3) a moving zero contrast grating. At each spatial frequency, contrasts between 100% and 0.5% were tested in a randomised order. Spatial frequencies were tested in 0.1 log10unit steps between 0.017 and
0.640 cpd. The presentation order of spatial frequencies and contrasts within a spatial frequency was randomised.
To determine whether contrast sensitivity was affected by light intensity, the experiment was performed at two average light intensities –3.2×10⁻⁵ W sr−1 cm−2and 3.7×10⁻⁶ W sr−1 cm−2
(International Light Technologies, ILT1700)–adjusted by dimming the brightness of the monitors. At the dimmer light intensity, only two individuals of each species were tested and contrast sensitivity was estimated in 0.2 log10unit steps for spatial frequencies between
0.017 and 0.640 cpd. Pupil size (horizontal extent of the vertical slit pupils) was measured at both light intensities.
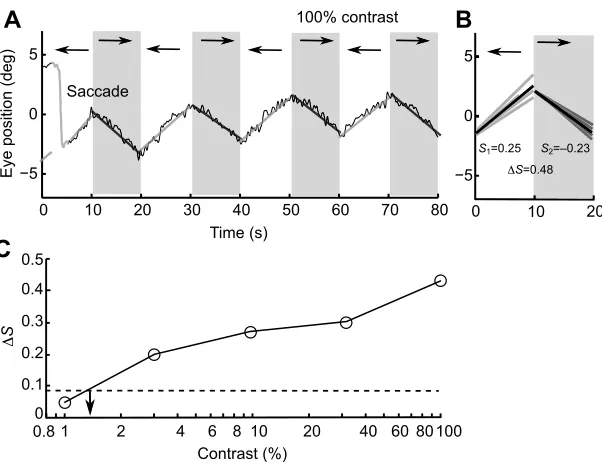
For all stimuli, the centre position of the pupil was tracked at 40 ms intervals over 80 s of stimulus movement (four 10 s segments for each direction). The horizontal component of the eye movement trace was smoothed with a Gaussian filter with a standard deviation of three frames. Large and fast eye movements, which generally represented saccades or other voluntary eye movements (defined as eye velocity that exceeded 2 deg s−1),
were removed to avoid contamination of slow phase eye movements, which represent the visual tracking phase. The remaining track was spliced back together and any offsets at the splice position were removed. If more than 4 s of tracking was removed from a single segment, it was excluded from further analysis. The remaining segments were then fitted by a straight line (Fig. 3A), which corresponds to the average eye velocity. The slopes of all segments that corresponded to the same stimulus direction were averaged to estimate average eye velocity for the clockwise and anticlockwise stimulus directions, respectively (Fig. 3B). Tracking gain was calculated by dividing the average of the absolute eye velocity by the stimulus velocity. The difference between the eye velocity for different stimulus directions was used to determine whether the animals tracked the stimulus. Calculating the difference in eye velocity between alternating stimulus directions made it easier to reject slow drifting eye movements at stimulus thresholds. For each individual, the maximum difference in relative eye velocity between stimulus directions during control conditions was used as the noise threshold to define the presence of tracking. Contrast thresholds were then calculated by interpolating the results to find the contrast at which the difference in eye velocity was equal to the noise threshold (Fig. 3C). Our experimental design of eight 10 s intervals with alternating movement directions helped optimise the sensitivity of our analysis, as it limited the number and impact of saccades on our estimates of optokinetic gain and helped separate random eye movements from stimulus-directed eye movements.
For each individual, a full contrast sensitivity function was calculated as the inverse of threshold contrast at each spatial frequency. The contrast sensitivity function was then averaged across animals. An ANOVA was performed in R (R Foundation for Statistical Computing, Vienna, Austria) to test for differences in peak contrast sensitivity between the two species and between light intensities. Spatial frequencies within 0.1 log10 unit steps of the
highest contrast sensitivity were used to compare peak contrast sensitivity between species and light intensities. Spatial resolution and contrast sensitivity were log10transformed for all analyses to
fulfil the assumption of homogeneity of variance (Zar, 1999). The
0.5 1 2 3 4 5 6 8 10 20 −0.2
−0.1 0 0.1 0.2 0.3
Speed of grating (deg s–1)
Gain
Cp Hp
Fig. 2. Mean±s.e.m. gain of eye movements at different stimulus speeds.
The effect of the speed of the horizontally moving 0.14 cpd vertical sine-wave grating on the gain inHeterodontus portusjacksoni(Hp) andC. punctatum(Cp)
(n=3 for each species).
Journal
of
Experimental
highest spatial frequency at 100% contrast was used as an estimate of the spatial resolving power.
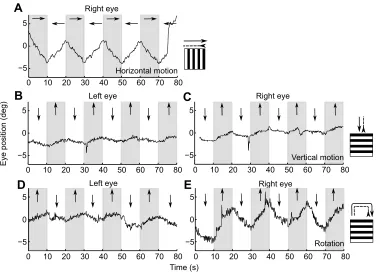
The effect of motion direction on eye movements
To understand the ability of sharks to use eye movements to compensate for motion in different directions, eye movements were recorded in response to three different types of large-field motion. (1) Horizontal motion of vertical sine-wave gratings rotating around the shark, simulating a rotation of the shark around the vertical axis. The horizontal motion stimulus was used to estimate contrast sensitivity. (2) Vertical motion, using a horizontal sine-wave grating that moved simultaneously on all monitors in a vertical direction and simulated visual motion consistent with a shark moving up and down in the water column. And (3) rotation around the longitudinal body axis of the shark (roll). During the presentation of the stimulus, which simulated a roll, horizontal sine-wave gratings were presented on the two monitors positioned along the side of the shark (monitors in front and behind the sharks were blacked out). The gratings moved in an upward direction on one monitor, whilst the gratings on the other monitor moved downwards. For all stimuli, gratings were presented at 100% contrast at two spatial frequencies (0.08 and 0.14 cpd) with a rotation speed of 2 deg s−1.
As a comparison, four horizontally moving vertical black bars on a white background (one bar was presented on each monitor) were used to test the sharks’ability to track object motion. Movement speed was 2 deg s−1 and bar width was set at either 4 or 6 deg
(approximately equivalent to the bar width of a 0.08 and 0.14 cpd grating, respectively). Tracking was assessed as described for the contrast sensitivity experiment.
Eye movements in free-swimming sharks
To determine whether eye movements were affected by restraining the animals, eye movements were also measured in three free-swimming C. punctatum housed in a 0.8×1.5 m clear, rectangular aquarium. Sharks exhibited a large degree of lateral head movement during swimming due to their sinusoidal swimming pattern. Eye movements were recorded on a Sony Handycam (HDR CX700), which was positioned perpendicular to
the swimming direction. Head movements were recorded simultaneously with a second Sony Handycam (HDR CX550), which was positioned directly above the tank. To measure the correlation between eye and body movements during swimming, the two cameras were synchronised to within one frame (error less than 20 ms). For each individual shark, three passes of the camera were analysed. Each pass encompassed approximately one swimming cycle. A swim cycle consisted of a head movement away from the midline to one side of the body. When the head reached the extremity, it then moved to the opposing side of the body before returning back to the midline.
Eye and head movements of free-swimming sharks were analysed as described above. To determine the relative movement of the eye within the head and remove translational motion, an additional marker point on the head next to the eye was tracked and pupil position calculated relative to the marker. Eye size was used to calculate eye movements in degrees (see above). Head rotations were measured with the camera above the tank by automatically tracking the position of the two eyes, which allowed head rotation to be calculated as an angle in the horizontal plane. Because the sharks were at different points in the swimming cycle with each pass of the camera, the correlation between head and eye movements was estimated using cross-correlations. The peak of the cross-correlation trace was normalised. A correlation value of one represented a perfect correlation between head and eye movements, while a value of zero meant no correlation. Cross-correlations from individual recordings were aligned along the time lag of the largest value and averaged.
RESULTS
Contrast sensitivity and spatial resolution
Both species of shark moved their eyes to follow the rotating grating; however, neither species performed a typical optokinetic response characterised by a rhythmic nystagmus (Fernald, 1985; Mandecki and Domenici, 2015). In contrast, saccades were sporadic, occurring at different points in the slow phase rotation, and were equally likely to move in the same direction as the slow phase eye movements as well as the opposite direction (Fig. 3A). Eye movements had a low gain, even during the
0 10 20 30 40 50 60 70 80
−5 0 5
A
0 10 20
100% contrast
Eye position (deg)
Time (s)
−5 0 5
B
1 2 4 6 8 10 20 40 60 80 100 0
0.5
0.8 0.4
0.3
0.2
0.1
Contrast (%)
Δ
S
C
[image:4.612.51.352.55.286.2]S1=0.25 S2=–0.23 ΔS=0.48 Saccade
Fig. 3. Method for calculating average eye movements in order to calculate contrast sensitivity.(A) Eye movement trace fromH. portusjacksoniin response to vertical sine-wave gratings at a spatial frequency of 0.18 cpd at 100% contrast, with a slope, corresponding the velocity of eye movements, fitted to each 10 s segment. The saccade is traced in grey as it was removed from the analysis. A decrease in the eye position represented tracking to the right and increases represent tracking to the left. (B) The eye velocity for each 10 s segment (grey) and average eye velocity (black) when the gratings moved to the left (S1) or right (S2) and the difference between
the average relative eye velocity (ΔS). (C) The difference in relative eye velocity (ΔS) at 0.18 cpd at a range of contrast. The dashed line represents the noise threshold, which was estimated from the control stimuli. The arrow indicates the contrast threshold, calculated as the contrast at which the interpolatedΔSequaled the noise threshold.
Journal
of
Experimental
preliminary speed experiment. A gain of one, which would indicate tracking at the same angular speed as the stimulus, never occurred. Average gain was 0.21 and 0.06 for H. portusjacksoni and
C. punctatum, respectively. For both species, tracking never
completely stabilised gaze.
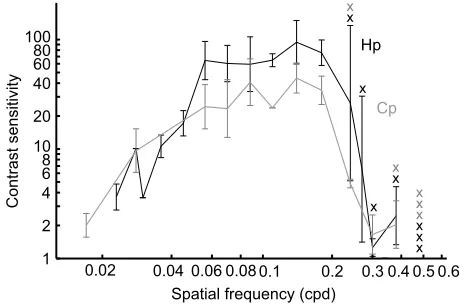
Despite the low gain, eye movements were reliable and increased consistently with grating contrast (Fig. 3C). Based on the threshold contrasts for all spatial frequencies, a contrast sensitivity function was calculated for each species (Fig. 4). Contrast sensitivity increased for both species with spatial frequency until approximately 0.14 cpd, before declining towards higher frequencies. In both species, the threshold for spatial resolving power was 0.38 cpd. No visual tracking occurred at higher spatial frequencies. The peak contrast sensitivity threshold was significantly higher for H. portusjacksonithan for C. punctatum
(contrast sensitivity 75.4 versus 34.6, respectively; ANOVA, contrast sensitivity∼species,F1=8.37,P=0.007).
The approximately 10-fold difference in light intensity was enough to cause a significant increase in the size of the pupil for both species. The horizontal pupil diameter ofC. punctatumincreased from 3.7±0.18 to 7.1±0.92 mm (mean±s.e.m.; t-test, t3=−3.76,
P=0.03) and the horizontal pupil diameter of H. portusjacksoni
increased from 9.7±0.75 to 17.2±0.81 mm (t-test,t3=−4.94,P=0.02)
when the light intensity was decreased. However, light intensity had no significant effect on contrast sensitivities (ANOVA, contrast sensitivity∼species+light intensity,F1=2.71,P=0.11).
Directional sensitivity of eye movements
We used a range of wide-field motion stimuli to determine whether sharks used eye movements to compensate for large-field image motion in different directions. Both H. portusjacksoni and
C. punctatum produced slow but consistent and reliable eye
movements in the direction of the moving gratings (Fig. 5). Both eyes were monitored for responses to the vertically moving stimuli. For both of the vertical motion stimuli, which simulated visual motion consistent with the rising or lowering of the shark in the water column and a rotation around the longitudinal axis of the shark, both eyes were able to follow the gratings, thereby moving in either the same or opposite directions, as required (Fig. 5). Eye movement gain did not vary between the wide-field stimulus conditions (ANOVA, gain∼species+grating, F2=3.01, P=0.07), but H. portusjacksoni
produced eye movements with significantly greater gain (0.21± 0.03 deg s−1, mean±s.e.m.) thanC. punctatum(0.06±0.01 deg s−1)
(ANOVA, gain∼species,F1=29.01,P=<0.0001). During the object
motion stimulus, only one individual ofH. portusjacksoniand one individual ofC. punctatumtracked the object with their gaze.
Eye movements during free-swimming
Chiloscyllium punctatum did not display any compensatory eye
movements to correct for the lateral displacement of the head during sinusoidal swimming (Fig. 6A). A cross-correlation analysis was performed, but showed no evidence of a peak that would indicate a correlation between head and eye movements (Fig. 6B, solid line). Thus, during swimming, sharks would experience retinal slip owing to head movements.
DISCUSSION
Contrast sensitivity and spatial resolution
The benthic sharks H. portusjacksoni and C. punctatum both responded to moving gratings with small but reliable eye movements, which allowed us to accurately estimate their contrast sensitivity function (Fig. 4). Both species had poor spatial resolution (0.38 cpd), but high sensitivity to contrast. Contrast sensitivity in both
H. portusjacksoniandC. punctatumpeaked at a spatial frequency of
0.14 cpd. Heterodontus portusjacksoni was capable of detecting contrast as low as 1.3%, compared with 2.9% in C. punctatum
(Fig. 4). The difference in contrast sensitivity may be attributed toH.
portusjacksonihaving a pure rod retina (Hart et al., 2011; Schieber
et al., 2012) and wider rods thanC. punctatum(Schieber et al., 2012), increasing light sensitivity, which should be beneficial for detecting contrast (Land and Nilsson, 2012). The higher contrast sensitivity in
H. portusjacksoniis thus likely an adaptation to the lower light levels
this species experiences in its temperate environments (McFarland, 1990) compared with C. punctatum, which occupies tropical environments (Last and Stevens, 2009; Froese and Pauly, 2013). However, the sensitivity ofH. portusjacksonito light may come at a cost to temporal resolution (Ryan et al., 2016), rather than acuity, as spatial resolving power is similar in both species.
An almost 10-fold drop in stimulus brightness did not influence contrast sensitivity. The similarity between the contrast sensitivity functions at the two intensities was not unexpected, as in humans, contrast sensitivity has been found to be unaffected by luminance except at the threshold of light sensitivity, when photoreceptor function is sub-optimal (Paulsson and Sjostrand, 1980; Mustonen et al., 1993). The light intensities tested are likely to be within the normal range of intensities experienced by both shark species and reflect light experienced in approximately the first 10–20 m of the water column during the middle of the day (Lythgoe, 1988; Cronin et al., 2014). However, similarity in the contrast sensitivity curves provides confidence about the shape and peak of the contrast sensitivity for the two shark species investigated and suggests the low spatial resolution and low eye movement gain are not due to light sensitivity or photobleaching.
Our estimates of spatial resolving power (0.38 cpd; Fig. 4) were much lower than existing anatomical estimates, i.e. 2.9 cpd inC.
punctatum(Harahush et al., 2014) and 3.1 cpd inH. portusjacksoni
(L. Peel, S.P.C. and N.S.H., unpublished data). Estimates based on retinal ganglion cells tend to overestimate spatial resolving power, as ganglion cell counts often include amacrine cells displaced to the ganglion cell layer and specialised ganglion cells that do not contribute to visual acuity, such as giant ganglion cells (Stell and Witkovsky, 1973; Anctil and Ali, 1974; Stell et al., 1975; Bozzano and Collin, 2000). However, our optokinetic estimates were eight to
0.02 0.04 0.06 0.08 0.1 0.2 0.3 0.4 0.5 0.6 1
2 4 6 8 10 20 40 60 80 100
x x
x
x x x x
x x
x x x
Spatial frequency (cpd)
Contrast sensitivity
Cp
[image:5.612.58.291.532.684.2]Hp
Fig. 4. Comparison of the contrast sensitivity function between
H. portusjacksoni(Hp) andC. punctatum(Cp) at a light intensity of 3.2×10⁻⁵W sr−1cm−2, showing the contrast sensitivity (mean±s.e.m.) at each spatial frequency.The‘X’markers represent an individual that did not
exhibit tracking at a specific spatial frequency.
Journal
of
Experimental
10 times lower than anatomical estimates, a much larger than expected difference (Stell et al., 1975). There are a number of experimental factors that may have led to an underestimation of the optokinetic responses (both gain and resulting estimates of spatial resolution), such as the amount of the visual field the stimulus covered (Wyatt and Pola, 1987), the presence of non-rotating monitor edges (Wyatt and Pola, 1987), the restraint of the animals during the experiment (Dieringer et al., 1983; Gioanni, 1988), as well as a lack of attention towards the stimulus by the animals (Wyatt and Pola, 1987). However, a more likely explanation of the low threshold estimates is that the optomotor system in these species is not sensitive to high spatial frequencies. The optomotor system is designed to counteract image rotations. Estimating image rotations is easiest when viewing distant objects that are less affected by translational self motion and less affected by object motion (distant objects produce, on average, slower retinal speeds). In the underwater environment, distant objects do not contain high spatial frequencies because of the fast degradation of image contrast and blurring with viewing distance (Lythgoe, 1980, 1988; McFarland, 1990; Land and Nilsson, 2012). Low spatial frequency tuning of the optomotor system would therefore allow the system to preferentially ignore close objects (Land, 1999; Eckert and Zeil, 2001). This argument would explain why our results show such a sharp decline in the contrast sensitivity function at spatial frequencies above 0.18 cpd (Fig. 5).
An alternative method to calculate spatial resolving power, which is less affected by the low sensitivity of the optomotor system to high spatial frequencies, has been provided by da Silva Souza et al. (2011). da Silva Souza et al. (2011) have shown that in other vertebrates, the peak of the contrast sensitivity curve (CSpeak)
correlates with the threshold of spatial resolution (SRP):
SRP¼11:47 e2:18log10ðCSpeakÞ: ð1Þ Using Eqn 1, we can estimate the spatial resolving power of both shark species studied to be approximately 1.8 cpd (based on the
peak of the contrast sensitivity curves at 0.14 cpd), which is a much better fit of the anatomical estimates. Further behavioural experiments are clearly needed to resolve this issue.
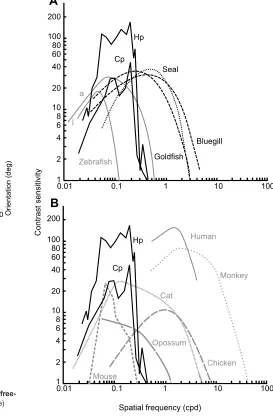
Both H. portusjacksoniand C. punctatumhave relatively low
spatial resolving power in comparison to teleosts, such as the goldfish,Carassius auratus(Northmore and Dvorak, 1979), and the bluegill,Lepomis macrochirus(Northmore et al., 2007) (Fig. 7A), and most other vertebrates (Prusky et al., 2004; Rinner et al., 2005; Tappeiner et al., 2012) (Fig. 7B), but are more sensitive to contrast. Only primates have greater contrast sensitivity (Miller et al., 1980; Schor and Levi, 1980). The rod-dominated retina of sharks (Harahush et al., 2009; Hart et al., 2011; Schieber et al., 2012) may play an important role in increasing contrast sensitivity, but may come at the cost of low spatial resolution. Harbour seals,Phoca
vitulina(Hanke et al., 2011), and goldfish,C. auratus(Northmore
and Dvorak, 1979), both of which are aquatic animals with rod-dominated retinas (Jamieson and Fisher, 1971; Stell and Hárosi, 1976), have contrast sensitivity functions most similar to the sharks studied here, suggesting contrast is of particular importance in aquatic animals.
Eye movements in sharks
Owing to the structure of the marine environment, important visual motion occurs in a number of orientations. Therefore, it is not surprising that the sharks in this study tracked sine-wave gratings simulating different forms of self motion. Our results were equivalent to eye movements recorded from dogfish, Mustelus
californicus, when the sharks were physically moved (Maxwell,
1920). However, when the semicircular canals and otoliths were removed from M. californicus, no compensatory eye movements occurred, suggesting optokinetic responses are exclusively driven by vestibular responses (Maxwell, 1920). Our results on stationary benthic sharks suggest eye movements are not entirely dependent on whole-body movement, but can be elicited purely by visual information.
0 10 20 30 40 50 60 70 80 −5
0 5
Left eye
0 10 20 30 40 50 60 70 80 −5
0 5
Right eye
0 10 20 30 40 50 60 70 80 −5
0 5
Left eye
0 10 20 30 40 50 60 70 80 −5
0 5
Right eye
A
Time (s)
Eye position (deg)
C
B
E
0 10 20 30 40 50 60 70 80 −50 5
Right eye
D
Horizontal motion
Vertical motion
[image:6.612.49.430.57.331.2]Rotation
Fig. 5. Eye movements as a function of stimulus direction.(A) Eye movements of aH. portusjacksoniin response to horizontally moving vertical sine-wave gratings. Arrows demonstrate the horizontal direction (left or right) of the moving grating. For vertical gratings, a decrease in eye position represents movement to the right and an increase in eye position represents movement to the left. (B) Left and (C) right eye movements fromH. portusjacksoniin response to a vertical motion stimulus (horizontal sine-wave grating moving up or down on all monitors simultaneously). For horizontal gratings, a decrease in eye position represents a downward eye movement and an increase represents an upward movement. (D) Left and (E) right eye position fromH. portusjacksoniin response to rotation around the longitudinal body axis of the shark (the horizontal gratings on the two lateral monitors were moved in opposite directions).
Journal
of
Experimental
The eye movements in response to vertical motion stimuli demonstrated that the sharks were capable of rotating their eyes in opposite directions. Our findings support the existence of a monocularly organised oculomotor system in sharks (Maxwell, 1920; Masseck and Hoffmann, 2008). Monocular organisation is more common in animals with laterally positioned eyes as described for some teleost fishes [sandlance, Lymnichthyes fasciatus, and pipefish, Corythoichthyes intestinalis (Fritsches and Marshall, 2002; Pettigrew et al., 1999)] and the chameleon, Chamaleo
chamaleo (Gioanni et al., 1993; Pettigrew et al., 1999). The
contralateral placement of the medial rectus motor neurons in the
midbrain of sharks differs from most vertebrates, which may allow eye movements to be controlled independently (Graf and Brunken, 1984).
One surprising result of our study was the extremely low gain of the optokinetic system. Even the fastest eye movements were much slower than the speed in which the stimuli moved (gain of 0.21 and 0.06 in H. portusjacksoni and C. punctatum, respectively). In contrast, juvenile zebrafish,Danio rerio, are capable of tracking a grating of 2.4 deg s−1with a gain of 0.9 (Easter and Nicola, 1997).
The gain of the sharks was more similar to that of other vertebrates that produce independent eye movements (L. fasciatus, gain=0.52,
1 2 4 6 8 10 20 40 60 80 100
0.01 1 10 100
1 2 4 6 8 10 20 40 60 80 100
0.01 1 10 100
Cat
Monkey
Mouse
Opossum
Chicken Zebrafish
a
j
Bluegill Hp
Cp
Cp
Spatial frequency (cpd)
Contrast sensitivity
B
A
Human
Goldfish 200
Hp
Seal
200
0.1
[image:7.612.54.308.57.454.2]0.1
Fig. 7. Contrast sensitivity functions ofH. portusjacksoni(Hp) and
C. punctatum(Cp) compared with a range of vertebrates.(A) Comparison of sharks at a light intensity of 3.2×10⁻⁵W sr−1cm−2with marine vertebrates
(Northmore and Dvorak, 1979; Rinner et al., 2005; Northmore et al., 2007; Hanke et al., 2011; Tappeiner et al., 2012). Zebrafish measurements were made from optokinetic drum experiments in both adults (a) and juveniles ( j). Harbour seal, goldfish and bluegill contrast sensitivity functions are estimated using other methodologies. (B) Comparison of sharks with other vertebrates (Donaghy, 1980; Miller et al., 1980; Schor and Levi, 1980; Silveira et al., 1982; Prusky et al., 2004; Jarvis et al., 2009). Contrast sensitivity function measurements for these vertebrates were made in optokinetic drum experiments.
Distance (cm)
Time (s)
Time (s) Time (s)
0 –0.1
–0.2 0.1
–0.5 –0.4 –0.3 0.2 0.3 0.4
D
Right eye 50
0
50
100
150
200 Left eye
0 0.6 0.8 1.0 1.2 1.4
0 20
20
1
–1 0 0.5
–0.5
0 0.5 0.9
100
–100 50
–50
100 150 200
A
0 0
5
–5
Orientation (deg)
Cross-correlation
Speed (deg s
–1
) 10
–10
Orientation (deg)
B
C
0.4 0.2
0.5
0.8 0.7 0.6 0.4
0.3 0.2 0.1
Time (s)
[image:7.612.284.557.64.481.2]0 0.1 0.2 0.3 0.4 0.5 0.6 0.7 0.8 0.9
Fig. 6. Analysis of head and eye movements ofC. punctatumduring free-swimming.(A) An example of the head (solid line) and eye (dashed line) movements during a swim cycle. (B) Average cross-correlation for head movements against eye movements. The solid line represents the results of the cross-correlation performed on head movement against the eye movements. To give a sense of scale, the dashed line represents a theoretical example of a shark that fully compensates head rotation with corresponding eye
movements. (C) The average head movement during the sinusoidal swimming (black line) and the average corresponding rotational speed of head movements (grey line). (D) The distance at which an object would not appear blurred forC. punctatumduring free-swimming, based on average head movements. The shaded areas of the left eye (light) and right eye (dark) express the distance that would not be blurred based on a swimming speed of 0.32 m s−1. Objects falling within the clear area close to the shark would be
blurred on the retina. The dashed line represents the midline and dotted lines represent when the midline was crossed.
Journal
of
Experimental
Fritsches and Marshall, 2002; C. chamaleo, gain=0.35, Gioanni et al., 1993).
The low gain may reflect the retinal topography of ganglion cells. Both species of sharks examined in this study have horizontal visual streaks (Harahush et al., 2009; Schieber et al., 2012), which reduces the need to perform large and fast eye movements in order to stabilise objects on the area of the retina with the greatest resolution (Hughes, 1977). However, many species with visual streaks still perform significant eye movements (Hughes, 1971; Harris, 1965). Thus, the low gain of the two shark species may instead relate to their more primitive visual structure (Shirai, 1992, 1996; Winchell et al., 2004) and more modern vertebrates may have developed more specialised optokinetic responses.
Optic blur
In contrast to previous research (Smith, 2006; Osmon, 2008; McComb et al., 2009), free-swimmingC. punctatum showed no evidence of compensatory eye movements, despite strong lateral head rotations. This result is consistent with the low gain found in the drum experiment and means thatC. punctatumwill experience regular periods of optic blur during swimming. The angular velocity (S) of an image that would incur significant blur in the shark’s eye can be calculated based on the receptor acceptance angle (δρ) and the response time of the retina (δτ) (Land, 1999):
S¼ ðdr=dtÞ: ð2Þ
Dividing the acceptance angle (δρ) by the difference in stimulus speed and the speed of the eye movements (S), we can determine the response time necessary to avoid image blur:
dt¼ ðdr=SÞ: ð3Þ
We used Eqn 3 to determine the photoreceptor response time required to avoid image blur in C. punctatum. During the optokinetic experiment, the average angular speed difference between the stimulus and the eye was 1.88 deg s−1. With an
acceptance angle of 2.6 deg and a spatial resolving power of 0.38 cpd, C. punctatum would need to have very slow photoreceptors with a response time of >1000 ms to experience significant motion blur. This response time is much slower than response times measured in other species of sharks (23–35 ms) (McComb et al., 2010). Therefore, it is unlikely C. punctatum
experienced significant image blur during the optokinetic drum experiments.
During free-swimming, the maximum rotational speed at which
C. punctatummoved their heads was 256 deg s−1. To avoid image
blur, during the maximum speed of head rotation, C. punctatum
would need a response time of approximately 10 ms, suggesting that
C. punctatum experienced motion blur during swimming.
Insufficient time to process images causes a loss of valuable spatial and contrast information, thus impeding object detection and recognition. However, motion blur during swimming may be periodic. The forward movement during swimming means that head movements away from the midline will reduce image motion across the retina of the eye leading the rotation by counteracting forward motion. However, as the shark moves the head back towards the midline, the translational and rotational components of image motion across the same retina will combine and increase blur (Harris, 1965; Land, 1999, 2015). Based on a photoreceptor response time of 32 ms (McComb et al., 2010), a swimming speed of 0.32 m s−1 (Ryan et al., 2015), a spatial resolving power of
0.38 cpd and average head rotations (Fig. 6C), objects farther away
than 35 cm would only blur for approximately 10% of the swim cycle (Fig. 6D). However, if spatial resolution was greater than 0.38 cpd, C. punctatum would experience more blur. Using the spatial resolving power estimate of 1.8 cpd, objects farther away than 35 cm would be blurred during 43.9% of the swim cycle. This may be acceptable for a relatively sedentary species such as
C. punctatum, but more active and faster sharks may require greater
compensatory eye movements. One advantage of head movements without compensatory eye movements is in extending the area of the visual field and reducing the blind spot behind the shark (McComb et al., 2009). However, this may be at the expense of periodic blurring. The interactions between swimming, head movements and eye movements are essential in understanding how sharks perceive their visual world, and an assessment of eye movements in a range of free-swimming species of sharks is required, both in the natural environment and with artificial visual stimuli.
In summary, optokinetic drums are a useful method for assessing eye movements and estimating contrast sensitivity and spatial resolving power in benthic sharks. Both species of benthic shark,
H. portusjacksoniandC. punctatum, assessed in this study were very
sensitive to contrast, suggesting that sharks do not have‘poor’vision as once thought, but are optimised to the low-contrast aquatic environment. In addition, the results suggest that some sharks may not completely stabilise gaze, and, when swimming, may go through periods of stabilised and blurred vision, but increase their visual field.
Acknowledgements
We would like to acknowledge Julian Partridge for his insightful comments on the manuscript, and Caroline Kerr, Carl Schmidt, Lucille Chapuis and Ryan Kempster for their help in the maintenance of the animals used in this study.
Competing interests
The authors declare no competing or financial interests.
Author contributions
L.A.R. carried out the experiments, participated in data analysis, conception and design of the study, and drafted the manuscript. N.S.H. and S.P.C. participated in the conception and design of the study, interpretation of the data, and helped draft the manuscript. J.M.H. designed the software used for tracking eye movements, participated in data analysis, conception and design of the study, and interpretation of the data, and helped draft the manuscript.
Funding
We would like to acknowledge the financial support of Western Australia’s State
Government to N.S.H. and S.P.C. Animal acquisition and experimental design was supported by grants from the Sea World Research and Rescue Foundation. J.M.H. was supported by an Australian Research Council Future Fellowship.
References
Anctil, M. and Ali, M. A. (1974). Giant ganglion cells in the retina of the
hammerhead shark (Sphyrna lewini).Vision Res.14, 903-904.
Bozzano, A. and Collin, S. P. (2000). Retinal ganglion cell topography in
elasmobranchs.Brain Behav. Evol.55, 191-208.
Brainard, D. H.(1997). The psychophysics toolbox.Spat. Vision10, 433-436. Collewijn, H.(1977). Eye- and head movements in freely moving rabbits.J. Physiol.
266, 471-498.
Combes, D., Le Ray, D., Lambert, F. M., Simmers, J. and Straka, H.(2008). An
intrinsic feed-forward mechanism for vertebrate gaze stabilization.Curr. Biol.18,
R241-R243.
Cronin, T. W., Johnsen, S., Marshall, N. J. Warrant, E. J.(2014).Visual Ecology. Princeton, NJ: Princeton University Press.
da Silva Souza, G., Gomes, B. D. and Silveira, L. C. L.(2011). Comparative
neurophysiology of spatial luminance contrast sensitivity.Psychol. Neurosci.4,
29-48.
Davis, S. P., Finarelli, J. A. and Coates, M. I.(2012). Acanthodes and shark-like
conditions in the last common ancestor of modern gnathostomes.Nature486,
247-250.
Dieringer, N., Cochran, S. and Precht, W.(1983). Differences in the central
organization of gaze stabilizing reflexes between frog and turtle.J. Comp. Physiol.
A153, 495-508.
Journal
of
Experimental
Donaghy, M.(1980). The contrast sensitivity, spatial resolution and velocity tuning
of the cat’s optokinetic reflex.J. Physiol.300, 353-365.
Easter, S. S. and Nicola, G. N.(1997). The development of eye movements in the
zebrafish (Danio rerio).Dev. Psychobiol.31, 267-276.
Eckert, M. and Zeil, J.(2001). Toward an ecology of motion vision. InMotion Vision:
Computational, Neural, and Ecological Constraints(ed. J. Zeil and J.M. Zanker),
pp. 333-369. Berlin: Springer Verlag.
Fernald, R. D.(1985). Eye movements in the African cichlid fish,Haplochromis
burtoni.J. Comp. Physiol. A156, 199-208.
Fritsches, K. A. and Marshall, N. J.(2002). Independent and conjugate eye
movements during optokinesis in teleost fish.J. Exp. Biol.205, 1241-1252.
Froese, R. and Pauly, D.(ed.) (2013). FishBase. www.fishbase.org.
Frost, B.(1978). The optokinetic basis of head-bobbing in the pigeon.J. Exp. Biol.
74, 187-195.
Fuss, T., Bleckmann, H. and Schluessel, V.(2014). Place learning prior to and after telencephalon ablation in bamboo and coral cat sharks (Chiloscyllium
griseumandAtelomycterus marmoratus).J. Comp. Physiol. A200, 37-52.
Gardiner, J. M., Hueter, R. E., Maruska, K. P., Sisneros, J. A., Casper, B. M., Mann, D. A. and Demski, L. S.(2012). Sensory physiology and behavior of
elasmobranchs. Biology of sharks and their relatives.Mar. Biol.1, 349-401.
Gilbert, P. W.(1970). Studies on the anatomy, physiology, and behavior of sharks.
Final Report.Office Naval Res.401, 104-471.
Gioanni, H.(1988). Stabilizing gaze reflexes in the pigeon (Columba livia).Exp.
Brain Res.69, 567-582.
Gioanni, H., Bennis, M. and Sansonetti, A.(1993). Visual and vestibular reflexes
that stabilize gaze in the chameleon.Vis. Neurosci.10, 947-956.
Graf, W. and Brunken, W. (1984). Elasmobranch oculomotor organization: anatomical and theoretical aspects of the phylogenetic development of
vestibulo-oculomotor connectivity.J. Comp. Neurol.227, 569-581.
Hammerschlag, N., Martin, R. A., Fallows, C., Collier, R. S. and Lawrence, R. (2012). Investigatory behavior toward surface objects and nonconsumptive strikes
on seabirds by white sharks,Carcharodon carcharias, at Seal Island, South Africa
(1997–2010). InGlobal Perspectives on the Biology and Life History of the White
Shark(ed. M. L. Domeier), pp. 91-103. Boca Raton, FL: CRC Press.
Hanke, F. D., Scholtyssek, C., Hanke, W. and Dehnhardt, G.(2011). Contrast
sensitivity in a harbor seal (Phoca vitulina).J. Comp. Physiol. A197, 203-210.
Harahush, B. K., Hart, N. S., Green, K. and Collin, S. P. (2009). Retinal neurogenesis and ontogenetic changes in the visual system of the brown banded
bamboo shark, Chiloscyllium punctatum (Hemiscyllidae, Elasmobranchii).
J. Comp. Neurol.513, 83-97.
Harahush, B. K., Hart, N. S. and Collin, S. P.(2014). Ontogenetic changes in retinal ganglion cell distribution and spatial resolving power in the brown-banded
bamboo sharkChiloscyllium punctatum(Elasmobranchii).Brain Behav. Evol.83,
286-300.
Harris, A. J.(1965). Eye movements of the dogfishSqualus acanthias.J. Exp. Biol.
43, 107-138.
Hart, N. S., Theiss, S. M., Harahush, B. K. and Collin, S. P. (2011).
Microspectrophotometric evidence for cone monochromacy in sharks.
Naturwissenschaften98, 193-201.
Hobson, E. S.(1963). Feeding behavior in three species of sharks.Pac. Sci.17, 171-194.
How, M. J., Zeil, J. and Hemmi, J. M.(2007). Differences in context and function of
two distinct waving displays in the fiddler crab, Uca perplexa (Decapoda:
Ocypodidae).Behav. Ecol. Sociobiol.62, 137-148.
Hueter, R. E.(1990). Adaptations for spatial vision in sharks.J. Exp. Zool.256, 130-141.
Hueter, R. E., Mann, D. A. and Maruska, K. P. (2004). Sensory biology of
elasmobranchs. InBiology of Sharks and Their Relatives(ed. J. A. Musick, J. C.
Carrier and M. R. Heithaus), pp. 325-368. Boca Raton, FL: CRC Press. Hughes, A. (1971). Topographical relationships between the anatomy and
physiology of the rabbit visual system.Doc. Ophthalmol.30, 33-159.
Hughes, A.(1977). The topography of vision in mammals of contrasting life style:
comparative optics and retinal organisation. InThe Visual System in Vertebrates
(ed. F. Crescitelli), pp. 613-756. Berlin; Heidelberg: Springer.
Jamieson, G. S. and Fisher, H. D.(1971). The retina of the harbour seal,Phoca
vitulina.Can. J. Zool.49, 19-23.
Jarvis, J. R., Abeyesinghe, S. M., McMahon, C. E. and Wathes, C. M.(2009). Measuring and modelling the spatial contrast sensitivity of the chicken (Gallus
g. domesticus).Vision Res.49, 1448-1454.
Land, M. F.(1999). Motion and vision: why animals move their eyes.J. Comp.
Physiol. A185, 341-352.
Land, M. F.(2015). Eye movements of vertebrates and their relation to eye form and
function.J. Comp. Physiol. A201, 195-214.
Land, M. F. and Nilsson, D.-E.(2012).Animal Eyes. Oxford: Oxford University Press.
Last, P. R. and Stevens, J. D.(2009).Sharks and Rays of Australia. Collingwood, Australia: CSIRO Publishing.
Lisney, T. J. and Collin, S. P.(2008). Retinal ganglion cell distribution and spatial
resolving power in elasmobranchs.Brain Behav. Evol.72, 59-77.
Litherland, L. and Collin, S. P. (2008). Comparative visual function in elasmobranchs: spatial arrangement and ecological correlates of photoreceptor
and ganglion cell distributions.Vis. Neurosci.25, 549-561.
Lythgoe, J. N.(1980). Vision in fishes: ecological adaptations. InEnvironmental
Physiology of Fishes(ed. M. A. Ali), pp. 431-445. New York: Springer.
Lythgoe, J. N.(1988). Light and vision in the aquatic environment. InSensory
Biology of Aquatic Animals(ed. J. Atema, R. R. Fay, A. N. Popper and W. N.
Tavolga), pp. 57-82. New York: Springer.
Mandecki, J. L. and Domenici, P.(2015). Eye movements are coordinated with
pectoral fin beats during locomotion in a marine teleost fish.J. Exp. Biol.218,
1122-1125.
Martin, R. A.(2007). A review of shark agonistic displays: comparison of display
features and implications for shark–human interactions.Mar. Freshwater Behav.
Physiol.40, 3-34.
Masseck, O. A. and Hoffmann, K.-P.(2008). Responses to moving visual stimuli in
pretectal neurons of the small-spotted dogfish (Scyliorhinus canicula).
J. Neurophysiol.99, 200-207.
Masseck, O. A. and Hoffmann, K.-P.(2009). Comparative neurobiology of the
optokinetic reflex.Ann. N. Y. Acad. Sci.1164, 430-439.
Maxwell, S.(1920). Labyrinth and equilibrium: III. The mechanism of the static
functions of the labyrinth.J. Gen. Physiol.3, 157-162.
McComb, D. M., Tricas, T. C. and Kajiura, S. M.(2009). Enhanced visual fields in
hammerhead sharks.J. Exp. Biol.212, 4010-4018.
McComb, D. M., Frank, T. M., Hueter, R. E. and Kajiura, S. M.(2010). Temporal resolution and spectral sensitivity of the visual system of three coastal shark
species from different light environments.Physiol. Biochem. Zool.83, 299-307.
McFarland, W.(1990). Light in the sea: the optical world of elasmobranchs.J. Exp.
Zool.256, 3-12.
Meyer, C. G., Holland, K. N. and Papastamatiou, Y. P.(2005). Sharks can detect
changes in the geomagnetic field.J. R. Soc. Interface2, 129-130.
Miller, M., Pasik, P. and Pasik, T.(1980). Extrageniculostriate vision in the monkey.
VII. Contrast sensitivity functions.J. Neurophysiol.43, 1510-1526.
Miller, R. F., Cloutier, R. and Turner, S. (2003). The oldest articulated
chondrichthyan from the Early Devonian period.Nature425, 501-504.
Mustonen, J., Rovamo, J. and Näsänen, R.(1993). The effects of grating area and
spatial frequency on contrast sensitivity as a function of light level.Vision Res.33,
2065-2072.
Northmore, D. P. M. and Dvorak, C. A.(1979). Contrast sensitivity and acuity of the
goldfish.Vision Res.19, 255-261.
Northmore, D. P. M., Oh, D.-J. and Celenza, M. A.(2007). Acuity and contrast sensitivity of the bluegill sunfish and how they change during optic nerve
regeneration.Vis. Neurosci.24, 319-331.
Osmon, A.(2008). Investigation of visual fields and visually-mediated behavior in
the bonnethead shark (Sphyrna tiburo). PhD thesis,Department of Psychology,
niversity of South Florida.
Parker, G.(1910).Influence of the Eyes, Ears, and Other Allied Sense Organs on the Movements of the Dogfish, Mustelus canis (Mitchill). Washington, DC: US Government Printing Office.
Paulsson, L. and Sjostrand, J.(1980). Contrast sensitivity in the presence of glare
light.Invest. Ophthalmol. Vis. Sci.19, 401.
Pelli, D. G. (1997). The VideoToolbox software for visual psychophysics:
transforming numbers into movies.Spat. Vision10, 437-442.
Pettigrew, J. D., Collin, S. P. and Ott, M.(1999). Convergence of specialised behaviour, eye movements and visual optics in the sandlance (Teleostei) and the
chameleon (Reptilia).Curr. Biol.9, 421-424.
Prusky, G. T., Alam, N. M., Beekman, S. and Douglas, R. M.(2004). Rapid quantification of adult and developing mouse spatial vision using a virtual
optomotor system.Invest. Ophthalmol. Vis. Sci.45, 4611-4616.
Rinner, O., Rick, J. M. and Neuhauss, S. C. F.(2005). Contrast sensitivity, spatial
and temporal tuning of the larval zebrafish optokinetic response. Invest.
Ophthalmol. Vis. Sci.46, 137-142.
Ritter, E. K. and Godknecht, A. J.(2000). Agonistic displays in the blacktip shark
(Carcharhinus limbatus).Copei2000, 282-284.
Ryan, L. A., Meeuwig, J. J., Hemmi, J. M., Collin, S. P. and Hart, N. S.(2015). It is
not just size that matters: shark cruising speeds are species-specific.Mar. Biol.
162, 1307-1318.
Ryan, L. A., Hemmi, J. M., Collin, S. P. and Hart, N. S.(2016). A shark’s eye view:
motion vision and behaviour in apex predators.PhD thesis, Department of Animal
Biology, University of Western Australia.
Schieber, N. L., Collin, S. P. and Hart, N. S.(2012). Comparative retinal anatomy in
four species of elasmobranch.J. Morphol.273, 423-440.
Schluessel, V., Rick, I. and Plischke, K.(2014). No rainbow for grey bamboo sharks: evidence for the absence of colour vision in sharks from behavioural
discrimination experiments.J. Comp. Physiol. A200, 939-947.
Schor, C. M. and Levi, D. M.(1980). Disturbances of small-field horizontal and
vertical optokinetic nystagmus in amblyopia.Invest. Ophthalmol. Vis. Sci.19,
668-683.
Seamone, S., Blaine, T. and Higham, T. E.(2014). Sharks modulate their escape
behavior in response to predator size, speed and approach orientation.Zoology
117, 377-382.
Journal
of
Experimental
Shirai, S.(1992).Squalean Phylogeny. Sapporo: Hokkaido University Press. Shirai, S.(1996). Phylogenetic interrelationships of neoselachians (Chondrichthyes:
Euselachii).Interrelationsh. Fish.3, 9-34.
Silveira, L. C. L., Picanço-Diniz, C. W. and Oswaldo-Cruz, E.(1982). Contrast
sensitivity function and visual acuity of the opossum.Vision Res.22, 1371-1377.
Smith, K.(2006). Eye movements and the visual field in elasmobranchs. Honours thesis, School of Biomedical Sciences, The University of Queensland. Stell, W. K. and Hárosi, F. I.(1976). Cone structure and visual pigment content in
the retina of the goldfish.Vision Res.16, 647-644.
Stell, W. K. and Witkovsky, P.(1973). Retinal structure in the smooth dogfish, Mustelus canis: general description and light microscopy of giant ganglion cells.
J. Comp. Neurol.148, 1-31.
Stell, W., Detwiler, P., Wagner, H. and Wolbarsht, M.(1975). Giant ganglion cells
in dogfish (Mustelus): Electrophysiology of single on-centre units. InVision in
Fishes. New Approaches in Research(ed. M. A. Ali), pp. 99-112. New York:
Plenum Press.
Strong, W. R.(1996). Shape discrimination and visual predatory tactics in white
sharks. InGreat White Sharks: The Biology of Carcharodon carcharias(ed. A.
Klimley and D. Ainley), pp. 229-240. San Diego, CA: Academic Press. Tappeiner, C., Gerber, S., Enzmann, V., Balmer, J., Jazwinska, A. and Tschopp,
M.(2012). Visual acuity and contrast sensitivity of adult zebrafish.Front. Zool.9,
10.
Winchell, C. J., Martin, A. P. and Mallatt, J.(2004). Phylogeny of elasmobranchs
based on LSU and SSU ribosomal RNA genes.Mol. Phylogenet. Evol. 31,
214-224.
Wyatt, H. J. and Pola, J.(1987). Smooth eye movements with step-ramp stimuli: the
influence of attention and stimulus extent.Vision Res.27, 1565-1580.
Zar, J. H.(1999).Biostatistical Analysis. Upper Saddle River, NJ: Prentice Hall.