Title: Dietary fat, abdominal obesity and smoking modulate the relationship between plasma complement component 3 concentrations and metabolic syndrome risk
Authors: Catherine M Phillips, Emmanuelle Kesse-Guyot, Namanjeet Ahluwalia, Ross McManus, Serge Hercberg, Denis Lairon, Richard Planells, Helen M Roche
PII: S0021-9150(11)01076-8
DOI: doi:10.1016/j.atherosclerosis.2011.11.007
Reference: ATH 12314
To appear in: Atherosclerosis
Received date: 23-6-2011
Revised date: 11-10-2011
Accepted date: 5-11-2011
Please cite this article as: Phillips CM, Kesse-Guyot E, Ahluwalia N, McManus R, Hercberg S, Lairon D, Planells R, Roche HM, Dietary fat, abdominal obesity and smoking modulate the relationship between plasma complement component 3 concentrations and metabolic syndrome risk, Atherosclerosis (2010), doi:10.1016/j.atherosclerosis.2011.11.007
Accepted Manuscript
1 2 3 4 5 6 7 8 9 10 11 12 13 14 15 16 17 18 19 20 21 22 23 24 25 26 27 28 29 30 31 32 33 34 35 36 37 38 39 40 41 42 43 44 45 46 47 48 49 50 51 52 53 54 55 56 57 58 59 60
1
Abstract
1
Objective: Chronic inflammation plays a role in the pathogenesis of metabolic syndrome 2
(MetS) and cardiovascular disease (CVD). Complement component 3 (C3) is a novel 3
cardiometabolic risk factor. Whether dietary fat intake modulates MetS risk conferred by 4
elevated C3 concentrations is unknown. Our objective is to investigate the relationship 5
between C3 concentrations and risk of the MetS and its phenotypes, and to further examine 6
whether dietary fat intake modulates these relationships. 7
M ethods: Biochemical, dietary and lifestyle measurements were determined in the 8
LIPGENE-SU.VI.MAX study of MetS cases and matched controls (n = 1754). 9
Results: Elevated C3 concentrations (> median) were associated with increased risk of 10
impaired insulin sensitivity [OR 1.78, CI 1.34-2.36, P < 0.0001], insulin resistance [OR 1.73, 11
CI 1.31-2.89, P = 0.0001], abdominal obesity [OR 2.15, CI 1.43-3.24, P = 0.0002] and low 12
HDL cholesterol [OR 1.40, CI 1.05-1.86, P = 0.02] compared to low C3 concentrations. 13
Increased MetS risk conferred by elevated C3 concentrations [OR 3.11, 95% CI 2.52-3.82, P 14
< 0.0001] was further accentuated among high dietary fat consumers [OR 4.80, 95% CI 2.77-15
8.33, P < 0.0001] (particularly of saturated [OR 4.05, 95% CI 2.33-7.05, P < 0.0001] and 16
monounsaturated fat [OR 4.48, 95% CI 2.62-7.56, P < 0.0001]), and smokers [OR 3.83, 95% 17
CI 2.12-6.94, P < 0.0001], however this effect was abolished in abdominally lean individuals 18
[OR 1.46, 95% CI 0.69-3.14, P = 0.33]. 19
Conclusions: Dietary fat (intake and composition), abdominal obesity and smoking modulate 20
the relationship between elevated plasma C3 concentrations and MetS risk. 21
Accepted Manuscript
1 2 3 4 5 6 7 8 9 10 11 12 13 14 15 16 17 18 19 20 21 22 23 24 25 26 27 28 29 30 31 32 33 34 35 36 37 38 39 40 41 42 43 44 45 46 47 48 49 50 51 52 53 54 55 56 57 58 59 60
Supplementary key words: Metabolic syndrome, inflammation, cardiovascular risk factors, 1
Accepted Manuscript
1 2 3 4 5 6 7 8 9 10 11 12 13 14 15 16 17 18 19 20 21 22 23 24 25 26 27 28 29 30 31 32 33 34 35 36 37 38 39 40 41 42 43 44 45 46 47 48 49 50 51 52 53 54 55 56 57 58 59 60
Dietary fat, abdominal obesity and smoking modulate the relationship between plasma complement component 3 concentrations and metabolic syndrome risk
Catherine M Phillips a,b, Emmanuelle Kesse-Guyot c, Namanjeet Ahluwalia c, Ross McManus d, Serge Hercberg c,e, Denis Lairon f, Richard Planells f, Helen M Roche a, *
a Nutrigenomics Research Group,UCD Conway Institute, UCD School of Public Health and Population Science, University College Dublin, Ireland
b Dept. of Epidemiology and Public Health, University College Cork, Ireland
c UMR INSERM U557; U1125 INRA; CNAM; Nutritional Epidemiology Research Unit, University of Paris 13, Bobigny, France
d Institute of Molecular Medicine, Trinity College Dublin, Ireland
e Department of Public Health, Avicenne Hospital, Bobigny, France
f INSERM, 476, Lipid nutrients and prevention of metabolic diseases; INRA, 1260;
Université de la Méditerranée, Faculté de Médecine, 27 Bd Jean Moulin, 13385 Marseille Cedex 05, France.
*Address correspondence to Prof. Helen M Roche, Nutrigenomics Research Group, UCD School of Public Health and Population Science, UCD Conway Institute, University College
Dublin, Belfield, Dublin 4, Ireland. E mail: [email protected]
Accepted Manuscript
1 2 3 4 5 6 7 8 9 10 11 12 13 14 15 16 17 18 19 20 21 22 23 24 25 26 27 28 29 30 31 32 33 34 35 36 37 38 39 40 41 42 43 44 45 46 47 48 49 50 51 52 53 54 55 56 57 58 59 60
Running title: Complement component 3, dietary fat and metabolic syndrome
Word count: 3792
Number of tables: 3
Number of figures: 3
Abbreviations:
BMI Body mass index
C3 Complement component 3
CRP C reactive protein
CVD Cardiovascular disease
HOMA Homeostasis model assessment
MetS Metabolic syndrome
MUFA Monounsaturated fatty acid
PUFA Polyunsaturated fatty acid
QUICKI Quantitative insulin-sensitivity check index
SFA Saturated fatty acid
T2DM Type 2 diabetes mellitus
Accepted Manuscript
1 2 3 4 5 6 7 8 9 10 11 12 13 14 15 16 17 18 19 20 21 22 23 24 25 26 27 28 29 30 31 32 33 34 35 36 37 38 39 40 41 42 43 44 45 46 47 48 49 50 51 52 53 54 55 56 57 58 59 60
1. I ntroduction
1
The metabolic syndrome metabolic syndrome (MetS) is a common, multi-component, 2
condition characterised by abdominal obesity, insulin resistance, dyslipidaemia and 3
hypertension, that is associated with increased risk of type 2 diabetes mellitus (T2DM) and 4
cardiovascular disease (CVD) 1. In addition the National Cholesterol EducatiRQ 3URJUDP¶V
5
Adult Treatment Panel III report (NCEP ATP III) identified pro-inflammatory status as being 6
another key MetS characteristic 2. Obesity is a chronic low-grade inflammatory state that 7
predisposes to the development of insulin resistance, the hallmark of obesity and the MetS 3. 8
It has been suggested that insulin resistance and ultimately T2DM may be a manifestation of 9
a chronic acute-phase response 4. Elevated circulating concentrations of complement 10
component 3 (C3), an acute-phase response protein with a central role in the innate immune 11
system, have been associated with insulin resistance, fasting and postprandial triacylglycerol 12
(TAG) concentrations, diabetes, the MetS and CVD 5-8. Adipose tissue has been recognised 13
as an important organ contributing to the inflammatory phenotype and adipocytes are an 14
important source of C3 9. There is a progressive increase in C3 concentrations with BMI in 15
individuals with severe, morbid and extreme obesity 10. C3 concentrations are also elevated in 16
lean and obese diabetic individuals relative to both lean and obese non-diabetic subjects 11. In 17
that study, C3 concentrations correlated with insulin, glucose and insulin resistance, 18
suggesting that metabolic perturbations such as hyperglycaemia and insulin resistance 19
augment C3 mediated inflammation, which is the case for other components of the 20
inflammatory response 12. Although a relationship between plasma C3 concentrations and 21
BMI has been examined, this has not been investigated in the context of the MetS. 22
Genetic and environmental factors contribute to susceptibility to diet-related polygenic 23
disorders such as the MetS. Recently we reported novel genetic associations between C3 24
Accepted Manuscript
1 2 3 4 5 6 7 8 9 10 11 12 13 14 15 16 17 18 19 20 21 22 23 24 25 26 27 28 29 30 31 32 33 34 35 36 37 38 39 40 41 42 43 44 45 46 47 48 49 50 51 52 53 54 55 56 57 58 59 60
environmental factor which may alter MetS risk 14-16. Fasting and postprandial lipid 1
metabolism is disturbed in the MetS 17. The complement system is activated in the 2
postprandial phase and both insulin and chylomicrons stimulate adipocyte C3 production 18, 3
19. However it is not known whether dietary fat intake (either quantity or composition) 4
directly influences C3 activation or modulates C3 concentrations. In addition smoking and 5
physical activity are important cardiometabolic risk factors which may influence MetS risk, 6
but little is known regarding their influence on C3 concentrations, with inconsistent reports 7
perhaps reflective of differences in cohort demographics 20-23. Therefore the aim of this study 8
was to investigate the relationship between plasma C3 concentrations and risk of the MetS 9
and its phenotypes. An additional novel objective was to examine whether this relationship is 10
affected by habitual dietary fat intake and fatty acid composition and other cardiometabolic 11
risk factors including obesity, smoking and physical activity. 12
13
2. M ethods
14
2.1. Subjects, MetS classification and study design 15
This study is part of a prospective case control study of LIPGENE, an EU Sixth 16
Framework Programme Integrated Project HQWLWOHG ³Diet, genomics and the metabolic 17
syndrome: an integrated nutrition, agro-IRRGVRFLDODQGHFRQRPLFDQDO\VLV´Subjects were 18
selected from an existing national French SU.VI.MAX cohort including 13,000 subjects who 19
were followed over 7.5 years (from 1994 to 2002) 24. The LIPGENE-SU.VI.MAX study is a 20
nested case control study of MetS consisting of women (35-60 years of age) and men (45-60 21
years of age) recruited from SU.VI.MAX. Additional approval from the ethical committee, 22
CCPPRB, of Paris-Cochin Hospital included an additional clause (number Am 2840-12-23
Accepted Manuscript
1 2 3 4 5 6 7 8 9 10 11 12 13 14 15 16 17 18 19 20 21 22 23 24 25 26 27 28 29 30 31 32 33 34 35 36 37 38 39 40 41 42 43 44 45 46 47 48 49 50 51 52 53 54 55 56 57 58 59 60
subjects were informed of the study objectives and provided signed informed consent using 1
protocol approved by this ethical committee. Participants were invited to provide a 24 h 2
dietary record every two months, for a total of six records per year as previously described 25. 3
Baseline and 7.5 year follow up data including full clinical examination records were 4
made available to LIPGENE. This data was used to identify cases, individuals who developed 5
HOHPHQts of the MetS, over the 7.5 year follow up period and control subjects. MetS cases 6
were selected based on the NCEP-ATP III criteria for the MetS, with some modifications 26. 7
MetS cases were required to fulfil at least three of the following five criteria: increased waist 8
circumference [>94cm (men) or >80cm (women)], increased fasting blood glucose [
9
PPRO/ RU WUHDWPHQW IRU GLDEHWHV@ LQFUHDVHG 7$* > PPRO/ RU WUHDWPHQW IRU
10
dyslipidaemia], decreased high density lipoprotein cholesterol (HDL-C) [<1.04 mmol/L 11
(men) or < 1.29 mmol/L (women)] and increased systolic/diastolic blood pressure [/85 12
mmHg or antihypertensive treatment]. Cases were defined as both men and women with 3 13
abnormalities, and controls were defined as men and women with no abnormalities or men 14
with 1 abnormality. Cases and controls (n = 1754) were matched according to age (± 5 y), 15
gender and number of dietary records available. For the purpose of the work detailed herein 16
all data relate to the follow-up time point. 17
18
2.2. Biochemical analysis 19
Fasting glucose, TAG, HDL-C and total cholesterol were measured as previously 20
described 24. Insulin and C-peptide were determined by electrochemiluminescence 21
immunoassays (Roche Diagnostics, France). Non-esterified fatty acids (NEFA) and LDL 22
cholesterol (LDL-C) were measured by enzymatic colorimetric methods (Randox 23
Accepted Manuscript
1 2 3 4 5 6 7 8 9 10 11 12 13 14 15 16 17 18 19 20 21 22 23 24 25 26 27 28 29 30 31 32 33 34 35 36 37 38 39 40 41 42 43 44 45 46 47 48 49 50 51 52 53 54 55 56 57 58 59 60
(CRP) were measured on a Dade Behring BN II nephelometer (Dade Behring Diagnostics, 1
Marburg, Germany). Homeostasis model assessment (HOMA), a measure of insulin 2
resistance, was calculated as: [(fasting plasma glucose x fasting serum insulin)/ 22.5] 27. 3
Quantitative insulin-sensitivity check index (QUICKI), a measure of insulin sensitivity, was 4
calculated as = [1/(log fasting insulin + log fasting glucose + log fasting NEFA)] 28. 5
6
2.3. Statistical analysis 7
6WDWLVWLFDODQDO\VLVZDVSHUIRUPHGXVLQJ6$6IRU:LQGRZVYHUVLRQ(SAS Institute,
8
Cary, North Carolina, USA). Data is expressed as means ± SEM. After checking for 9
skewness and kurtosis, glucose, insulin, NEFA, TAG, QUICKI and HOMA were normalised 10
by logarithmic transformation. Plasma C3 concentrations were dichotomised based on control 11
subject median. Logistic regression was used to determine associations between C3 status 12
(</> median) and risk of the MetS and its risk phenotypes (high TAG, low HDL-C, high 13
HOMA, low QUICKI, fasting hyperglycaemia, abdominal obesity and high blood pressure). 14
Cut off points for these MetS risk phenotypes were determined by the MetS criteria. To 15
determine modulation by dietary fat consumption, logistic analyses were repeated using the 16
median of control subjects to dichotomize intakes and to examine associations in low and 17
high consumers (i.e. below and above dietary fat medians). To determine effect modification 18
by abdominal obesity, individuals were stratified according to the waist circumference cut-19
offs employed in the MetS criteria (>94cm (men) or >80cm (women). In a separate analysis 20
individuals were also categorised according to BMI, those with a BMI > 25 kg/m2 were 21
FODVVLILHGDVRYHUZHLJKWLQFOXGLQJREHVHDQGWKRVHZLWKD%0,kg/m2 were defined as
22
lean. To assess the influence of current smoking status on C3 concentrations and MetS risk, 23
Accepted Manuscript
1 2 3 4 5 6 7 8 9 10 11 12 13 14 15 16 17 18 19 20 21 22 23 24 25 26 27 28 29 30 31 32 33 34 35 36 37 38 39 40 41 42 43 44 45 46 47 48 49 50 51 52 53 54 55 56 57 58 59 60
smokers. Similarly for physical activity individuals were categorised as irregularly active and 1
DFWLYH EDVHG RQ WKHLU GDLO\ OHYHO RI SK\VLFDO DFWLYLW\ KRXUGD\ SOXV KRXUGD\. The
2
generalised estimating equation (GEE) linear regression 29 was used to investigate 3
interactions between continuous MetS phenotypes and SFA intake. Potential confounding 4
factors used in the adjusted multivariate analysis included age, gender, energy intake, 5
smoking status, physical activity and use of medications including lipid lowering, 6
hypertension and diabetes treatments. The correlation between variables was verified using 7
6SHDUPDQ¶V FRUUHODWLRQ FRHIILFLHQW )RU DOO DQDO\VHV DP-value of < 0.05 was considered 8
significant. 9
10
3. Results
11
3.1. Associations between plasma C3 concentrations and metabolic characteristics 12
Table 1 details the characteristics of the study population stratified by C3 median 13
concentrations. In terms of their phenotype, individuals with higher plasma C3 concentrations 14
had greater BMI and abdominal obesity (P < 0.0001), displayed numerous metabolic 15
perturbations (elevated insulin concentrations, lower QUICKI and higher HOMA, P < 16
0.0001), were more dyslipidaemic (higher TAG, NEFA, LDL-C and total cholesterol and 17
lower HDL-C concentrations, P < 0.0001), more hypertensive (P < 0.0001) and had higher 18
CRP concentrations (P < 0.0001) compared to individuals with low C3 concentrations. Not 19
surprisingly, more MetS cases comprised the top 50th percentile of C3 concentrations. No 20
differences were observed between groups with respect to age, gender distribution, dietary 21
fatty acid profiles, smoking status and physical activity concentrations. Correlation analysis 22
verified the reported associations. C3 concentrations were significantly and positively 23
Accepted Manuscript
1 2 3 4 5 6 7 8 9 10 11 12 13 14 15 16 17 18 19 20 21 22 23 24 25 26 27 28 29 30 31 32 33 34 35 36 37 38 39 40 41 42 43 44 45 46 47 48 49 50 51 52 53 54 55 56 57 58 59 60
0.43, P < 0.0001), insulin (r = 0.41, P < 0.0001), insulin resistance (r = 0.41, P < 0.0001), 1
waist circumference (r = 0.40, P < 0.0001), BMI (r = 0.40, P < 0.0001), TAG (r = 0.34, P < 2
0.0001), systolic and diastolic blood pressure (r = 0.34 and 0.24 respectively, P < 0.0001) and 3
glucose (r = 0.21, P < 0.0001). Negative correlations were found for C3 and insulin 4
sensitivity (r = -0.41, P < 0.0001) and for C3 and HDL-C (r = -0.33, P < 0.0001). 5
6
3.2. C3 concentrations and risk of metabolic syndrome and its phenotypes 7
Individuals with elevated C3 concentrations (above the median) had 3 fold higher risk of 8
MetS [OR 3.11, 95% CI 2.52-3.82, P < 0.0001] compared to individuals with C3 9
concentrations in the bottom 50th percentile (Table 2). Among all individuals increased risk 10
of abdominal obesity, hyperinsulinaemia, impaired insulin sensitivity, reduced insulin 11
resistance and low HDL-C was identified in subjects with higher C3 concentrations relative 12
to individuals with C3 concentrations below the median. Similar results for these parameters 13
were observed when males and females were analysed separately (data not shown), with 14
greater MetS risk identified in females [OR 5.67, CI 4.02-7.99, P < 0.0001] than in males 15
[OR 2.16, CI 1.67-2.82, P < 0.0001]. In addition increased risk of low HDL-C concentrations 16
was only evident among the male subjects [OR 1.63, CI 1.12-2.37, P = 0.01]. Interestingly 17
when MetS case and control subjects were analysed separately (Table 2), higher C3 18
concentrations were associated with increased risk of hyperinsulinaemia, impaired insulin 19
sensitivity and abdominal obesity in both groups. MetS cases also had greater risk of low 20
HDL-C concentrations whereas individuals without the MetS with higher C3 concentrations 21
displayed increased risk for a number of other MetS phenotypes including insulin resistance 22
and hypertension. 23
Accepted Manuscript
1 2 3 4 5 6 7 8 9 10 11 12 13 14 15 16 17 18 19 20 21 22 23 24 25 26 27 28 29 30 31 32 33 34 35 36 37 38 39 40 41 42 43 44 45 46 47 48 49 50 51 52 53 54 55 56 57 58 59 60
3.3. Modulation of MetS risk conferred by high C3 concentrations by dietary fat composition 1
Dietary fat consumption modulated the relationship between plasma C3 concentrations 2
and MetS risk (Table 3), whereby the increased MetS risk conferred by elevated C3 3
concentrations was further accentuated among high fat consumers [OR 4.80, 95% CI 2.77-4
8.33, P < 0.0001] which appeared to be due to high intake of both saturated fatty acids (SFA) 5
[OR 4.05, 95% CI 2.33-7.05, P < 0.0001] and monounsaturated fatty acids (MUFA) [OR 6
4.48, 95% CI 2.62-7.56, P < 0.0001]. MetS risk was also increased among individuals with 7
elevated C3 levels who habitually consumed a low-fat diet, or diets low in SFA or MUFA, 8
however the observed odds ratios were all below that identified for MetS risk associated with 9
elevated C3 levels alone (OR 3.11), suggesting an additive effect of elevated C3 levels and 10
high fat intake. Dietary polyunsaturated fatty acid (PUFA) intake did not influence MetS risk, 11
nor were any gender differences noted for this analysis when males and females were 12
analysed separately. Interaction analysis confirmed these findings whereby higher dietary 13
intake of total fat (P interaction = 0.003), SFA (P interaction = 0.02) and MUFA (P interaction = 0.02) 14
in individuals with elevated C3 concentrations was predictive of increased MetS score. 15
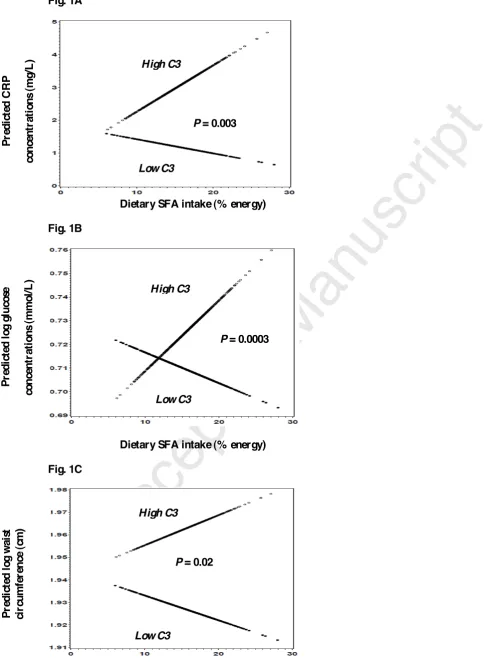
Further examination of interactions between SFA intake and MetS phenotypes (Figure
1A-16
1C) according to C3 status identified significant effects on glucose (P interaction = 0.0003) and 17
CRP concentrations (P interaction = 0.003) and on abdominal obesity (P interaction = 0.02) only 18
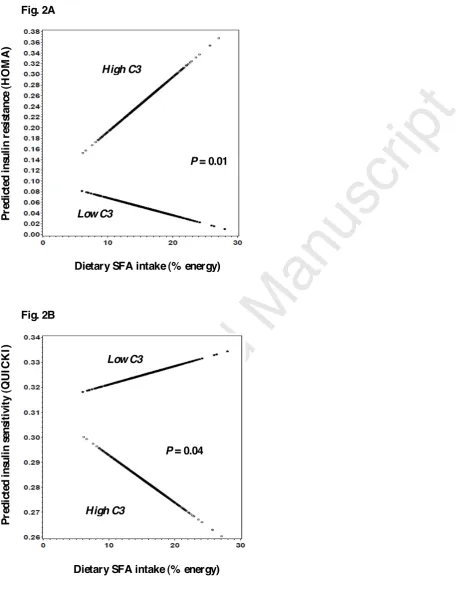
among subjects with high C3 concentrations. Examination of measures of insulin resistance 19
and sensitivity (Figure 2A-2B) revealed interactions between SFA and HOMA (P interaction = 20
0.01) and QUICKI (P interaction = 0.04) again only among subjects with elevated C3 21
concentrations. Similar interactions and P values were identified between C3 concentrations 22
and these parameters with MUFA (data not shown). 23
Accepted Manuscript
1 2 3 4 5 6 7 8 9 10 11 12 13 14 15 16 17 18 19 20 21 22 23 24 25 26 27 28 29 30 31 32 33 34 35 36 37 38 39 40 41 42 43 44 45 46 47 48 49 50 51 52 53 54 55 56 57 58 59 60
3.4. Effect modification of MetS risk conferred by elevated C3 concentrations by obesity, 1
smoking and physical activity 2
When stratified by BMI, similar odds ratios for the MetS were observed in the 3
overweight (including obese) and the lean individuals with elevated C3 levels relative to their 4
counterparts with C3 concentrations below the median, suggesting that BMI did not modulate 5
the increased MetS risk associated with elevated plasma C3 concentrations. However when 6
abdominal obesity based on increased waist circumference (1 of the 5 MetS criteria) was used 7
to stratify subjects MetS risk was abolished in those classified as abdominally lean [OR 1.46, 8
95% CI 0.69-3.14, P=0.33]. MetS risk was increased in the abdominally obese individuals 9
with elevated C3 levels [OR 2.89, 95% CI 1.87-4.39, P < 0.0001]; however this OR was in 10
keeping with MetS risk identified in the whole population [OR 3.11]. Interestingly when 11
stratified by abdominal obesity (Figure 3), obese MetS subjects demonstrated significantly 12
increased C3 concentrations (ANOVA P < 0.0001) compared to lean MetS subjects (P = 13
0.002) and to the obese and lean control subjects (P = 0.0001). Similar patterns were 14
observed for TAG concentrations and insulin resistance, with inverse relationships identified 15
for insulin sensitivity and HDL-C concentrations (ANOVA P < 0.0001). In relation to 16
smoking status, higher C3 levels among smokers were associated with increased MetS risk 17
[OR 3.83, 95% CI 2.12-6.94, P < 0.0001] compared to smokers with C3 levels below the 18
median. Plasma C3 levels did not seem to affect MetS risk among non-smokers, with odds 19
ratios for MetS [OR 3.05, 95% CI 2.45-3.82, P < 0.0001] in line with that of the whole 20
population [OR 3.11]. Physical activity levels did not modulate MetS risk associated with 21
elevated C3 levels with similar findings in irregularly active individuals [OR 3.89, 95% CI 22
2.47-6.14, P < 0.0001] and those active on a daily basis [OR 3.64, 95% CI 2.47-5.35, P < 23
0.0001]. 24
Accepted Manuscript
1 2 3 4 5 6 7 8 9 10 11 12 13 14 15 16 17 18 19 20 21 22 23 24 25 26 27 28 29 30 31 32 33 34 35 36 37 38 39 40 41 42 43 44 45 46 47 48 49 50 51 52 53 54 55 56 57 58 59 60
4. Discussion
1
MetS is associated with increased risk of T2DM and CVD 1. Increasing numbers of 2
studies have reported associations between elevated C3 concentrations, MetS phenotypes and 3
CVD risk 5-8. This study adds to current knowledge in terms of determining how this 4
association is further modified by dietary fat composition and obesity. We identified a three-5
fold increased risk of the MetS and its phenotypes including abdominal obesity, impaired 6
insulin sensitivity, reduced insulin resistance and low HDL-C concentrations in individuals 7
with elevated C3 concentrations (> median). To our knowledge, no information exists in 8
relation to potential modulation of MetS risk conferred by C3 concentrations by habitual 9
dietary fat intake. We have shown for the first time that MetS risk associated with higher C3 10
concentrations was subject to a significant effect modification by dietary fat intake, with 11
greater risk identified among individuals with high total dietary fat, SFA and MUFA intake. 12
While increased MetS risk was still evident in their low-fat consuming counterparts with 13
elevated C3 concentrations, one interpretation could be that individuals predisposed to the 14
MetS display a greater sensitivity to high intake of total dietary fat, SFA and MUFA which 15
further accentuates their risk. 16
Chronic inflammation has been recognised by the NCEP ATP III as a key MetS 17
characteristic 2. Recently the metabolic inflammatory state associated with obesity and insulin 18
UHVLVWDQFHKDVEHHQWHUPHGµPHWD-LQIODPPDWLRQ¶DQGKDVEHHQGHILQHGDV³ORZ-grade, chronic
19
LQIODPPDWLRQRUFKHVWUDWHGE\PHWDEROLFFHOOVLQUHVSRQVHWRH[FHVVQXWULHQWVDQGHQHUJ\´30.
20
Dietary fat is an important nutrient, wherein excessive exposure has been suggested to play a 21
key role in the development of MetS 14-16. Cross-sectional, intervention and experimental data 22
suggest that high-fat diets, in particular high SFA diets, promote obesity, insulin resistance 23
and inflammation, promoting the development of MetS, T2DM and CVD 16, 31. In insulin 24
Accepted Manuscript
1 2 3 4 5 6 7 8 9 10 11 12 13 14 15 16 17 18 19 20 21 22 23 24 25 26 27 28 29 30 31 32 33 34 35 36 37 38 39 40 41 42 43 44 45 46 47 48 49 50 51 52 53 54 55 56 57 58 59 60
effective in subjects habitually consuming a high fat diet (>36% energy from fat) 32. It has 1
been suggested that dietary oleic acid (the major MUFA) may be more readily oxidised than 2
SFA which may in turn have a negative effect on insulin sensitivity 33. Interestingly C3a 3
receptor (C3aR) knockout mice fed high fat diets displayed resistance to diet-induced obesity 4
and insulin resistance. Examination of their adipocytes revealed reduced macrophage 5
infiltration and pro-inflammatory status 34. This data provides evidence that the C3aR is 6
responsive to dietary fat, at least in mice, and that the C3aR plays an important role in insulin 7
resistance and obesity. Unfortunately that study did not examine the influence of dietary fat 8
composition. In a mouse model of atherosclerosis (LDLR-/-) hepatic gene expression profiling 9
revealed induction of the alternative complement pathway and down-regulated expression of 10
C3, in conjunction with greater aortic lesion C3, in high-fat relative to low-fat fed mice 35. 11
In the current study we did not find any evidence that dietary PUFA modulates the 12
association between C3 concentrations and MetS risk, suggesting specific effects of SFA and 13
MUFA. As oleic acid is mostly derived from animal products and not olive oil, at least 14
outside of the Mediterranean region, it is difficult to fully differentiate the effects of SFA 15
from MUFA. Thus the SFA and MUFA specific effects may be inter-linked. In a recent 16
small study of abdominally overweight individuals (n=20) consumption of a SFA-rich diet 17
increased pro-inflammatory gene expression in adipose tissue, whereas a MUFA-rich diet 18
induced a more anti-inflammatory profile 36. However there was no difference in associated 19
plasma inflammatory biomarker concentrations including C3 concentrations between diets 36. 20
To our knowledge there is only one paper in the literature which reports a diet related change 21
in C3 concentrations in humans, in that study obese subjects (n=30) randomly assigned to a 22
hypocaloric legume-rich diet achieved a greater reduction in C3 concentrations compared to a 23
legume-free diet 37. Chylomicrons are the strongest stimulators of adipocyte C3 production 19, 24
Accepted Manuscript
1 2 3 4 5 6 7 8 9 10 11 12 13 14 15 16 17 18 19 20 21 22 23 24 25 26 27 28 29 30 31 32 33 34 35 36 37 38 39 40 41 42 43 44 45 46 47 48 49 50 51 52 53 54 55 56 57 58 59 60
molecular mechanisms underlying modulation of MetS risk by dietary fat in individuals with 1
elevated C3 concentrations are currently unknown and warrants further investigation. Toll-2
like receptor-4 (TLR4) is another innate immune molecular link between fatty acids, obesity, 3
inflammation and insulin resistance 38. SFA activate TLR4 mediated inflammation whereas 4
MUFA or PUFA do not 39, 40. TLR4 deficiency protects against high SFA diet-induced 5
obesity, inflammation and insulin resistance 39, 41. Complement and TLR pathways are both 6
activated by lipopolysaccharide, suggesting potential cross-talk between the two systems 42. 7
Initial experiments indicate a regulatory effect of complement on TLR signalling mediated, at 8
least in part, via the C3a receptor 43. Thus potential synergism between C3 and TLR4 in 9
response to high SFA intake to promote inflammation and insulin resistance should be 10
examined. 11
While Mets risk was greater in females, we did not observe any differences in C3 12
concentrations between genders. Higher C3 concentrations have been reported in women 44 13
and the C3 pathway is thought to be more active in subcutaneous adipose tissue 45, which is 14
more abundant in females than in males. Thus this finding perhaps reflects gender-specific 15
differences in intra- and extra- peritoneal adipose tissue mass. Interestingly abdominal 16
obesity, but not BMI, modulated MetS risk associated with elevated C3 concentrations. MetS 17
risk was abolished in those classified as abdominally lean. When we further stratified the 18
cohort obese MetS subjects demonstrated the highest C3 concentrations, which were 19
significantly higher compared to lean MetS subjects and to both obese and lean control 20
subjects, suggesting an additive effect. Adipose tissue is an important source of C3 21
production 9. Thus it may not be surprising that a previous examination of C3 concentrations 22
across degrees of obesity revealed a relationship between C3 concentrations and the 23
progressive increase of BMI in individuals with severe, morbid and extreme obesity 10. In our 24
Accepted Manuscript
1 2 3 4 5 6 7 8 9 10 11 12 13 14 15 16 17 18 19 20 21 22 23 24 25 26 27 28 29 30 31 32 33 34 35 36 37 38 39 40 41 42 43 44 45 46 47 48 49 50 51 52 53 54 55 56 57 58 59 60
control subjects also indicate that the MetS, or at least some of its associated metabolic 1
perturbations, rather than obesity per say may also be responsible. 2
In the current study higher C3 concentrations among smokers were associated with 3
further increased MetS risk compared to smokers with low C3 concentrations, whereas C3 4
concentrations did not seem to affect MetS risk among non-smokers. We found no evidence 5
of modulation by physical activity concentrations, with similar MetS risk in the top 50th C3 6
percentile regardless of whether they were irregularly active or active on a daily basis. 7
Conflicting data exists in the literature in relation to smoking status, physical activity and C3 8
concentrations. In middle-aged and elderly men and women (n=1220) C3 concentrations 9
were inversely associated with smoking status 21. Similarly in a large study of middle-aged 10
non-diabetic men the proportion of smokers was lower in those with high C3 concentrations, 11
with no difference in physical activity concentrations across C3 quartiles 20. More recently a 12
cross-sectional association between C3 concentrations and coronary heart disease was 13
reported, but only in heavy smokers 23. It is unknown whether smoking has a direct effect on 14
C3 concentrations or whether other factors / mechanisms may account for these findings. 15
Several features of this study (comprehensive phenotypic characterisation, large number 16
of male and female cases and matched controls from all socio-economical categories and 17
areas in the country) make this study particularly robust. Nevertheless, some limitations can 18
be identified. As dietary consumption was self-reported by food-frequency questionnaire, 19
some misclassification of exposure, due to deficiencies in nutrient databases, accuracy of 20
memories or willingness to divulge these details, was inevitable. The number of dietary 21
records used was minimal (3 in a small number of subjects) but was necessitated in order to 22
maximise the number of matched cases and controls. The focus of the current analysis was on 23
dietary fat composition but other food components such as carbohydrate or fibre can play a 24
Accepted Manuscript
1 2 3 4 5 6 7 8 9 10 11 12 13 14 15 16 17 18 19 20 21 22 23 24 25 26 27 28 29 30 31 32 33 34 35 36 37 38 39 40 41 42 43 44 45 46 47 48 49 50 51 52 53 54 55 56 57 58 59 60
In conclusion, this study provides new data on modulation of MetS risk associated with 1
elevated C3 concentrations by dietary fat intake, abdominal obesity and smoking. We 2
demonstrated that individuals with C3 concentrations in the top 50th percentile had increased 3
risk of impaired insulin sensitivity, hyperinsulinaemia and abdominal obesity, regardless of 4
whether they had the MetS or not. Indeed further metabolic perturbations existed in the 5
control subjects with elevated C3 levels (insulin resistance and hypertension). Interestingly 6
increased MetS risk was further augmented in high dietary fat consumers and smokers, 7
suggesting that these individuals could derive most benefit from current public health 8
guidelines to reduce dietary fat intake and stop smoking. While the underlying molecular 9
mechanisms are unknown and require further investigation, such data add to the current 10
knowledge and may be useful in terms of developing personalised dietary recommendations 11
wherein aQLQGLYLGXDOV¶PHWD-inflammatory profile may determine choice of dietary therapy 12
to improve responsiveness and cardiometabolic health. 13
14
ACKNOWLEDGEM ENTS
15
This study was supported by the European Commission, Framework Programme 6 16
(LIPGENE): contract number FOOD-CT-2003-505944. The SU.VI.MAX study is registered 17
as NCT00272428 at ClinicalTrials.gov. We thank all participants and authors for their 18
Accepted Manuscript
1 2 3 4 5 6 7 8 9 10 11 12 13 14 15 16 17 18 19 20 21 22 23 24 25 26 27 28 29 30 31 32 33 34 35 36 37 38 39 40 41 42 43 44 45 46 47 48 49 50 51 52 53 54 55 56 57 58 59 60 REFERENCES1 Moller, D. E. and Kaufman, K. D., Metabolic syndrome: a clinical and molecular perspective, 1
Annual review of medicine, 2005, 56: 45-‐62. 2
2 Third Report of the National Cholesterol Education Program (NCEP) Expert Panel on 3
Detection, Evaluation, and Treatment of High Blood Cholesterol in Adults (Adult Treatment Panel III) 4
final report, Circulation, 2002, 106: 3143-‐3421. 5
3 Maury, E. and Brichard, S. M., Adipokine dysregulation, adipose tissue inflammation and 6
metabolic syndrome, Mol Cell Endocrinol, 2010, 314: 1-‐16. 7
4 Pickup, J. C., Inflammation and activated innate immunity in the pathogenesis of type 2 8
diabetes, Diabetes care, 2004, 27: 813-‐823. 9
5 Engstrom, G., Hedblad, B., Eriksson, K. F., Janzon, L. and Lindgarde, F., Complement C3 is a 10
risk factor for the development of diabetes: a population-‐based cohort study, Diabetes, 2005, 54: 11
570-‐575. 12
6 Halkes, C. J., van Dijk, H., de Jaegere, P. P., Plokker, H. W., van Der Helm, Y., Erkelens, D. W. 13
and Castro Cabezas, M., Postprandial increase of complement component 3 in normolipidemic 14
patients with coronary artery disease: effects of expanded-‐dose simvastatin, Arteriosclerosis, 15
thrombosis, and vascular biology, 2001, 21: 1526-‐1530. 16
7 Muscari, A., Massarelli, G., Bastagli, L., Poggiopollini, G., Tomassetti, V., Drago, G., 17
Martignani, C., Pacilli, P., Boni, P. and Puddu, P., Relationship of serum C3 to fasting insulin, risk 18
factors and previous ischaemic events in middle-‐aged men, European heart journal, 2000, 21: 1081-‐ 19
1090. 20
8 van Oostrom, A. J., Alipour, A., Plokker, T. W., Sniderman, A. D. and Cabezas, M. C., The 21
metabolic syndrome in relation to complement component 3 and postprandial lipemia in patients 22
from an outpatient lipid clinic and healthy volunteers, Atherosclerosis, 2007, 190: 167-‐173. 23
9 Gabrielsson, B. G., Johansson, J. M., Lonn, M., Jernas, M., Olbers, T., Peltonen, M., Larsson, I., 24
Lonn, L., Sjostrom, L., Carlsson, B. and Carlsson, L. M., High expression of complement components 25
in omental adipose tissue in obese men, Obes Res, 2003, 11: 699-‐708. 26
10 Hernandez-‐Mijares, A., Jarabo-‐Bueno, M. M., Lopez-‐Ruiz, A., Sola-‐Izquierdo, E., Morillas-‐ 27
Arino, C. and Martinez-‐Triguero, M. L., Levels of C3 in patients with severe, morbid and extreme 28
obesity: its relationship to insulin resistance and different cardiovascular risk factors, International 29
journal of obesity (2005), 2007, 31: 927-‐932. 30
11 Yang, Y., Lu, H. L., Zhang, J., Yu, H. Y., Wang, H. W., Zhang, M. X. and Cianflone, K., 31
Relationships among acylation stimulating protein, adiponectin and complement C3 in lean vs obese 32
type 2 diabetes, International journal of obesity (2005), 2006, 30: 439-‐446. 33
12 Masharani, U. B., Maddux, B. A., Li, X., Sakkas, G. K., Mulligan, K., Schambelan, M., Goldfine, 34
I. D. and Youngren, J. F., Insulin Resistance in Non-‐Obese Subjects Is Associated with Activation of 35
the JNK Pathway and Impaired Insulin Signaling in Skeletal Muscle, PloS one, 2011, 6: e19878. 36
13 Phillips, C. M., Goumidi, L., Bertrais, S., Ferguson, J. F., Field, M. R., Kelly, E. D., Peloso, G. M., 37
Cupples, L. A., Shen, J., Ordovas, J. M., McManus, R., Hercberg, S., Portugal, H., Lairon, D., Planells, R. 38
and Roche, H. M., Complement component 3 polymorphisms interact with polyunsaturated fatty 39
acids to modulate risk of metabolic syndrome, The American journal of clinical nutrition, 2009, 90: 40
1665-‐1673. 41
14 Phillips, C., Lopez-‐Miranda, J., Perez-‐Jimenez, F., McManus, R. and Roche, H. M., Genetic and 42
nutrient determinants of the metabolic syndrome, Current opinion in cardiology, 2006, 21: 185-‐193. 43
15 Szabo de Edelenyi, F., Goumidi, L., Bertrais, S., Phillips, C., Macmanus, R., Roche, H., Planells, 44
R. and Lairon, D., Prediction of the metabolic syndrome status based on dietary and genetic 45
parameters, using Random Forest, Genes & nutrition, 2008, 3: 173-‐176. 46
16 Vessby, B., Dietary fat, fatty acid composition in plasma and the metabolic syndrome, 47
Accepted Manuscript
1 2 3 4 5 6 7 8 9 10 11 12 13 14 15 16 17 18 19 20 21 22 23 24 25 26 27 28 29 30 31 32 33 34 35 36 37 38 39 40 41 42 43 44 45 46 47 48 49 50 51 52 53 54 55 56 57 58 59 6017 Lopez-‐Miranda, J., Williams, C. and Lairon, D., Dietary, physiological, genetic and 1
pathological influences on postprandial lipid metabolism, The British journal of nutrition, 2007, 98: 2
458-‐473. 3
18 Scantlebury, T., Maslowska, M. and Cianflone, K., Chylomicron-‐specific enhancement of 4
acylation stimulating protein and precursor protein C3 production in differentiated human 5
adipocytes, The Journal of biological chemistry, 1998, 273: 20903-‐20909. 6
19 Verseyden, C., Meijssen, S., van Dijk, H., Jansen, H. and Castro Cabezas, M., Effects of 7
atorvastatin on fasting and postprandial complement component 3 response in familial combined 8
hyperlipidemia, Journal of lipid research, 2003, 44: 2100-‐2108. 9
20 Engstrom, G., Hedblad, B., Janzon, L. and Lindgarde, F., Weight gain in relation to plasma 10
levels of complement factor 3: results from a population-‐based cohort study, Diabetologia, 2005, 48: 11
2525-‐2531. 12
21 Onat, A., Hergenc, G., Can, G., Kaya, Z. and Yuksel, H., Serum complement C3: a determinant 13
of cardiometabolic risk, additive to the metabolic syndrome, in middle-‐aged population, 14
Metabolism: clinical and experimental, 2010, 59: 628-‐634. 15
22 Puchau, B., Zulet, M. A., Gonzalez de Echavarri, A., Navarro-‐Blasco, I. and Martinez, J. A., 16
Selenium intake reduces serum C3, an early marker of metabolic syndrome manifestations, in 17
healthy young adults, European journal of clinical nutrition, 2009, 63: 858-‐864. 18
23 van Greevenbroek, M. M., Jacobs, M., van der Kallen, C. J., Blaak, E. E., Jansen, E. H., 19
Schalkwijk, C. G., Feskens, E. J. and Stehouwer, C. D., Human plasma complement C3 is 20
independently associated with coronary heart disease, but only in heavy smokers (the CODAM 21
study), Int J Cardiol, 2010. 22
24 Hercberg, S., Galan, P., Preziosi, P., Bertrais, S., Mennen, L., Malvy, D., Roussel, A. M., Favier, 23
A. and Briancon, S., The SU.VI.MAX Study: a randomized, placebo-‐controlled trial of the health 24
effects of antioxidant vitamins and minerals, Arch Intern Med, 2004, 164: 2335-‐2342. 25
25 Phillips, C. M., Goumidi, L., Bertrais, S., Field, M. R., Peloso, G. M., Shen, J., McManus, R., 26
Hercberg, S., Lairon, D., Planells, R. and Roche, H. M., Dietary saturated fat modulates the 27
association between STAT3 polymorphisms and abdominal obesity in adults, The Journal of 28
nutrition, 2009, 139: 2011-‐2017. 29
26 Executive Summary of The Third Report of The National Cholesterol Education Program 30
(NCEP) Expert Panel on Detection, E., And Treatment of High Blood Cholesterol In Adults (Adult 31
Treatment Panel III), Jama, 2001, 285: 2486-‐2497. 32
27 Matthews, D. R., Hosker, J. P., Rudenski, A. S., Naylor, B. A., Treacher, D. F. and Turner, R. C., 33
Homeostasis model assessment: insulin resistance and beta-‐cell function from fasting plasma 34
glucose and insulin concentrations in man, Diabetologia, 1985, 28: 412-‐419. 35
28 Perseghin, G., Caumo, A., Caloni, M., Testolin, G. and Luzi, L., Incorporation of the fasting 36
plasma FFA concentration into QUICKI improves its association with insulin sensitivity in nonobese 37
individuals, The Journal of clinical endocrinology and metabolism, 2001, 86: 4776-‐4781. 38
29 Liang, K. Y. and Zeger, S. L., Regression analysis for correlated data, Annual review of public 39
health, 1993, 14: 43-‐68. 40
30 Gregor, M. F. and Hotamisligil, G. S., Inflammatory mechanisms in obesity, Annu Rev 41
Immunol, 2011, 29: 415-‐445. 42
31 Kennedy, A., Martinez, K., Chuang, C. C., LaPoint, K. and McIntosh, M., Saturated fatty acid-‐ 43
mediated inflammation and insulin resistance in adipose tissue: mechanisms of action and 44
implications, The Journal of nutrition, 2009, 139: 1-‐4. 45
32 Tierney, A. C., McMonagle, J., Shaw, D. I., Gulseth, H. L., Helal, O., Saris, W. H., Paniagua, J. 46
A., Golabek-‐Leszczynska, I., Defoort, C., Williams, C. M., Karsltrom, B., Vessby, B., Dembinska-‐Kiec, A., 47
Lopez-‐Miranda, J., Blaak, E. E., Drevon, C. A., Gibney, M. J., Lovegrove, J. A. and Roche, H. M., Effects 48
of dietary fat modification on insulin sensitivity and on other risk factors of the metabolic syndrome-‐ 49
LIPGENE: a European randomized dietary intervention study, International journal of obesity (2005), 50
Accepted Manuscript
1 2 3 4 5 6 7 8 9 10 11 12 13 14 15 16 17 18 19 20 21 22 23 24 25 26 27 28 29 30 31 32 33 34 35 36 37 38 39 40 41 42 43 44 45 46 47 48 49 50 51 52 53 54 55 56 57 58 59 6033 Kien, C. L., Bunn, J. Y. and Ugrasbul, F., Increasing dietary palmitic acid decreases fat 1
oxidation and daily energy expenditure, The American journal of clinical nutrition, 2005, 82: 320-‐ 2
326. 3
34 Mamane, Y., Chung Chan, C., Lavallee, G., Morin, N., Xu, L. J., Huang, J., Gordon, R., Thomas, 4
W., Lamb, J., Schadt, E. E., Kennedy, B. P. and Mancini, J. A., The C3a anaphylatoxin receptor is a key 5
mediator of insulin resistance and functions by modulating adipose tissue macrophage infiltration 6
and activation, Diabetes, 2009. 7
35 Recinos, A., 3rd, Carr, B. K., Bartos, D. B., Boldogh, I., Carmical, J. R., Belalcazar, L. M. and 8
Brasier, A. R., Liver gene expression associated with diet and lesion development in atherosclerosis-‐ 9
prone mice: induction of components of alternative complement pathway, Physiol Genomics, 2004, 10
19: 131-‐142. 11
36 van Dijk, S. J., Feskens, E. J., Bos, M. B., Hoelen, D. W., Heijligenberg, R., Bromhaar, M. G., de 12
Groot, L. C., de Vries, J. H., Muller, M. and Afman, L. A., A saturated fatty acid-‐rich diet induces an 13
obesity-‐linked proinflammatory gene expression profile in adipose tissue of subjects at risk of 14
metabolic syndrome, The American journal of clinical nutrition, 2009, 90: 1656-‐1664. 15
37 Hermsdorff, H. H., Zulet, M. A., Abete, I. and Martinez, J. A., A legume-‐based hypocaloric diet 16
reduces proinflammatory status and improves metabolic features in overweight/obese subjects, 17
European journal of nutrition, 2011, 50: 61-‐69. 18
38 Shi, H., Kokoeva, M. V., Inouye, K., Tzameli, I., Yin, H. and Flier, J. S., TLR4 links innate 19
immunity and fatty acid-‐induced insulin resistance, The Journal of clinical investigation, 2006, 116: 20
3015-‐3025. 21
39 Holland, W. L., Bikman, B. T., Wang, L. P., Yuguang, G., Sargent, K. M., Bulchand, S., Knotts, T. 22
A., Shui, G., Clegg, D. J., Wenk, M. R., Pagliassotti, M. J., Scherer, P. E. and Summers, S. A., Lipid-‐ 23
induced insulin resistance mediated by the proinflammatory receptor TLR4 requires saturated fatty 24
acid-‐induced ceramide biosynthesis in mice, The Journal of clinical investigation, 2011, 121: 1858-‐ 25
1870. 26
40 Nguyen, M. T., Favelyukis, S., Nguyen, A. K., Reichart, D., Scott, P. A., Jenn, A., Liu-‐Bryan, R., 27
Glass, C. K., Neels, J. G. and Olefsky, J. M., A subpopulation of macrophages infiltrates hypertrophic 28
adipose tissue and is activated by free fatty acids via Toll-‐like receptors 2 and 4 and JNK-‐dependent 29
pathways, The Journal of biological chemistry, 2007, 282: 35279-‐35292. 30
41 Davis, J. E., Gabler, N. K., Walker-‐Daniels, J. and Spurlock, M. E., Tlr-‐4 deficiency selectively 31
protects against obesity induced by diets high in saturated fat, Obesity (Silver Spring, Md, 2008, 16: 32
1248-‐1255. 33
42 Hajishengallis, G. and Lambris, J. D., Crosstalk pathways between Toll-‐like receptors and the 34
complement system, Trends Immunol, 2010, 31: 154-‐163. 35
43 Zhang, X., Kimura, Y., Fang, C., Zhou, L., Sfyroera, G., Lambris, J. D., Wetsel, R. A., Miwa, T. 36
and Song, W. C., Regulation of Toll-‐like receptor-‐mediated inflammatory response by complement in 37
vivo, Blood, 2007, 110: 228-‐236. 38
44 Szeplaki, G., Prohaszka, Z., Duba, J., Rugonfalvi-‐Kiss, S., Karadi, I., Kokai, M., Kramer, J., Fust, 39
G., Kleiber, M., Romics, L. and Varga, L., Association of high serum concentration of the third 40
component of complement (C3) with pre-‐existing severe coronary artery disease and new vascular 41
events in women, Atherosclerosis, 2004, 177: 383-‐389. 42
45 Maslowska, M., Vu, H., Phelis, S., Sniderman, A. D., Rhode, B. M., Blank, D. and Cianflone, K., 43
Plasma acylation stimulating protein, adipsin and lipids in non-‐obese and obese populations, 44
European journal of clinical investigation, 1999, 29: 679-‐686. 45
Accepted Manuscript
1 2 3 4 5 6 7 8 9 10 11 12 13 14 15 16 17 18 19 20 21 22 23 24 25 26 27 28 29 30 31 32 33 34 35 36 37 38 39 40 41 42 43 44 45 46 47 48 49 50 51 52 53 54 55 56 57 58 59 60
FI GURE LEGENDS FI GURE 1
1
Interaction between dietary SFA intake and C3 status (< and > median) on glucose 2
concentrations (Figure 1a), CRP concentrations (Figure 1b) and abdominal obesity (Figure 3
1c) in all subjects. 4
Increasing dietary SFA intake was predictive of increasing fasting glucose (P interaction = 5
0.0003) and CRP (P interaction = 0.003) concentrations and greater abdominal obesity (P interaction 6
= 0.02) in individuals with elevated C3 levels (depicted as open circles) but not in those with 7
low C3 levels (depicted as closed circles). The P values and predicted values were calculated 8
from the generalised estimating equation (GEE) linear regression 29 model. 9
10
FI GURE 2
11
Interaction between dietary SFA intake and C3 status (< and > median) on insulin resistance 12
(Figure 2a) and insulin sensitivity (Figure 2b). 13
Among individuals with high C3 levels (depicted as open circles) increasing dietary SFA 14
intake was predictive of increasing insulin resistance (P interaction = 0.01) and deteriorating 15
insulin sensitivity (P interaction = 0.04). The P values and predicted values were calculated from 16
the generalised estimating equation (GEE) linear regression 29 model. The open circles 17
represent individuals with C3 levels > median and the closed circles represent individuals 18
with C3 levels < median. 19
20
FI GURE 3
Accepted Manuscript
1 2 3 4 5 6 7 8 9 10 11 12 13 14 15 16 17 18 19 20 21 22 23 24 25 26 27 28 29 30 31 32 33 34 35 36 37 38 39 40 41 42 43 44 45 46 47 48 49 50 51 52 53 54 55 56 57 58 59 60
Relationship between plasma C3 concentrations according to abdominal obesity in MetS 1
cases and control subjects. 2
When stratified by abdominal obesity, as defined in the MetS criteria, obese MetS subjects 3
demonstrated significantly increased C3 levels (ANOVA P < 0.0001) compared to lean MetS 4
subjects (P = 0.002), obese (P = 0.0001) and lean individuals without the MetS (P = 0.0001). 5
Accepted Manuscript
Fig. 1ADietary SFA intake (% energy)
Fig. 1B
Dietary SFA intake (% energy) Fig. 1C
Dietary SFA intake (% energy) P = 0.0003 High C3
Low C3
Pr
ed
ic
te
d
l
og
gl
u
cos
e
co
n
ce
n
tr
at
io
n
s
(m
m
ol
/L
)
Pr
ed
ic
te
d
l
og
w
ai
st
ci
rc
u
m
fer
en
ce
(
cm
)
P = 0.003
Pr
ed
ic
te
d
C
R
P
co
n
ce
n
tr
at
io
n
s
(m
g/
L
) High C3
Low C3
High C3
Low C3
[image:24.595.24.510.78.744.2]Accepted Manuscript
Fig. 2A
Dietary SFA intake (% energy)
Fig. 2B
Dietary SFA intake (% energy)
P = 0.01 High C3
Low C3
Pr
ed
ic
te
d
i
n
su
li
n
r
es
is
tan
ce
(
H
O
M
A)
P
re
d
ic
te
d
i
n
su
li
n
s
en
si
ti
vi
ty
(
Q
U
ICK
I)
Low C3
High C3
Accepted Manuscript
Accepted Manuscript
Table 1
Clinical characteristics and dietary profiles of the population at follow-up categorised
according to high versus low plasma C3 median concentrations
< C3 median > C3 median
n 871 883
MetS case/control % 39/61 67/33 *
Male/female % 61/39 59/41
Age, yrs 58.44±0.20 58.01±0.16
BMI, kg/m2 24.98±0.12 27.55±0.18 *
Waist, cm 85.44±0.38 92.36±0.47 *
Glucose, mmol/L 5.17±0.03 5.37±0.04
Insulin, mU/L 6.27±0.16 9.07±0.24 *
HOMA 1.53±0.05 2.26±0.07 *
QUICKI 0.35±0.01 0.30±0.01 *
Total cholesterol, mmol/L 5.62±0.03 5.85±0.03 *
HDL-C, mmol/L 1.55±0.01 1.35±0.01*
LDL-C, mmol/L 3.31±0.03 3.88±0.03 *
Triglycerides, mmol/L 1.12±0.03 1.46±0.03 *
NEFA, mmol/L 0.82±0.02 1.06±0.03 *
SBP, mm Hg 128.1±0.45 135.6±0.61 *
DBP, mm Hg 80.86±0.27 84.04±0.37 *
Accepted Manuscript
Total fat intake (% energy) 33.34±0.32 33.43±0.45Total SFA intake (% energy) 14.12±0.18 13.86±0.22
Total MUFA intake (% energy) 12.29±0.13 12.50±0.21
Total PUFA intake (% energy) 4.81±0.08 4.94±0.11
Protein intake (% energy) 17.05±0.25 16.54±0.17
Carbohydrate intake (% energy) 42.03±0.57 43.00±0.37
Total fibre intake (g/day) 20.08±0.53 20.16±0.40
Soluble fibre intake (g/day) 3.94±0.08 3.92±0.11
Non-soluble fibre intake (g/day) 16.14±0.35 16.24±0.37
Alcohol intake (% energy) 7.58±0.30 7.03±0.49
Physical activity: irregular/daily (%) 22/78 20/80
Smoking: never/former & current (%) 87/13 86.5/13.5
Accepted Manuscript
Table 2
Odds ratios and 95% confidence intervals for risk of MetS and related phenotypes according
to C3 concentrations in all subjects, MetS cases and controls
All subjects P value MetS cases P value Controls P value
MetS 3.11
(2.52-3.82)
< 0.0001 - - - -
Impaired insulin sensitivity 1.78
(1.34-2.36)
< 0.0001 1.75
(1.05-2.91)
0.033 1.96
(1.41-2.75)
< 0.0001
Reduced insulin resistance 1.73
(1.31-2.89)
0.0001 1.57
(0.94-2.63)
0.089 1.90
(1.36-2.65)
0.0002
Abdominal obesity 2.15
(1.43-3.24)
0.0002 2.69
(1.66-4.37)
< 0.0001 2.17
(1.17-4.03)
0.014
Low HDL-C 1.40
(1.05-1.86)
0.02 1.37
(1.03-1.83)
0.034 2.33
(0.50-4.59)
0.282
Hyperinsulineamia 1.84
(1.41-2.41)
< 0.0001 1.88
(1.18-2.99)
0.008 1.81
(1.30-2.52)
0.0005
Hypertension 1.36
(0.96-1.94)
0.089 0.87
(0.50-1.52)
0.610 1.65
(1.06-2.59)
0.025
Odds ratios and 95% confidence intervals for the association between plasma C3
Accepted Manuscript
analyses comparing individuals with high C3 concentrations (> median) to those with low C3concentrations (< median). Potential confounding factors included in the analyses included
Accepted Manuscript
Table 3
Odds ratios and 95% confidence intervals for MetS risk associated with elevated C3
concentrations, with effect modification by dietary fat intake
Dietary fat
(median % energy)
< dietary fat median
P > dietary fat median
P P interaction
C3 levels x
dietary fat on
MetS score
Total fat (33.40 %) 2.86 (2.29-3.56) < 0.0001 4.80 (2.77-8.33) < 0.0001 0.003
Total SFA (14.20 %) 2.96 (2.37-3.71) < 0.0001 4.05 (2.33-7.05) < 0.0001 0.02
Total MUFA (12.30%) 2.88 (2.30-3.62) < 0.0001 4.48 (2.62-7.56) < 0.0001 0.02
Total PUFA (4.67 %) 2.95 (2.35-3.69) < 0.0001 2.81 (1.86-4.03) < 0.0001 0.07
Odds ratios and 95% confidence intervals for the association between plasma C3
concentrations and the MetS, stratified according to dietary fatty acid composition and status
(median of fatty acids expressed as % energy), were determined by logistic regression
analyses comparing individuals with high C3 concentrations (> median) to those with low C3
concentrations (< median). P interaction values were calculated from the GEE linear regression
model [36] using the MetS score based on criteria used to define the MetS. Potential
confounding factors included in the analyses included age, gender, smoking status, physical