DESIGN OF FEEDER ROUTE NETWORK USING COMBINED GENETIC ALGORITHM AND SPECIALIZED REPAIR HEURISTIC
1. Dr. Prabhat Shrivastava
Assistant Professor (Transportation System Engineering) Department of Civil Engineering
Sardar Patel College of Engineering, Andheri (W) Mumbai – 400 058, India
E-mail: [email protected] Tel: 91 -22 – 26232192 Fax: 91 – 22 – 26237819
2. Dr. Margaret O’Mahony (Corresponding Author) Director (Centre for Transportation Research)
Head, Department of Civil, Structural and Environmental Engineering Trinity College, Dublin 2, Ireland
E-mail: [email protected] Tel: 353-1-6082084
DESIGN OF FEEDER ROUTE NETWORK USING COMBINED GENETIC ALGORITHM AND SPECIALIZED REPAIR HEURISTIC
ABSTRACT
In metropolitan cities an efficient integrated public transportation system is unavoidable in order to restrict unsustainable growth of private and intermediate transport modes. Well designed feeder routes and coordinated schedules to minimize transfer time from main transit to feeder buses play an important role. Past literature reveals that heuristic approach had been popular for design of routes and had been applied successfully in verities of network design problems. Non traditional optimisation technique especially Genetic Algorithms are also found to be very effective in generation of optimised feeder routes and schedules. In this research Genetic Algorithm first develops feeder routes and then a specialized heuristic Algorithm works as repair algorithm in order to satisfy demand of all the nodes. Thus the advantages of both Genetic Algorithm and Specialized Heuristic Algorithm are obtained in this method. The developed feeder route structure is found to be better in terms of load factors in buses, satisfaction of demand and waiting time for feeder buses as compared to existing scenario and earlier approaches adopted by authors far the same study area.
INTRODUCTION
In metropolitan cities of developed and developing countries suburban railway and public buses are the most common public transport carriers. Commuters’ dissatisfaction towards public transport system increases due to increased travel time, poor level of comfort, uneconomical operations and due to higher out of vehicle time especially at transfer points. These problems can be solved by appropriate coordination among major public transport modes. The successful coordination implies
• Traveller’s ability to transfer freely and conveniently between modes.
• Distinct service areas between each modes thereby minimising duplication of services.
• Adjustment and interrelationship of schedules and
• Joint fare structure
A poorly coordinated transfer can require long, irregular wait for infrequent connecting services. The point of balance between travellers demand for direct service and transit operator’s need for economy often lies with the level of attention given to the details of the transfer movement. Thus well designed feeder routes satisfying maximum demand with acceptable travel time are of prime concern. In order to minimise transfer time coordinated schedules have to be optimised.
Literature Review and Objective of Study
route is optimized by minimizing the total system cost, including operator and user costs, while considering diagonal links in the study network. Zhao and Ubaka (2004) presented a mathematical methodology for transit route network optimization. The goal was to develop effective computational tool for the optimization of large – scale transit route networks. The objectives were to minimize transfers and optimize route directness while maximizing service coverage. Agrawal and Mathew (2004) proposed two parallel genetic algorithm (PGA) models. The first was a global parallel virtual machine (PVM) parallel GA model. The second was a global message passing interface (MPI) parallel GA model. It was observed that the global PVM model performs better than the other. Fan and Machemehl (2004) formulated a multi – objective nonlinear mixed integer model for transit route network design problem (TRNDP). The proposed solution framework was consisting three main components: an Initial Candidate Route Set Generation Procedure (ICRSGP); a network analysis procedure; and a Heuristic Search Procedure (HSP). Five heuristic algorithms, including the Genetic Algorithm, local search, simulated annealing, random search and tabu search are employed as solution methods for finding an optimal set of routes from the huge solution space. Sensitivity analysis for each algorithm was conducted and model comparisons were performed.
Authors have communicated research papers on the development of feeder routes for the same study area using different approaches. In one of the research papers (Shrivastava and O’Mahony, Jan 2005) the authors developed feeder routes using a heuristic algorithm which was found to be very effective and demand of all the nodes was satisfied by the developed set of routes. Due to heuristic approach set of the routes can not be guaranteed to be at optimal level, it may give sub optimal results also. In another research (Shrivastava and O’Mahony, 2006) the authors developed feeder routes and schedules simultaneously using Genetic Algorithms for the same study area. The developed routes and schedules were optimum but the entire demand was not satisfied. This is because in the typical study area some of the nodes were not having good connectivity with other nodes. In view of this instead of 17 nodes only 16 were selected, the remotest node in the study area was not included. In this paper both of the approaches are combined and thus the benefits of both of them are obtained. The optimal set of feeder routes are first developed by Genetic Algorithms and if any demand remains unsatisfied, it is inserted / attached to best possible route by specialized heuristic approach which works as a repair algorithm. Thus the advantages of both the approaches are achieved in this research.
satisfy the entire demand the routes developed by Genetic Algorithms were modified by a well designed heuristic approach. Finally the modified routes are used for determination of coordinated schedules. As a case study, Dun Laoghaire DARTstation was selected. Dun Laoghaire is a rapidly growing suburb of Dublin city in Ireland. The coordination between DART services and Dublin buses (public buses) for this DART station is attempted.
DATA COLLECTION
The Dublin Area Rapid Transit (DART) is a suburban railway system in Dublin, running basically along the coastline of Dublin Bay from Greystones to Howth and Malahide. There are 32 stations on the existing DART line. Lack of coordination between public buses and DART services has been observed even during peak hours at many stations. Dun Laoghaire is one of the prominent DART stations from where large number of trips originate. It was decided to select Dun Laoghaire as the study area due to its land use pattern which allows greater scope of feeder bus services from the station. Considerable movement of commuters takes place towards many areas from the DART station.
north bound and eight south bound trains during the peak hour of 8 to 9 a.m. The schedule coordination for feeder buses is attempted for theses trains during the indicated peak hour.
PROPOSED METHODOLOGY
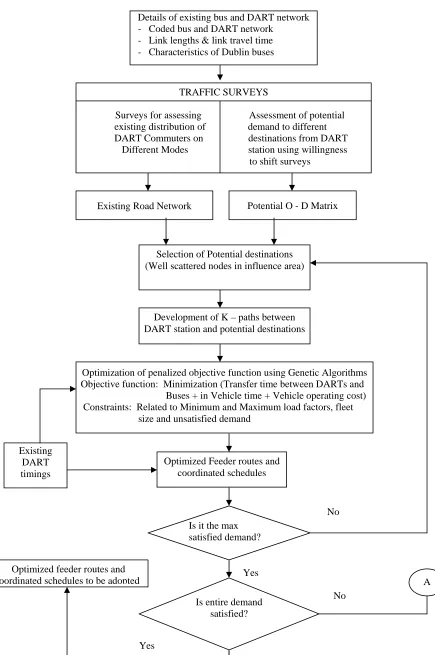
The over all methodology for development of feeder routes and coordinated schedules is presented in figure 1. The methodology is explained in following steps.
Step 1:
Potential demand matrix is developed with origin as DART station and destinations as identified in traffic surveys.
Step 2:
Travel distance matrix and connectivity details among various nodes were obtained from the map (Dublin street map, 2000). Travel distance matrix was converted into travel time matrix in ‘minutes’ using an average speed of 15 Km / hr to address the existing congestion level and road geometrics of influence area (Scot Wilson, 2000).
Step 3:
Other parameters are decided like capacity of buses, minimum and maximum load factors, maximum fleet size, minimum frequency per hour, multiplying constants to convert user and operator costs in to monetary value of ‘euro’, minimum and maximum lengths of routes.
Step 4:
Using the K-Path Algorithm (Eppstein David, 1994) K- shortest paths were developed between DART station and a set of destinations which is well scattered and covers entire influence area. The value of ‘K’ is adopted as five for the case study.
In this research work destinations were decided based on their locations so that larger portion of feeder route network is optimized by Genetic Algorithm and repair heuristic is used only for few nodes. In view of this various set of destinations which were located away from origin and well scattered in the influence area were selected. The set of destinations were selected for which maximum demand is satisfied with least number of ‘k’ paths using Genetic Algorithm and few node/nodes are left for repair heuristic.
K – indicates number of short paths which can be developed between a given origin (DART station) and potential destination. These short paths are developed in the increasing order of their lengths. In this research, value of ‘k’ is selected as five i.e. between each origin (DART Station) and potential destination. Five short paths are developed, of which first one is smallest and the last one is the largest. Out of these k – paths best one is selected after application of Genetic Algorithm (corresponding to optimized penalized objective function)
Step 5:
The programme to calculate penalised objective function (summation of objective function and penalties due to violation of constraints) is developed in ‘C++’ environment. The set of k – paths (five in number for our case study for each origin and potential destination) are used with Genetic Algorithm. The coding of a path and its corresponding frequency are done together in one string only. The binary digit coding to represent routes and schedules together has been adopted. The set of ‘k– paths’ and frequencies for which objective function along with penalties is minimum is selected as optimized routes and frequencies. These routes are used for application of specialized heuristics discussed in further steps. The frequencies are used to derive coordinated schedules for the existing schedules of DARTs. The details of objective function, penalties and application of GAs are discussed below.
Details of Objective Function, Penalties and use of GAs
The objective function is adopted as minimization of user’s and operator’s costs. The user’s cost is summation of in-vehicle time cost, transfer time cost between DARTs and buses. Operator’s cost is associated to running cost (vehicle operation cost) of buses. Constraints are related to load factor, fleet size and unsatisfied demand. Mathematically, the objective function and various constraints are as follows:
Objective Function
Minimize Total cost, Z = {Transfer time cost between DARTs and Coordinating buses + travel time cost
in buses on selected routes (In Vehicle time cost in buses) + Vehicle operation cost (VOC) of Dublin buses}
Mathematically it can be expressed as Minimize
Transfer Time between nth and sth bound DARTs and buses ( 1st term) C1
∑∑∑
j u l
passju (busjl - dartu ) δju.l +
∑∑∑
j u l
In vehicle time VOC
in bus (2nd term) (3rd term) C2
∑
j
passj×tinv_j + C3
∑
j j j
Tl
f
--- --- (1)Constraints
1. max
max .
L
CAP
N
Q
j j≤
×
Maximum load factor constraint (2)2. min
max .
L
CAP
N
Q
j j≥
×
Minimum load factor constraint (3)3.
∑
∈SR j
NBj =
∑
∈SR
k TP
j RT Nj*( )
≤ W (for all j ≤ SR) Fleet size constraint (4)
4. unsat j
d
∑
= 0 Unsatisfied demand constraint (5)Where,
j = Number of routes available at each stations (as per number of potential selected destinations) l = Number of buses available for uth north bound DART and vth south bound DART
VOC = Vehicle operating cost for Dublin buses
C1 = Cost of transfer time in Euro per minute, 11.32 cents/minute for the case study, (Steer Davies, 1994).
C2 = Cost of in vehicle time in Dublin buses, 0.076 cents/minute for the case study (Steer Davies, 1994).
C3 = Cost of operation of Dublin bus per Km., € 3.66 for Dublin buses for the case study, (Scot Wilson, 2000).
passju= Passengers transferring from uth north bound DART to jth route.
passjv= Passengers transferring from vth south bound DART to jth route.
passj = Total number of passengers transferring to jth route
busjl = Departure of lth bus on jth route
dartu = Arrival of uth north bound DART dartv = Arrival of vth south bound DART
δju.l = is a term which shows whether transfer of passengers is possible or not. It attains a value one if transfer from
δjv.l = is also a term which shows whether transfer of passengers is possible or not. It attains a value one if transfer
from vth south bound DART to lth bus on jth route at DART station is feasible otherwise it attains a value zero.
tinv_j = In vehicle time in bus on jth route
fj = Frequency of buses on jth route in terms of number of bus trips per hour.
lj = length of jth route in kilometers
T = Time period, hours
Qj.max = Maximum number of passengers on jth route for the given time period.
CAP = Seating capacity of bus, for Dublin buses it is taken as 74 (Scot Wilson, 2000). Lmax = Maximum load factor, it is adopted as 1.2 for the case study (Scot Wilson, 2000).
Lmin = Minimum load factor, adopted as 1 for the case study
dunsat = Unsatisfied demand
SR = Set of Routes
NBj = Number of buses required in any route ‘j’
j RT)
( = Round trip time of the bus on jth route in minutes = 2 tj (in minutes) + layover time (5
minutes for the case study)
tj = Total travel time on route in minutes including stopping times (Journey time)
TP = Time Period in minutes
Nj = Number of trips per hour times time period in hours under consideration ( fj * T)
W = Maximum number of available buses
The first two terms of objective function indicate user’s cost and the third term operator’s cost. User’s cost is taken as summation of costs associated in transferring from DART services (both nth and sth bound) to coordinating buses (first term) and cost of traveling time in buses (secondterm). The operator cost is in terms of vehicle operating cost, which is proportional to the distance traveled by buses (third term). Constants C1, C2 and C3
operations. The maximum load factor is the ratio of crush capacity and normal capacity of Dublin buses. The crush capacity is taken as 88 and normal capacity is 74 thus the maximum load factor which is the ratio of the two capacities is taken as 1.2 (Scot Wilson, 2000). The value of minimum load factor is taken as 1.00. Third constraint is associated with the fleet size. This constraint puts the upper limit on maximum number of available buses for operation. Fourth constraint ensures that maximum demand is satisfied and maximum number of commuter get coordinating buses during the period of analysis. The aim of schedule co-ordination is to provide coordinating buses to all commuters who transfer from trains to buses. Thus if more number of commuters are not able to get coordinating buses the penalty should be higher and it is added to objective function so that subsequently GA search for optimal or near optimal values is directed. The penalty corresponding to fourth constraint is proportional to ratio of demand unsatisfied to the capacity of buses. This penalty would have played more realistic role if data collection is done for whole day i.e. till last DART and last available bus.
The objective function and constraints in the study pose a constraint optimization problem; therefore penalty method is adopted for optimization (Deb 1995). Using the Genetic Algorithms the minimum value of penalized objective function is determined (best fitness). The routes and frequencies corresponding to this minimum value are optimal feeder routes and frequencies. These optimal frequencies are used to determine coordinated schedules of feeder buses.
Fitness function = Minimize (Objective Function + Penalties 1 to 4)
Penalty 1: if load factor is more than a maximum value (1.2 for the case study) Penalty 2: if load factor is less than minimum value (1 for the case study) Penalty 3: if fleet size exceeds a minimum value (25 for the case study) Penalty 4: if some demand remains unsatisfied
It is also observed in our typical traffic surveys that it takes about five minutes for commuters to reach at the bus stops located outside the station after arriving from DARTs. Thus transfer from a DART to a bus is feasible if the bus departs only after 5 minutes of scheduled arrival of the DART.
Step 6:
unsatisfied after application of GAs. The additional destination is added and again it is determined if there is any improvement in satisfaction of percentage demand. The number of destinations for which maximum demand is satisfied is selected. Thus by gradually augmenting number of destination maximum possible demand satisfaction is achieved. The minimum number of destinations leading to maximum satisfaction of demand is selected as potential destinations. If entire demand is satisfied in a particular combination of potential destinations then corresponding feeder routes and frequencies (for determination of coordinated schedules) are optimum. If entire demand is not satisfied then go to step 7.
Step7:
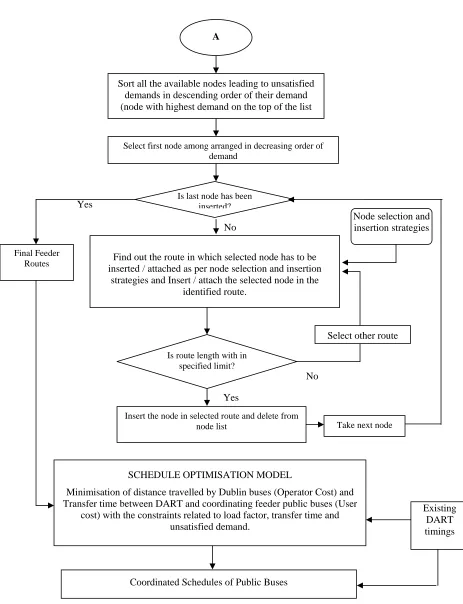
Find out the nodes /nodes leading to unsatisfied demand and insert these nodes in the developed feeder routes by heuristic node selection and insertion process. The node selection and insertion process acts as repair heuristics and routes are modified. Due to limitation in the length of paper it is not possible to give details about this algorithm. In view of this readers are advised to refer Shrivastava and Dhingra (2001) for detailed discussion on node selection and insertion process / strategies. . In this repair heuristics following innovative ways are discussed for development of feeder routes:
i. Determination of best path among others in which an identified node (destination) can be inserted. Path is selected based on saving in passenger walk time and increase in bus passenger time due to insertion of node. ii. After selecting best path the best way of insertion of node is identified. The best way is selected which gives
least delay to destinations following inserted node.
Step 8:
Once all the nodes are inserted the developed routes are used for determination of frequencies using Genetic Algorithms leading to optimum coordinated schedules for the existing schedules of DARTs.
Dhingra (2002) for detailed discussion on determination of coordinated schedules on fully developed feeder route network.
Use of Genetic Algorithms (GAs) for objective function and constraints
Genetic Algorithms (GAs) are based on exhaustive and random search techniques, found to be robust for optimizing non-linear and non-convex functions (Holland 1992). In this research Generational GAs with Reproduction, Crossover and Mutation operators is used (Goldberg 1989). The penalty method of constrained optimization is adopted (Deb 1995).
The proposed objective function is used with LibGA software of Genetic Algorithms in Linux environment to determine optimal frequencies on developed feeder route network (Lance Chambers 1995). Genetic Algorithms parameters are tuned for the objective function and thus type of process and best values of operators are decided. Roulette selection, simple random mutation and uniform crossover are adopted. Seed value as 1, pool size 30, crossover probability 0.85 and mutation probability 0.005 gave the lowest value of penalized objective function (objective function plus penalties). Thus these values are used for the analysis. A set of frequencies on various routes corresponding to the minimum value of the penalized objective function is used for determination of coordinated schedules on various routes.
The decision variables are routes and frequencies of buses during the application of Genetic Algorithm. The routes and frequencies are coded together in the same string. The most common coding method is to transform the variables to a binary string. GA performs the best when binary coding is adopted (Goldberg, 1989). The length of the string is determined as per the desired solution accuracy. In this study, routes and coordinating frequencies of each pair are coded into a single string. Figure 2 indicates typical binary digits coding for route no. 5 and route no.3 with frequencies 6 and 21 per hour. The first four bits show the route and last six bits show the corresponding frequency in a string.
parameters in the given problem. The heuristic part of algorithm does not take much computational time because few nodes are to be inserted on fully developed network.
RESULTS AND DISCUSSION
As discussed in the methodology well scattered minimum destinations satisfying maximum demand are selected as potential destinations. Maximum demand is satisfied when nodes 11, 12, 13, 15 and 16 are selected as potential destinations. Only 2.95% of demand remains unsatisfied for which heuristic node selection and insertion strategy is applied. Following routes are developed along with frequencies (for schedules) after application of Genetic Algorithms.
S. No. Nodes in feeder routes Length in ‘km’
1 1 – 3 – 11 4.5
2 1 – 2 – 3 – 17 – 12 6.75
3 1 – 4 – 6 – 7 – 13 8.00
4 1 – 6 – 7 – 8 – 15 10.25
5 1 – 2 – 5 – 10 – 9 – 16 9.00
Since the developed feeder route network does not satisfy 100% demand, due to absence of destination node ‘14’ in the above structure of feeder routes. Next stage of further modification of feeder routes using node selection and insertion strategies is adopted. Nodes are inserted / attached to above developed feeder routes. The frequencies associated to feeder routes in the earlier stage are discarded since fresh frequencies are required to be determined due to modification of routes. After applying heuristic node selection and insertion process the node 14 gets attached with third route and the length of third route increases from 8 km to 9.68 km. Figure 3 shows the finally developed five feeder route. Routes 3 and 4 partially overlap; also node ‘3’ is common to routes 1 and 2. Thus the overlapping aspects of routes are also successfully attempted in this research. The connectivity between ‘13’ and ‘14’ could be established by repair heuristic. The node ‘14’ was not included in the approach of Shrivastava O’Mahony (2006) as its demand was not satisfied by the approach adopted and was omitted.
developed by combination of Genetic Algorithm and Heuristic approach. In some of the earlier approaches links on spanning tree are added / removed to get best network. Thus the approach adopted in this research is quite different.
DART station as compared to Dun Laoghaire. Thus feeder routes for these destinations from Blackrock will be shorter.
The modelling exercise is carried out only for morning peak hour. The frequency of buses will change in the other hours of the day as per the demand. In fact traffic surveys should be conducted for whole day covering both peak and off peak hours and same methodology can be implemented to determine coordinated schedules of public buses during different periods of day. The whole day travel pattern will provide more realistic demand to different destinations for development of feeder routes, schedules and optimum fleet size for different periods of the day.
CONCLUSIONS
In the proposed model well scattered destinations away from the DART station satisfying maximum demand were selected as potential destinations. Feeder routes and frequencies leading to coordinated schedules were developed simultaneously from DART station to selected potential destinations using Genetic Algorithms. Preferably number of potential destination are selected as minimum as possible with maximum demand satisfaction. Selection of minimum destinations leads to less number of routes. If demands at some destinations remain unsatisfied then with the help of heuristic algorithm which works as repair algorithm such destinations are inserted/added to developed feeder route structure. After modification of route structure GAs are again applied to determine modified coordinated schedules. Following conclusions can be derived from the proposed modelling exercise.
1. In the proposed modelling exercise the optimised feeder routes and coordinated schedules are developed together in the 1st phase. Most of the routes are developed along with the coordinated schedules in this phase only. The coordinated schedules are further checked with second application of GAs. Thus in the proposed modelling approach most of the schedules and routes are complimentary to each other.
increases the probability of availability of seats to commuters though it is not very important when load factor remains less than a minimum value as has been experienced for the study area.
3. The selection of nodes as potential destinations plays a very important role for successful development of feeder routes for the typical locations of destinations in study area network under consideration. The network which is considered for analysis has nodes well scattered in the influence area and destinations having higher demands are closer to origin (DART station). Some of the destinations away from DART station have limited connectivity with other nodes. Selection of potential destinations away from the origin and well dispersed in the influence area develops feeder route structure which satisfy the maximum demand without any transfer. 4. The influence area of each station can be identified and the modelling exercise can be repeated with large scale
data collection for whole day, thus a fully integrated system can be developed in which DARTs can work as a main line haul facility and buses can feed the local areas. The coordinated schedules of buses can be found for each period of the day and hence their requirement can be determined for peak and off peak periods. The proposed methodology is able to design feeder routes without any further transfers and the entire demand is satisfied directly from the DART station. The model takes into account the overlapping aspect of different routes successfully.
5. On average, the developed model is able to satisfy more than 50% of demand within ten minutes waiting time and the entire demand is satisfied within twenty minutes of waiting time with an overall load factor of more than 50%. On some routes, 80 to 90 percent of demand is satisfied within ten minutes of waiting and many routes have load factors even more than 0.7. In the present scenario (not optimised), the load factor hardly attains a value more than 0.3 and also the average waiting time is in the range of 20 minutes or more. Thus the proposed model judiciously balances waiting time and load factors for feeder buses.
The proposed model can be implemented for development of feeder routes and coordinated schedules to any other study area if demands to various destinations and network connectivity details are known. Fully optimized feeder routes would be developed if higher demand nodes are well scattered and away from DART / railway station by Genetic Algorithm itself, otherwise repair heuristic will modify the feeder routes developed by GA. Moreover feeder routes without additional transfers are desired by planners. Other factors like transfer time, load factors in buses, fleet size, vehicle operating cost and availability of buses to all commuters are duly taken care both from users and operators point of view. Hence it can be concluded that the developed model can be of specific use to service planners working for coordinated operations of public transport modes.
REFERENCES
1. Agrawal J and Mathew T.V.(2004), “Transit route network design using parallel Genetic Algorithms” Journal of computing in Civil engineering ASCE 18, 248 – 256.
2. Baaj M.H. and Mahmassani H.S.(1995), “ Hybrid Route Generation Heuristic Algorithm for the Design of Transit Networks”, Transpn. Res.C, Vol. 3, No 1, pp 31 – 50
3. Chien Steven I –Jy, Dimitrijevic B.V and Spasovic L.N. (2003), “Optimization of Bus Route Planning in Urban Commuter Networks,” Journal of Public Transportation 6, pp. 53 - 80
4. Deb Kalyanmoy (1995), “Optimization for engineering design – Algorithms and Examples” Prentice Hall of India Pvt. Ltd. , New Delhi, India, pp. 290 – 320.
5. Dublin Street map (2000), published by ordinance survey of Ireland, 17th Popular Edition, Revised in 2000. 6. Dubois D., Bel G. and Llibre M.(1979), “A set of methods in Transportation Network synthesis and Analysis”.
Journal of Operation Research Society, Vol.30, No. 9, pp. 797- 808
7. Eppstein David (1994), “Finding the k shortest paths” Tech. Report 94-26, Department of Information and Computer Science, University of California, USA.
http://www.ics.uci.edu/~eppstein/pubs/Epp-TR-94-26.pdf accessed on 25.09.2004
9. Goldberg, D.E. (1989), “Genetic Algorithm in search, optimization and machine learning”, Addison-Wesley Publishing Co., Reading Mass, 412p.
10. Gundaliya P.J., Shrivastava Prabhat and Dhingra S.L. (2000), “Model for simultaneous routing and scheduling using Genetic Algorithm” Transporti Europei, Quarterly Journal of Transport Law, Economics and Engineering, Anno VI, n. 16, December 2000, pp. 10 – 19.
11. Holland, J.H. (1992), “Adoption in natural and artificial systems”, 2nd edition, MIT Press, Cambridge.
12. Lampkin, W. and Saalmans, P.D.(1967). “The design of routes, service frequencies and schedules for a Municipal Bus Undertaking: A Case Study”, Operation Research Quarterly Vol. 18, No 4, pp 375- 397.
13. Lance Chambers (1995).Practical Handbook of Genetic Algorithms Applications. Volume I, CRC Press, 555p. 14. Mandl, C. E. (1980), "Evaluation and Optimization of Urban Public Transport Networks", European Journal of
Operational Research, Vol. 6, pp. 31-56.
15. Pattnaik S.B., Mohan S. and Tom V.M. (1998), “Urban Bus Transit Route Network Design Using Genetic Algorithm” Journal Of Transportation Engineering, ASCE, Vol. 124 No 4, pp. 368 – 375.
16. Scott Wilson (2000), Final Report on Bus Network Strategy Appraisal Report for Greater Dublin Area. www.dublinbus.ie/about_us/pdf/swilson.pdf Accessed May 13, 2004.
17. Shrivastava Prabhat and Dhingra S.L. (2001), “Development of feeder routes for suburban railway stations using heuristic approach”ASCE journal of Transportation Engineering, USA, July/August 2001, Vol. 127, No. 4, pp. 334-341.
18. Shrivastava Prabhat and Dhingra S.L. (2002), “Development of co-coordinated schedules using Genetic Algorithms”ASCE journal of Transportation Engineering, USA, Jan/Feb, Vol. 128, No. 1, pp. 89-96.
19. Shrivastava Prabhat and O’Mahony Margaret (Jan 2005), “Modeling an integrated public transport system-A case study in Dublin, Ireland”, Submitted to ‘Transportation Research - A’ international journal published by Elsevier Science.
21. Silman L.A., Brazily Z. and Passy U.(1974), “Planning the rout system for Urban buses”. Computer and Operation Research, Vol. 1, pp. 201-211.
22. Steer Davies Gleave (1994). Dublin Transportation Initiative, Final Report and Technical reports (Ten), Stationery Office, Dublin.
23. Tom V.M. and Mohan S. (2003), Transit route network design using frequency coded Genetic Algorithm”, Journal of Transportation Engineering, ASCE, Volume 129, No. 2, pp. 186-195.
24. Zhao H. and Ubaka I. (2004) “Transit network optimization – minimizing transfers and optimizing route directness” Journal of Public Transportation 7, pp. 67 – 82
Dr. Prabhat Shrivastava is an Assistant Professor of Traffic and Transportation Planning, Department of Civil Engineering at Sardar Patel College of Engineering, University of Mumbai, India. Dr. Shrivastava had worked as a research fellow at Centre for Transportation Research, Trinity College, University of Dublin, Ireland during March 2004 to June 2005. His primary degree is in Civil Engineering thereafter he acquired Master of Technology in Transportation Planning from Indian Institute of Technology, Madras (Chennai) and Ph.D. from Indian Institute of Technology, Bombay (Mumbai) in the area of Intermodal Coordination. He has been involved in teaching, research and consultancy assignments related to Traffic and Transportation planning for last fifteen years. His research interests are integration of transport modes, routing and scheduling problems, simulation modelling and applications of advanced techniques for transportation modelling.
TABLE 1 Potential Demand to Various Destinations
Potential demand to various destinations Node No.
(code)
Destinations
7 – 8 a.m. 8 – 9 a.m. 7-9 a.m.
1 Dun Laoghaire DART Station 00 00 00
2 Dun Laoghaire College 39 202 241
3 Sallynoggin 17 103 120
4 Monks town 10 63 73
5 Deans Grange 16 93 109
6 Temple Hill 02 06 08
7 Black Rock 08 46 54
8 Stillorgan 13 77 90
9 Leopards town 02 08 10
10 Foxrock 02 08 10
11 Maple Manor / Cabinteely 02 04 06
12 Lough Linstown 13 78 91
13 Mount Merrion 02 15 17
14 University College of Dublin 04 23 27
15 Dundrum 06 31 37
16 Sandyford 03 15 18
TABLE 2 Details of Bus Schedules with Load Factors
DART Timings Bus Timings Av. Load Factors and number of
buses required S. No. North Bound DARTS South Bound DARTS Route 1 Route 2 Route 3 Route 4 Route 5 Route number Average load factor Number of buses required Over all load factor
1 08.08 08.02 8.07 8.07 8.07 8.07 8.07 1 0.40 3
2 08.15 08.09 8.27 8.19 8.22 8.27 8.27 2 0.64 6
3 08.23 08.20 8.47 8.31 8.37 8.47 8.47 3 0.33 6
4 08.29 08.25 8.43 8.52 4 0.70 5
5 08.33 08.31 8.55 - 5 0.83 5
6 08.38 08.36 7 08.43 08.45 8 08.49 08.53
9 08.58 -
10 Trains after 9 a.m.
Buses to be scheduled
after 9 a.m. Buses to be
scheduled after 9 a.m.
Buses to be scheduled after 9 a.m.
Total number of buses needed = 25
Table 3: Comparison between existing and proposed route network
Property for comparison
Existing Rout network in
the study area
Proposed route network
for the study area
Type of route network
Not a feeder route
network
Feeder route network
Average load factor on
routes
Less than 0.3
Over all load factor is
0.58
and is greater than 0.3 on
all routes
Waiting time / percentage
demand satisfaction
Average waiting time is
more than 20 minutes
No
Yes
Yes No
Yes
Is entire demand satisfied?
Optimization of penalized objective function using Genetic Algorithms Objective function: Minimization (Transfer time between DARTs and Buses + in Vehicle time + Vehicle operating cost) Constraints: Related to Minimum and Maximum load factors, fleet size and unsatisfied demand
TRAFFIC SURVEYS
Surveys for assessing Assessment of potential existing distribution of demand to different DART Commuters on destinations from DART Different Modes station using willingness to shift surveys
Potential O - D Matrix Existing Road Network
Optimized Feeder routes and coordinated schedules
Details of existing bus and DART network - Coded bus and DART network
- Link lengths & link travel time - Characteristics of Dublin buses
Existing DART timings
Development of K – paths between DART station and potential destinations
Is it the max satisfied demand?
Optimized feeder routes and coordinated schedules to be adopted
[image:23.612.81.516.77.732.2]Selection of Potential destinations (Well scattered nodes in influence area)
Figure 1 Methodology for development of feeder routes & coordinated schedules
A Is entire demand
satisfied?
Optimization of penalized objective function using Genetic Algorithms Objective function: Minimization (Transfer time between DARTs and Buses + in Vehicle time + Vehicle operating cost) Constraints: Related to Minimum and Maximum load factors, fleet size and unsatisfied demand
TRAFFIC SURVEYS
Surveys for assessing Assessment of potential existing distribution of demand to different DART Commuters on destinations from DART Different Modes station using willingness to shift surveys
Potential O - D Matrix Existing Road Network
Optimized Feeder routes and coordinated schedules
Details of existing bus and DART network - Coded bus and DART network
- Link lengths & link travel time - Characteristics of Dublin buses
Existing DART timings
Development of K – paths between DART station and potential destinations
Is it the max satisfied demand?
Optimized feeder routes and coordinated schedules to be adopted
Selection of Potential destinations (Well scattered nodes in influence area)
Figure 1 Methodology for development of feeder routes & coordinated schedules
Yes
No
[image:24.612.94.557.74.678.2]
Figure 1 Methodology for development of feeder routes & coordinated schedules
(Continued)
Yes
No
A
Sort all the available nodes leading to unsatisfied demands in descending order of their demand (node with highest demand on the top of the list
Select first node among arranged in decreasing order of demand
Node selection and insertion strategies Is last node has been
inserted?
Find out the route in which selected node has to be inserted / attached as per node selection and insertion
strategies and Insert / attach the selected node in the identified route.
Is route length with in specified limit?
Take next node Insert the node in selected route and delete from
node list
Select other route Final Feeder
Routes
Coordinated Schedules of Public Buses SCHEDULE OPTIMISATION MODEL
Minimisation of distance travelled by Dublin buses (Operator Cost) and Transfer time between DART and coordinating feeder public buses (User
cost) with the constraints related to load factor, transfer time and unsatisfied demand.
Pair no 1 Pair no 2
Route Frequency Route Frequency
0 1 0 1 0 0 0 1 1 0 0 0 1 1 0 1 0 1 0 1
Route no 5 Frequency 6 Route no 3 Frequency 21
FIGURE 3 Developed feeder route network for Dun Laoghaire DART station
17 1
2 3
4
5 6 7
8
10 9
16
11 13
Joins node 15 at DUNDRUM
Joins node 12 at LOUGH LINSTOWN
Dun Laoghaire DART Station
Route number 2
Route number 1 Route number 5
Route number 3
Blackcock DART station