Granular Explosives and Initiation Sensitivity
Ralph Menikoff
Theoretical Division
Los Alamos National Laboratory
Los Alamos, NM 87544
December 2, 1999
Abstract
Fundamental chemical reaction rates are temperature depend. However, the initiation process for a hetero-geneous explosive is dominated by peaks in the temperature field called hot spots. Numerical simulations typically use empirical pressure dependent reaction rates. These can be viewed as a subgrid model that accounts for unresolved reaction phenomenon. The limitation of simple burn rates is most severe for the initiation of a detonation wave by a weak stimuli. The problem is particularly acute for accident scenarios that involve damaged explosives. A granular explosive captures the dominant features of damage; a het-erogeneous length scale from the grain size and an additional degree of freedom from porosity. Continuum mechanical simulations on the meso-scale are used to better understand how the hot-spot distribution varies with mechanical stimuli, in particular, the strength of a compaction wave in a granular bed. A physical understanding of the formation and growth of hot spots is needed to develop improved subgrid burn models that encompass a wider domain of applicability.
1
Introduction
Experimentally measured reaction rates are temperature dependent; usually, characterized by an Arrhe-nius rate law, R(T)=Z exp( Ta=T). Yet for numerical simulations of detonation waves in plastic bonded
explosives (PBX) empirical pressure dependent reaction rates, such as “Forest Fire” [23], or the “Ignition and Growth” model [18], are typically used. The underlying reason for this disparity between fundamental chemical rate laws and empirical burn models is due to the fact that a PBX is a heterogeneous material con-sisting of small crystals of an explosive material held together with an inert binder material. Due to the strong temperature dependence, the overall reaction rate of a heterogeneous explosive is dominated physically by peaks in the temperature field, called hot spots. The hot spots occur on the length scale of the heterogeneities and are absent from continuum models based on homogenized constitutive properties. Consequently, the ef-fective burn rate is not determined by the average temperature. Empirical burn rates represent subgrid models which account for the short wavelength reaction phenomenon not resolved within a simulation.
Hot spots strongly affect the ignition process for a detonation wave. Experiments have shown that shock initiation is qualitatively different in a PBX than the thermal explosion theory describing a homogeneous ex-plosive [9, 8]. Appropriately calibrated, burn models can reproduce important ignition characteristics such as run distance to detonation as a function of shock pressure. However, empirical burn rates are only effective for applications in which the hot-spot distribution is similar to that occurring in the experiment used to calibrate the burn model. In other words, currently available burn models have a limited domain of applicability.
Figure 1:HMX molecule, C4H8N8O8, in the crystalβ-phase. Color code for atoms: carbon in green, nitrogen in blue,
oxygen in red and hydrogen in grey.
systems are designed and burn models are calibrated. In addition, accident scenarios frequently lead to dam-aged explosives. Damage is known to greatly increase the sensitivity of an explosive to initiation. In effect, damage introduces additional heterogeneities and exacerbates the effect of hot spots.
Compared to a homogeneous explosive, a granular explosive has two distinctive properties; a heteroge-neous length scale from the grain size distribution, and an additional degree of freedom from porosity. These are key features of a damaged material. Consequently, a granular explosive is a suitable model, albeit simpli-fied, for a damaged explosive. With a typical grain size on the order of 0.1 mm, the spatial and temporal scales relevant to hot spots, microns and sub micro-seconds respectively, are too small to observe experimentally with currently available diagnostic techniques. However, meso-scale simulations can be used as numerical experiments to gain an understanding of the mechanisms that generate hot spots and their subsequent evo-lution. In meso-scale simulations individual grains are resolved and the time evolution computed based on a continuum mechanics model. This is in the same spirit as the shock initiation simulations of Mader [21, § 3C], [22, § 3.3], but in the lower pressure regime where material strength is relevant.
Simulations of piston driven compaction waves in a granular bed of coarse grain HMX (cyclo-tetramethylene-tetranitramine, see figure 1) have been performed [26]. Piston velocities from 200 m/s to 1000 m/s were cho-sen. This covers the range from weak ignition experiments that display a deflagration-to-detonation transition to prompt shock ignition. However, the focus of this study is on the mechanical behavior that generates hot spots, and the grains are treated as inert. Averaging the flow transverse to the propagation direction results in a smooth quasi-static wave profile. Weak partly compacted waves are fully dispersed while strong fully compacted waves have a wave width of 1 to 2 grain diameters. As expected, on average the end states across a compaction wave obey the Hugoniot jump conditions. The temperature fluctuations behind the wave front are in the range that would affect ignition.
Hot spots can be much smaller than a grain diameter. They are affected by dissipative mechanisms and wave strength. The simulations include plastic work, frictional heating modeled as shear viscosity and bulk viscosity. For weak initiation, material strength (hence plastic work and shear heating) are important for generating hot spots. In the regime of prompt shock initiation, void collapse is the dominant mechanism for generating hot-spots.
subgrid models with a wider domain of applicability. The central theme is incorporating more information about the hot-spot distribution to better characterize the physics of ignition.
2
Shock Initiation
Explosives can be divided into two general classes; homogeneous and heterogeneous. A homogeneous explosive can be gaseous, liquid or single crystal of a solid. Solid explosives are typically heterogeneous. For example, TNT pressed to less than full density is heterogeneous due to the presence of voids. Composites are an important class of heterogeneous explosives. This is exemplified by a plastic bonded explosive, which is composed of explosive crystals held together by a binder. Similarly, a liquid explosive with bubbles or containing grit is heterogeneous. The inhomogeneities can also be in the velocity field. A turbulent gas can behave as a heterogeneous explosive.
The process by which a detonation wave is initiated differs qualitatively between homogeneous and het-erogeneous explosives. Thermal ignition characterizes homogeneous explosive while hot spots dominate initiation in a heterogeneous explosive. This has important consequences for initiation sensitivity and safety of an explosive.
The significance of hot spots in the ignition of solid explosives has been recognized for a long time, see Bowden and Yoffe [7]. The distinguishing properties of shock initiation of homogeneous and heterogeneous explosives was clarified in the seminal experimental studies by Campbell, Davis, Ramsay and Travis [9, 8]. To place the meso-mechanics simulations in perspective, the key results of their shock initiation experiments are briefly summarized. Though in the experiments a shock is driven through the bottom plate on which the explosive rests, conceptually we can consider the explosive to be initiated with a piston driven shock.
For a homogeneous explosive shock heating is sufficient to start a thermal runaway. The experiments on liquid explosives [9] show the following stages for shock initiation:
1. The explosive next to the piston face burns first. After an induction time, thermal runaway occurs. The resulting high pressure generates a detonation wave in the shock compressed explosive. See ref. [17] for a mathematical analysis.
2. The detonation wave overtakes the lead shock. At first the detonation wave in the unshocked explosive is overdriven. This is due to the higher than normal detonation pressure in the shock compressed explosive.
3. The detonation speed then slows until a steady state CJ1detonation wave is reached.
As expected for thermal ignition, the time to detonate is sensitive to the initial temperature of the explosive and to the shock strength.
Initiation of a heterogeneous explosives is quite different. The experiments on solid explosives [8] show the following stages for shock initiation:
1. The lead wave is a reactive shock. The pressure gradient from the reaction behind the wave increases the wave strength.
2. An abrupt transition from a reactive shock to a detonation wave occurs downstream of the piston.
3. In contrast to a homogeneous explosive, there is no overshoot in the detonation speed and the explosive next to the piston face is only partially burned.
Wedge experiments have been used to quantify shock initiation of solid explosives. This experiment measures the time and distance to detonation as a function of shock pressure. A key observation is that for many explosives in the range of interest the data is well approximated by a straight line on a log-log
Figure 2: Time to detonation for shock ignition in HMX. Red line is based on wedge experiment data for PBX-9501 [12, p. 115, § 7.2]. Blue line is adiabatic induction time based on shock temperature and Arrhenius reaction rate [28] and [12, p. 113, § 5.7]. The plateau around 15 GPa is due to the latent heat of melting. The CJ pressure is around 36 GPa.
scale [27]. This is known as a Pop plot.2For PBX-9501, which is an HMX based explosive, the experimental time to detonation and the adiabatic explosion time based on the shock temperature are shown in figure 2. It is important to note that up to about 10 GPa the shock heating is insufficient for melting. Furthermore, the reaction rate of HMX is not significant below the melting temperature. Thus, the shock temperature is not sufficient to initiate a detonation. Yet the Pop plot indicates that a detonation wave is generated after only a few micro-seconds.
An even more dramatic demonstration of the necessity for hot spots is the single crystal HMX initiation experiments of Craig, reported in [10]. A strong shock wave with a pressure of 32 GPa failed to initiate a detonation within a 7.4 mm length of explosive. To place this in context, the CJ pressure of PBX-9501 is 36 GPa. Moreover, a 7.2 GPa shock in PBX-9501 would detonate after 3 mm. Thus, a single crystal is quite insensitive.
Craig’s data and the adiabatic induction times based on the shock temperature are shown in figure 3. The Arrhenius parameters, quoted in Mader [22, p. 218], are listed in table 1. The data appears to be compatible with the estimated induction time. However, considering the uncertainties the agreement is fortuitous. The uncertainties are due to extrapolating the reaction rate from low temperatures and in the equation of state. The shock temperature is sensitive to the value assumed for the specific heat. The specific heat listed in table 1 for the solid is 30% larger than the measured value at atmospheric pressure and slightly below the melting temperature. With this value for specific heat, at a pressure of 32 GPa the shock temperature is about 1000 K. In addition, this estimate assumes that the Hugoniot locus in the (particle velocity, shock velocity)-plane is linear. However, the high pressure Hugoniot points from Craig’s experiments do not lie on the line extapolated from the low presure data. The measured value of shock velocity and particle velocity in conjunction with the estimated specific heat imply that the temperature behind a 32 GPa shock is in the range of 1200 to 1300 K. Aside from the issue of the shock temperature, Craig experiment places a lower limit on the induction time of 1 µs for the state behind a 32 GPa shock.
2Mathematically, the time to detonation and the distance to detonation can not both be straight lines. Consequently, the straight line
Figure 3:Time to detonation for shock ignition in single crystal HMX. Symbols correspond to Craig’s experiments [10, p. 1065]. The lines indicate the adiabatic induction time based on the shock temperature and an Arrhenius reaction rate. The blue line is for the liquid rate. The black and red lines are for the solid rate and indicate the sensitivity to uncertainties in shock temperature. The rates are listed in table 1.
liquid solid
Z 5:10
13 4
:810
5 µs 1 Pre-exponential factor
Ta 2:6510
4 1
:710
4 K Activation temperature
Q 5. 5. MJ/kg Heat release
κ 4:10
10 4
:10
10 kJ
=(mµsK) Thermal conductivity Cp 1:510
3 1
:9510
3 (MJ/kg)/K Specific heat χ=
κ
ρCp 1
:410
7 1
:110
7
(mm)
2
=µs Thermal diffusivity
Table 1: Arrhenius parameters for HMX. The liquid parameters are from [28] and [12, p. 113, § 5.7]. The solid parameters are discussed in [22, p. 218].
At high temperatures the solid rate is considerably slower than the standard Arrhenius reaction rate cor-responding to liquid HMX.3This indicates that the reaction mechanism for HMX can vary with the pressure
and temperature regime. Possibly there is an auto-catalytic step requiring diffusion on the molecular scale that can take place for the liquid but not for the solid. In fact, a single Arrhenius rate is not sufficient to explain all the thermal explosion data. Thermal data for time to ignition can be fit with an empirical three step reaction mechanism proposed by McGuire and Tarver [25]. The first step is endothermic associated with melting, the second step is weakly exothermic associated with pyrolsis, and the third step is highly exothermic associated with the decomposition into stable gaseous products. Due to the cross over in the rate limiting step, the adi-abatic induction time varies abruptly with temperature. At 1000 K the induction time is much greater than a
µs and at 1100 K the induction time is much less than a µs. This is roughly the transition temperature needed
to explain Craig’s data. Considering the sensitivity to the model parameters this may well be fortuitous. The low solid reaction rate below the CJ pressure implies that the build up of a reactive shock is not
3Theδ-phase of HMX has a faster reaction rate than theβ-phase. In the temperature and pressure regime of shock initiation, the time
[image:5.612.108.447.305.394.2]Figure 4: Hot spot temperature corresponding to induction time of 1 µs for HMX (based on approximations by Bod-dington [6] and liquid Arrhenius parameters). Solid red line corresponds to hot-spot size of 1 µm and dashed line to size of 10 µm. For comparison black line is shock temperature in granular HMX with 35% porosity, and dotted blue line is liquid-solid coexistence curve.
dominated by bulk volume burn. The von Neumann spike corresponds to Craig’s high pressure data point (42 GPa). The induction time of 50 ns would lead to a reaction zone width of 0:4 mm. This is 2 to 3 times
larger than the reaction zone width inferred from experiments of the HMX based explosive PBX-9404 [22, p. 23, table 1.4]. It implies that temperature fluctuations from heterogeneities are important for propagat-ing detonation waves as well as ignition. Moreover, hot spots triggered by the heterogeneities overwhelm instabilities that in a homogeneous explosive lead to a cellular structure within the reaction zone.
Solid explosives typically contain a few per cent volume fraction of voids. The porosity has a considerable effect on initiation sensitivity. The effect is clearly shown in the experiments of Campbell and Travis [10]. They initiated a detonation wave in a solid explosive (PBX-9404 and Composition B-3) and then arranged for a weak shock wave to propagate into the region ahead of the detonation wave. They found that the weak shock quenched the propagating detonation wave when the time delay between the detonation and shock waves exceeded a critical value. The critical time delay decreased with increasing shock strength. This effect is known as shock desensitization. It is due to the weak shock compressing out the pores and reducing the degree of heterogeneity within the explosive.
Alternatively, damage to an explosive increases its porosity and is known to greatly increase ignition sensitivity. Porosity also affects the shock Hugoniot. At a given shock pressure, the temperature increases with porosity. Because the melt temperature increases with pressure, a lower shock strength is needed for melting in a porous material. This is important for ignition of HMX since the reaction rate is greater in the liquid phase. A granular bed can be used to study the effect of porosity.
Reaction within a hot spot is a thermal process. It involves a competition between reaction which gen-erates heat and thermal conduction which lowers the temperature. Coarse grained HMX has an average diameter of100 µm. The hot-spot size is expected to be on the order of 1 µm. For porous HMX the
hot-spot temperature required for an induction time comparable to shock initiation, on the order of 1 µs, is shown in figure 4. The critical hot-spot temperature depends weakly on shock strength and is in the range of 700 to 900 K. This is 100 to 200 degrees above the melt temperature for HMX. Since the latent heat of melting (L=0:22 MJ/kg) corresponds to a temperature difference (∆T=L=Cp) of about 200 K, melting has
It is important to recognize that thermal runaway can occur within a hot spot but not initiate a detonation wave, provided that the hot spot is small. Numerical simulations by Mader [20] demonstrate the phenomenon; the energy released by thermal runaway rapidly increases the hot-spot pressure leading to an expansion which lowers the temperature and quenches further reaction. This implies that initiation does not result from a single hot spot. Rather it is a collective phenomena of many hot spots that can be treated statistically. This is the underlying rationale for a subgrid burn model.
The thermal runaway occurs so fast that a constant volume burn occurs within a hot spot [15]. Rather than completely quenching the reaction, the rapid expansion may start a deflagration wave on the surface of a hot spot. For every HMX molecule reaction leads to about 10 molecules of products. The large molar increase implies surface burning can greatly increase the pressure and contribute to the initiation process.
A simple estimate for the quenching of a hot spot is instructive. The thermodynamic state of a constant volume burn is determined from the equation of state and the heat released by the reaction. For HMX in its initial state, constant volume burn results in a pressure of15 GPa and a temperature of1800 K. The rapid
pressure rise of the hot spot sends a shock into the surrounding material. The impedance mismatch leads to a shock with a pressure of8 GPa, temperature of490 K, and a particle speed of0:9 mm=µs. The shock
temperature is below the melt temperature and there is negligible reaction in the shocked HMX. The hot-spot temperature from the resulting adiabatic expansion goes as
T=T0=(ρ0=ρ)
Γ
=[r0=r(t)]
3Γ
=[r0=(r0+ut)]
3Γ
=(1+ut=r0)
3Γ
where r0is the initial hot-spot radius, u is the velocity of the hot-spot surface andΓis the Gr¨uneisen
coeffi-cient. Typically,Γ1. For r0=0:01 mm, after a time t=r0=u=0:01 µs, the temperature would have fallen
by a factor of 2 3=0:125. Consequently, the hot-spot temperature falls below the temperature at which
reaction is significant in less than 10 nanoseconds.
Stronger shocks affect the hot spot in two ways. First, the hot-spot density increases. This results in a constant volume burn with a higher pressure and higher temperature. Second, the material surrounding the hot spot is at a higher pressure. This slows the expansion rate and enables more material to burn before the temperature drop quenches the fast reaction.
Qualitatively the process of shock ignition in a heterogeneous explosive is as follows. Hot spots are formed as a shock passes over heterogeneities. The hot spots react very rapidly and the resulting energy release raises the pressure. The pressure increase is acoustically coupled to the shock front and increases the shock strength. The increased shock strength increases the intensity of subsequent hot spots which results in more burn and a further increase in the pressure. The positive feedback cycle continues to strengthen the reactive shock until a detonation wave is established.
Mader performed shock initiation simulations. He modeled a PBX as an explosive with voids in both two-dimensions [21, § 3C] and three-two-dimensions [22, § 3.3]. Though limited in resolution by the computer power available at the time, the simulation clearly demonstrate the dominant role of hot spots in shock ignition. The meso-mechanical simulation performed here are aimed at extending this work to the lower pressure regime where material strength becomes important.
Even for an explosive at the same porosity, the nature of the heterogeneities, such as grain size or cast versus pressed manufacturing process, affects the ignition process. Experiments indicate that increasing the specific surface area of the explosive, e.g., smaller grains, increases the sensitivity [14]. Also properties of a steady state detonation, such as the curvature effect and the failure diameter, are affected by material heterogeneities. Meso-mechanical simulations in which the heterogeneities are resolved should lead to a quantitative understanding of these effects. This is important for determining the effect of aging on the sensitivity and performance of a plastic bonded explosive.
3
Phenomenological Burn Models
The reactive Euler equations are widely used to model initiation phenomena in solid explosives. For engineering simulations the cell size is much greater than the scale of material heterogeneities. The limited resolution necessitates using a homogenized constitutive relation for the explosive. Since temperature fluc-tuations on the scale of the heterogeneities are eliminated by the homogenization, burn models must account for the effect of hot spots on the reaction rate. Presently, all burn models are phenomenological, though, their form is often motivated by heuristics based on hot spots. A wide variety of applications have been studied with these models. To understand the limitations of this approach, the best currently available burn models are briefly described.
3.1
Forest Fire Model
[23], [21, § 4.1]Wedge experiments are used to determine the Pop plot or distance of run to detonation. These experiments provide additional data on the initiation process. The time history or trajectory of the reactive shock is measured as it evolves into a detonation wave. For different initial shock pressures, the trajectories can be normalized by picking the origin at the detonation point. For many explosives, the backwards trajectories follow a larger portion of the same curve as the initial shock pressure is decreased. This has been very clearly demonstrated for RDX by Lindstrom [19]. The coincidence of the shock trajectories is known as the single curve build up principle. It implies that the Pop plot also describes the build up of a reactive shock and thus characterizes shock initiation.
The Forest Fire model is based on the single curve build up principle. The model assumes a single reaction progress variable and that the reaction rate depends only on the pressure. The pressure dependence is determined such that the lead reactive shock follows the build up curve derived from the Pop plot. The analysis is conceptually similar to the derivation of the Chisnell-Whitham rule for the change in shock speed with the area of a converging duct [31, §8.1]. This is an approximation for the evolution of the shock speed based on the value of the Riemann invariant for the characteristic impinging on the shock from behind the front. Here the change in the Riemann invariant is due to the source term for reaction instead of the variation in the cross sectional area of a duct. In addition to the Pop plot, the Forest Fire rate requires the reactive shock Hugoniot. It is determined from the initial particle velocity and shock velocity measured in a series of wedge experiments.
It is noteworthy that the Chisnell-Whitham rule can be applied to a converging shock in cylindrical or spherical geometry. The approximate solution compares quite well to the analytic Guderley solution. This is because a rapidly accelerating shock outruns the characteristics from behind except for those very close to the front. Similar, a reactive shock accelerates very fast and its motion is determined largely by the reaction immediately behind the front.
Two aspects of the Forest Fire model require additional comment. First, the reaction rate depends on the choice of the reactive equation of state used for the explosive; i.e., P(V;e;λ)where the reaction progress
variableλ=0 corresponds to the reactants andλ=1 corresponds to the reaction products. Typically, the
reactants and products are assumed to be in pressure and temperature equilibrium. On the short time scale of initiation, heat conduction is not sufficient for temperature equilibrium. The equilibrium approximation works because pressure is a stable variable and the empirical calibration of reaction rate compensates for the mixture rule. Second, the Forest Fire model produces a detonation wave with a profile similar to that of a weak detonation rather than the classical ZND4profile. This is a consequence of assuming a reactive shock. In order to get the correct Chapman-Jouguet state for an underdriven detonation, the numerical width of the detonation wave has to be appropriately determined by adjusting the artificial viscosity used for shock dissipation.
3.2
Ignition and Growth Model
[18]The ignition and growth model assumes a single reaction progress variable. Experiments [14] and heuris-tic arguments motivate a reaction rate of the form
Rate(V;P;λ)=I(1 λ)
x
(V0=V 1)
r
+G(1 λ)
xλyPz
; (1)
where I, x, r, G, y and z are fitting parameters. The first term represents ignition of hot spots and the second term represents the subsequent growth of reaction. The parameters are fit to pressure or velocity history data from one dimensional shock ignition experiments.
Associating the growth of reaction with burning on the surface of spherical hot spots motivates choosing
y=
2
3. The coefficient G would then be associated with hot-spot surface area, though, its peculiar dimensions
does not make the relation straight forward. To fit gauge data for shock initiation at different input pressures, different values are selected for G. This limits the predictive capability of the model.
3.3
JTF Model
[16]The JTF model is a more elaborate version of an ignition and growth model. It introduces internal degrees of freedom for the mass fraction of hot spots f , the hot-spot temperature Ths, and the pressure of the first shock
Ps. In a shock capturing algorithm, the passage of a shock is detected based on the artificial viscous pressure
and its rate of change.
Upon passage of a shock, the hot-spot temperature is given an initial value Ths(Ps)and then its evolution
is obtained by integrating the equation
d dtThs=
ΓThs
K d dtP C
1 p
d
dtq; (2)
whereΓis the Gr¨uneisen coefficient, K is the non-reactive isotropic bulk modulus, dtdq is the heat loss due
to thermal conduction and Cpis the specific heat at constant pressure. The initial temperature is assumed to
have the form
Ths(Ps)=T0
1 mT0 Ta ln Ps P0 1 ; (3)
where P0and T0are reference pressure and temperature, respectively, Tais the activation temperature and m
is a fitting parameter.
The mass fraction of the hot spots is governed by a rate equation
d
dtf =(1 f) ZTaβ
T2 hs exp Ta Ths (4)
where Z is a pre-exponential frequency factor andβ=
∂T
∂λjp
;h(h is specific enthalpy) is a material parameter
analogous to thermicity.
The average burn rate is given by
d dtλ=µ
d dtf+
h
1 λ µ(1 f) i
f f0
1 f0
+
G(P;Ps); (5)
where µ is the mass fraction of material that can evolve into hot spots, f0is a threshold value for hot spots,
and G(P;Ps)is an empirical function constrained to approach the Forest Fire rate at high values of the shock
pressure. The original model [16] uses
G(P;Ps)=G0P
1+
F
(Ps)G0Ps
; (6)
where G0is a fitting parameter and
F
(Ps)is the Forest Fire rate. Compared to the previous model, the firstterm corresponds to the initiation of hot spots and the second term (set to 0 for f< f0) to the growth of hot
3.4
Limitations of Burn Models
The success of empirical burn models in fitting a wide variety of experimental data is an indication that the reactive Euler equations have the appropriate degrees of freedom to describe the mechanical response of an explosive. The big caveat is determining an average reaction rate. Empirical models make the tacit assump-tion that the hot-spot distribuassump-tion is the same as the calibraassump-tion experiment. In addiassump-tion, they are formulated in terms of the pressure rather than the temperature. This implies a subgrid model for the reaction since fundamentally reaction rates are highly temperature dependent. It also avoids the sensitivity of simulations to uncertainties in the thermal material properties. Moreover, calculated temperatures are generally inaccurate due to the stiff solid equation of state and relative insensitivity of the flow to the thermal component of the pressure.
Modeling assumptions do limit the domain of applicability of burn models. Upon extrapolation the better models can describe the behavior of an explosive qualitatively. The determination of the failure diameter of an explosive is an example which probes the limits of a burn model. It is a threshold phenomenon sensitive to the hot-spot distribution, and difficult to predict accurately. Multiple waves also affect the hot-spot distribution and can cause significant errors in the average burn rate. Shock desensitization is an example. The models in the preceding sections do not have an internal degree of freedom to account for the change in void fraction. Multiple shock Forest fire [21, p. 213] accounts for desensitization by limiting the reaction rate to correspond to the pressure of the first shock. The JTF model does the same by choosing the reaction term associated with the growth of hot spots to be a function of shock pressure as well the current pressure, Eq. (6). Another example of multiple waves is corner turning. In this case side rarefactions greatly reduce the growth of hot spots and can even lead to zones in which the reaction is quenched. Finally, burn models have not been designed for weak stimulus and problems like deflagration-to-detonation transition. Weak stimuli lead to long reaction times which makes it more likely that multiple wave will affect the growth of the reaction.
Meso-mechanical simulations resolve the scale on which hot spots evolve. An understanding of this scale is needed to develop better subgrid burn models. The simulations may suggest trends and fitting forms that can be used to extend the domain to which the models can be applied.
4
Deflagration-to-Detonation Transition
Damage is known to increase the initiation sensitivity of an explosive. In effect, damage introduces additional heterogeneities and exacerbates the effect of hot spots. A granular bed is a model for a damaged material. It has an additional degree of freedom associated with damage, namely, the porosity. In addition, the heterogeneities are characterized by the distribution of grain sizes and can be measured. This circumvents the difficult question of characterizing a damaged material.
Ignition mechanisms are an important issue for explosive safety. Weak stimuli lead to deflagration waves which under some circumstances can transit to a detonation. This process goes by the name of deflagration-to-detonation transition (DDT). One dimensional experiments have been performed to study DDT in granular explosives [24, 29]. The process is quite similar to shock initiation in a PBX but occurs on larger spatial and temporal scale, 100 mm and 100 µs respectively, that enable more detailed measurements.
The piston driven DDT tube experiments [24, 29] are conceptually the same as those [8] discussed in section 2. For the DDT experiments, piston velocities of a few 100 m/s are used. This drives a compaction wave in which the compression behind the wave is due to the grains deforming to reduce the porosity. The deformation of the grains leads to hot spots that trigger surface burning. The build up in pressure increases the burning and evolves into a detonation wave downstream of the piston. The detonation wave then overtakes the lead compaction wave.
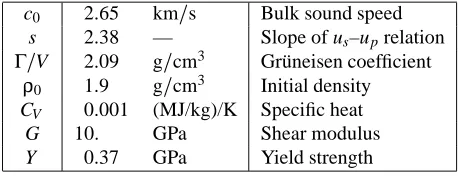
c0 2.65 km=s Bulk sound speed s 2.38 — Slope of us–uprelation Γ=V 2.09 g=cm
3 Gr¨uneisen coefficient ρ0 1.9 g=cm
3 Initial density
CV 0.001 (MJ/kg)/K Specific heat
G 10. GPa Shear modulus
[image:11.612.163.392.20.108.2]Y 0.37 GPa Yield strength
Table 2: Parameters for constitutive relation of HMX.
Meso-scale models are clearly needed to determine the temperature fluctuations and to characterize the hot spots. It is important to understand the mechanical response before dealing with the complications of burning. The simulations presented in the next section are aimed at understanding the fluctuations on the scale of a grain.
5
Simulations of Compaction Waves
The simulations of compaction waves presented here used a 2-D Eulerian continuum mechanics code developed by Prof. David Benson at the University of California, San Diego. The algorithm is described in [2, 4]. Previously, the code has been used to simulate granular flow [3, 5]. Here the main focus is on the fluctuations in the temperature field behind the wave front.
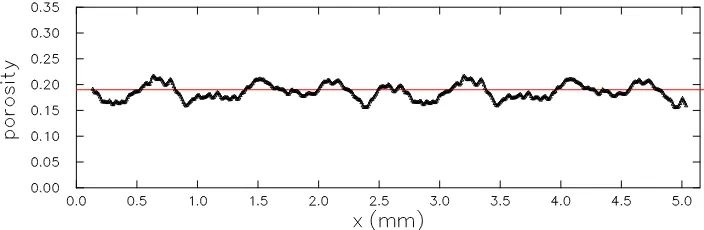
The setup for the computations is the granular bed shown in figure 5a. The bed corresponds to a tightly packed random distribution of grains with a diameter of 140 µm10 %. All simulations used a cell resolution
of 10 µm. An elastic-plastic constitutive model is assumed for the grains. Constitutive parameters for HMX are listed in table 2. The initial porosity of the bed is 19 %. The inhomogeneous nature of the material is displayed in the large amplitude short wavelength variation of the porosity profile shown in figure 5b. When averaged over two grain diameters the variations have a small amplitude as shown in figure 5c. The averaging corresponds to a homogenization and indicates that the appropriate spatial scale is set by the grain size. The local variations in the average density are responsible for the fluctuations that appear behind the front of a compaction wave. More details of the simulations are described in Ref. [26].
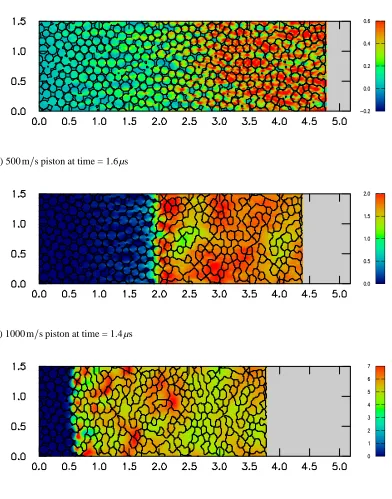
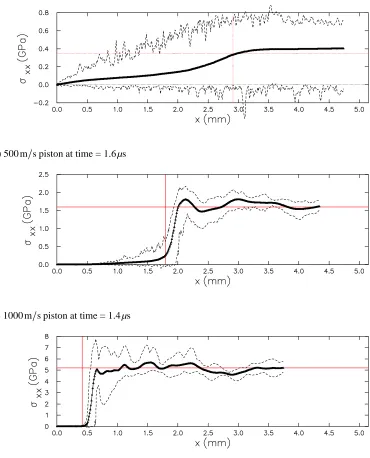
A compaction wave is driven by a piston at the right boundary. The top and bottom boundaries are periodic. Three cases are described. The 2-D stress fields shown in figure 6, and the 1-D stress profiles shown in figure 7 illustrate different wave types:
1. At a low piston velocity, 200 m/s, the average stress is below the yield strength of the grains. Stress con-centrations at grain contacts exceed the yield strength causing local deformation of the grains that allow the grains to pack more closely and decrease the porosity. The wave is fully dispersed and partly compacted. The elastic response of the grains leads to stress fingers at the head of the wave. This is the analog of the stress bridging that occurs when a granular bed is statically loaded.
2. At a moderate piston velocity, 500 m/s, the average stress exceeds the yield strength. The grains distort sufficiently to squeeze out all the porosity. The wave is fully compacted. The elastic response leads to a smooth precursor.
3. At a higher piston velocity, 1000 m/s, the wave speed exceeds the longitudinal sound speed in the grains. The compaction wave outruns the elastic wave leading to a shock-like wave. The width of the wave profile is 1 to 2 grain diameters.
a) Density (pores are void and shown in gray)
b) Porosity profile
[image:12.612.68.420.441.556.2]c) Porosity, smoothed with running average over 2 grain diameters
a) 200 m=s piston at time = 2.0 µs
b) 500 m=s piston at time = 1.6 µs
[image:13.612.67.459.79.578.2]c) 1000 m=s piston at time = 1.4 µs
a) 200 m=s piston at time = 2.0 µs
b) 500 m=s piston at time = 1.6 µs
[image:14.612.69.439.87.545.2]c) 1000 m=s piston at time = 1.4 µs
Figure 7:Stress profile (σxx) of compaction waves. Dashed lines correspond to the minimum and maximum values. Red
200 500 1000 m/s Piston velocity 1100 2100 3400 m/s Wave speed
0.98 1 1 – Solid volume fraction 0.34 1.6 5.2 GPa Stress
[image:15.612.165.390.21.81.2]322 424 720 K Temperature
Table 3: State behind compact wave based on porous Hugoniot for uniaxial-strain.
of the waves is determined largely by the conservation laws, i.e., the algebraic Hugoniot jump conditions.5
This implies that the average material response is insensitive to the heterogeneities. It is a necessary condition for homogenization or applying continuum mechanics utilizing average material properties. It is noteworthy that the elastic-plastic constitutive model of the pure grain also gives three wave types: weak elastic wave, split wave composed of an elastic precursor followed by a plastic wave, and a single strong plastic wave. The heterogeneities cause the elastic wave to be dispersed. Homogenization models need to account for changes in the effective material properties as well as modifying the solid parameters such as the initial density and sound speed.
The temperature behind the compaction wave for the three cases are shown in figures 8, 9, 10. The plots of the temperature field show that hot spots occur near the contact surfaces of the grains, and are subgrain in dimension. The profiles show that the temperature behind the wave corresponds to the value on the porous Hugoniot locus. For the 1000 m/s piston the average temperature is sufficient for an induction time of1µs.
The high temperature compared to solid HMX at the same shock pressure is due to the larger Hugoniot energy∆e=P∆V resulting from the porosity which leads to a larger∆V . For the lower piston velocities the
Hugoniot temperature alone is not sufficient for ignition. The temperature fluctuations can be characterized by the distribution of mass fraction as a function of temperature. The peak of the distribution is close to the mean and corresponds to the Hugoniot temperature. Temperatures below the mean tend to occur near the centers of grains. The high temperature tail of the distribution is due to hot spots.
In contrast to coarse grain averages, fluctuations in the hydrodynamic variables are sensitive quantities. They depend on the geometry of the heterogeneities and the dissipative mechanism. For a granular bed, the packing of the grains and the number of contacts per grain differ between two and three dimensions. Hot spots tend to occur around the contact between grains. Consequently, the temperature distribution from a two-dimensional simulation can only qualitatively describe a physical granular bed that is inherently three-dimensional. Burning would further increase the importance of dimensionality. Very likely the evolution of hot spots leads to burning on the grain surfaces. The surface to volume ratio is a critical parameter and depends on the dimension. Also, the connectivity of the pores is strongly dependent on the dimension. The connectivity affects gas permeation between pores and consequently the rate at which a deflagration wave can spread out from a hot spot.
The simulations include three dissipative mechanisms: plastic work, frictional heating modeled by a shear viscosity and artificial bulk viscosity. When the shock pressure is below the yield strength (low ve-locity piston), the dissipation is dominated by plastic work when the grains deform to decrease the pore volume. At pressures above the yield strength, the shock heating exceeds the plastic work and other dissipa-tive mechanisms dominate the wave profile. For high shock pressures, the dominant dissipadissipa-tive mechanism is undoubtably due to hydrodynamic pore collapse or micro-jetting.6When the shock front overtakes a pore the front surface is blown off at roughly twice the particle velocity and then stagnates on the back surface converting the excess kinetic energy into heat. This is the principal mechanism for generating hot spots in Mader’s study of shock initiation [21, § 3C] and [22, § 3.3].
5The offset in the shock position is due to the time delay in forming the shock profile. For partly compacted waves there is an
additional error associated with the treatment of the stress deviator for the porous Hugoniot.
6A similar phenomena is the collapse of a gas bubble within a liquid. The resulting energy concentration leads to a high local pressure
(a) Temperature field
(b) Temperature profile (dashed lines correspond to the minimum and maximum values)
[image:16.612.67.420.241.353.2](c) Temperature distribution behind wave (3 mm<x<4 mm)
(a) Temperature field
(b) Temperature profile (dashed lines correspond to the minimum and maximum values)
[image:17.612.77.455.73.187.2](c) Temperature distribution behind wave (3 mm<x<4 mm)
(a) Temperature field
(b) Temperature profile (dashed lines correspond to the minimum and maximum values)
[image:18.612.64.419.243.354.2](c) Temperature distribution behind wave (2:5 mm<x<3:5 mm)
A major complication is due to melting. On the micro-second time scale of shock initiation, the burn rate is only significant above the melting temperature. But when a material melts the yield strength vanishes and the shear viscosity is greatly diminished. Hence melting limits the dissipation from plastic work and frictional heating. Moreover, the simulations have neglected the crystal anisotropy of the HMX grains. In addition, the resolution of the simulations is limited. Half the mass of a grain is within 2 cells of its interface. With higher resolution the dissipative energy is likely to be more concentrated. This would result in hot spots having a higher peak temperature but a smaller area. Consequently, the temperature distribution in these simulations should be regarded as qualitative in nature. They do show that compressive waves in a granular bed lead to hot spots with sufficiently high temperature for reaction.
Burning and the build-up to ignition are beyond the scope of the present work. Reaction can be included in the computations. Mader [21, 22] has done reactive simulations of shock initiation in an explosive with voids using an Arrhenius reaction rate. More recently Conley [11] has performed meso-mechanics simulations of shock initiation in a granular explosive using the McGuire and Tarver [25] three-step burn model. Further work is needed to understand the physically appropriate dissipative mechanisms, the effect of melting and the appropriate reaction rate, the effect of dimensionality and numerical issues related to resolution. The problem becomes more difficult as the wave strength is decreased towards the DDT regime.
6
Final Remarks
Simple continuum models are needed for engineering scale simulations. Computational limitations re-quire that the cell size be much larger than the length scale of the material heterogeneities. This necessitates employing homogenized constitutive relations based on coarse-grain averaged thermodynamic quantities. This approach works well for the mechanical properties of an inert material. However, for a reactive material with a temperature sensitive reaction rate, the average reaction rate is not uniquely determined by the average thermodynamic variables due to the short wave length temperature fluctuations caused by the heterogeneities. For many applications, the subgrid fluctuations can be accounted for with empirical burn models. Em-pirical models break down for problems that are sensitive to the fluctuations. Weak initiation of an explosive falls into this category. A burn model applicable over a wide range of initiation conditions requires a subgrid burn model that correctly incorporates the underlying physics.
Reaction in a solid explosive is triggered by the peaks in the temperature fluctuations known as hot spots. The pressure-temperature regime of hot spots causes them to melt. This is important since the reaction rate in the liquid phase is very much faster than in the solid phase. The insensitivity of explosive grains, in particular single crystal HMX, implies that bulk volume burn of the solid is not significant for initiation. Rather the dominant mechanism is the formation and evolution of hot spots. This is the initiation and growth concept employed by the empirical models described in section 3.
Meso-mechanics simulations can be used to determine the hot-spot distribution for a particular stimulus. The preceding section shows that for a granular explosive hot spots are generated within the compaction wave profile. The rise time of the profile is on the order of∆t=(grain size)/(wave speed). For the 500 m/s piston,
∆t0:1 µs. This is shorter than the 1 µs induction time for hot spots with a temperature in the range of 700 to
900 K. The disparate time scales implies that the formation of the hot spots can be modeled separately from the subsequent burn. The thermal runaway of a hot spot occurs very fast and can be treated as a constant volume burn. The resulting high pressure leads to a rapid expansion of the hot spot. An important question is the end state of the expansion. For small hot spots the reaction will be quenched while larger hot spots will evolve into a deflagration wave. The conditions for the transition have not yet been analyzed.
The average burn rate for the growth phase then depends on the speed of the deflagration wave and on the area it encompasses. Ignition and growth models use a simple Pnreaction rate. This is motivated by the regression rate for a deflagration wave in a propellant. This can be justified with a burn model based on a two-step reaction; solid!gas!products, for HMX see [30] and references therein. The limiting factor in
the regression rate is the heat flux to vaporize the solid. The heat flux depends on the flame stand-off distance which is controlled by the gas density and determined largely by the pressure.
When the stand-off distance shrinks to zero the regression rate is limited by the coefficient of thermal diffusion. For HMX the maximum regression rate is on the order of 10 m/s. This is well below the detonation velocity,8 km/s. Though the total surface area of all the grains is large, the time to burn a single grain
would lead to a reaction zone width much larger than a few grain diameters which is observed. Consequently, reaction growth from surface burning can only be important for the early stage of initiation. As the detonation pressure is approached some other growth mechanism is needed. There are two possibilities; increasing the number of hot spots or increasing the surface area which can burn. The number of hot spots can increase as a result of the interaction of pressure waves generated when hot spots ignite. This is the analog of the cellular structure that occurs in gaseous detonations. Additional burning surfaces can be generated by slip surfaces resulting from shear flow induced by heterogeneities and the crystal anisotropy. Dissipation from shear heating would ignite burning along the shear layers.
Meso-mechanical simulations with burn should provide the insight needed to understand in detail how the heterogeneities affect ignition. Improved subgrid models may require additional internal degrees of free-dom, such as porosity or surface area, and governing equations for their dynamics. A more general growth model based on a chain branching type of reaction may also be necessary. The JTF model can be viewed as a sequence of two reactions [16]. A reaction rate that depends on the heterogeneities and the dissipative mechanism is needed to better account for the effect of multiple waves.
Acknowledgments
This work supported by the U.S. Department of Energy under contract W-7405-ENG-36. The author wishes to thank Prof. David Benson, Univ. of Calif. at San Diego, for making available the code he developed for the meso-mechanical simulations. The compaction wave simulations were joint work with Ed Kober [26].
References
[1] M. R. BAER AND J. W. NUNZIATO, A two-phase mixture theory for the deflagration-to-detonation
transition in reactive granular materials, Int. J. Multiphase Flow, 12 (1986), pp. 861–889.
[2] D. J. BENSON, Computational methods in Lagrangian and Eulerian hydrocodes, Computer Methods in Applied Mechanics and Engineering, 99 (1992), pp. 235–394.
[3] , An analysis by direct numerical simulation of the effects of particle morphology on the shock
compaction of copper powder, Modelling Simul. Mater. Sci. Eng., 2 (1994), pp. 535–550.
[4] , A mixture theory for contact in multi-material Eulerian formulations, Computer Methods in Applied Mechanics and Engineering, 140 (1997), pp. 59–86.
[5] D. J. BENSON, V. F. NESTERENKO, F. JONSDOTTIR,AND M. A. MEYERS, Quasisttic and dynamic
regimes of granular material deformation under impulse loading, J. Mech. Phys. Solids, 45 (1997),
pp. 1955–1999.
[7] F. P. BOWDEN ANDY. D. YOFFE, Initiation and Growth of Explosion in Liquids and Solids, Cambridge Univ. Press, Cambridge, UK, 1952.
[8] A. W. CAMPBELL, W. C. DAVIS, J. B. RAMSAY,ANDJ. R. TRAVIS, Shock initiation of solid
explo-sives, Phys. Fluids, 4 (1961), pp. 511–521.
[9] A. W. CAMPBELL, W. C. DAVIS, ANDJ. R. TRAVIS, Shock initiation of detonation in liquid
explo-sives, Phys. Fluids, 4 (1961), pp. 498–510.
[10] A. W. CAMPBELL ANDJ. R. TRAVIS, The shock desensitization of PBX-9404 and composition B-3, in Proceedings of Eighth Symposium (International) on Detonation, Albuquerque, NM, July 15–19, 1985, White Oak, Silver Spring, Maryland 20903–5000, 1986, Naval Surface Weapons Center, pp. 1057– 1068.
[11] P. A. CONLEY, Eulerian Hydrocode Analysis of Reactive Micromechanics in the Shock Initiation of
Heterogeneous Energetic Materials, PhD thesis, Univ. of Calif., San Diego, 1999.
[12] T. R. GIBBS ANDA. POPOLATO, eds., LASL explosive property data, Univ. of Calif. Press, 1980.
[13] B. F. HENSON, B. W. ASAY, R. K. SANDER, S. F. SON, J. M. ROBINSON, ANDP. M. DICKSON,
Dynamic measurement of the HMXβ–δphase transition by second harmonic generation, Phys. Rev.
Lett., 82 (1999), pp. 1213–1216.
[14] P. HOWE, R. FREY, B. TAYLOR, AND V. BOYLE, Shock initiation and the critical energy concept, in Proceedings of Sixth Symposium (International) on Detonation, Office of Naval Research, 1976, pp. 11–19.
[15] T. L. JACKSON, A. K. KAPILA,ANDD. S. STEWART, Evolution of a reaction center in an explosive
material, SIAM J. Appl. Math., 49 (1989), pp. 432–458.
[16] J. N. JOHNSON, P. K. TANG, AND C. A. FOREST, Shock-wave initiation of heterogeneous reactive
solids, J. Appl. Phys., 57 (1985), pp. 4323–4334.
[17] A. K. KAPILA ANDJ. W. DOLD, A theoretical picture of shock-to-detonation transition in a
homo-geneous explosive, in Ninth (International) Symposium on Detonation, Portland, OR, Aug. 28, 1989,
1989, pp. 219–227.
[18] E. L. LEE ANDC. M. TARVER, Phenomenological model of shock initiation in heterogeneous
explo-sives, Phys. Fluids, 23 (1980), pp. 2362–2372.
[19] I. E. LINDSTROM, Plane shock initiation of an RDX plastic bonded explosive, J. Appl. Phys., 37 (1966), pp. 4873–4880.
[20] C. L. MADER, Shock and hot spot initiation of homogeneous explosives, Phys. Fluids, 6 (1963), p-p. 375–381.
[21] , Numerical Modeling of Detonation, University of California Press, 1979.
[22] , Numerical Modeling of Explosives and Propellants, CRC Press, Baca Raton, FL, second ed., 1998.
[23] C. L. MADER ANDC. A. FOREST, Two-dimensional homogeneous and heterogeneous detonation wave
propagation, Tech. Rep. LA-6259, Los Alamos Scientific Lab., 1976.
[24] J. M. MCAFEE, B. ASAY, W. CAMPBELL,ANDJ. B. RAMSAY, Deflagration to detonation in granular
HMX, in Ninth (International) Symposium on Detonation, Portland, OR, Aug. 28, 1989, 1989, pp. 265–
[25] R. R. MCGUIRE ANDC. M. TARVER, Chemical decomposition models for the thermal explosion of
confined HMX, TATB, RDX and TNT explosives, in Proceedings of Seventh Symposium (International)
on Detonation, Naval Surface Weapons Center, 1981, pp. 56–64.
[26] R. MENIKOFF ANDE. KOBER, Compaction waves in granular HMX, Tech. Rep. LA-13546-MS, Los Alamos National Lab., 1999. Also available on the web at,
http://t14web.lanl.gov/Staff/rsm/Papers/CompactWave/CompactWave.pdf.
[27] J. B. RAMSAY AND A. POPOLATO, Analysis of shock wave and initiation data for solid explosives, in Proceedings of Fourth Symposium (International) on Detonation, Office of Naval Research, 1965, pp. 233–238.
[28] R. N. RODGERS, Thermochemistry of explosives, Thermochimica Acta, 11 (1975), pp. 131–139.
[29] H. W. SANDUSKY ANDR. R. BERNECKER, Compressive reaction in porous beds of energetic
materi-als, in Eighth International Symposium on Detonation, 1985, pp. 881–891.
[30] M. J. WARD, S. F. SON,ANDM. Q. BREWSTER, Steady deflagration of HMX with simple kinetics: A
gas phase chain reaction model, Combust. Flame, 114 (1998), pp. 556–568.
![Table 1: Arrhenius parameters for HMX. The liquid parameters are from [28] and [12, p](https://thumb-us.123doks.com/thumbv2/123dok_us/933866.606242/5.612.153.402.18.237/table-arrhenius-parameters-hmx-liquid-parameters-p.webp)
![Figure 4: Hot spot temperature corresponding to induction time of 1µs for HMX (based on approximations by Bod-dington [6] and liquid Arrhenius parameters)](https://thumb-us.123doks.com/thumbv2/123dok_us/933866.606242/6.612.161.395.21.230/figure-temperature-corresponding-induction-approximations-dington-arrhenius-parameters.webp)