The 1999 DARPA Off-Line Intrusion Detection
Evaluation
Richard Lippmann, Joshua W. Haines, David J. Fried, Jonathan Korba, Kumar Das Lincoln Laboratory MIT, 244 Wood Street, Lexington, MA 02173-9108
Email: [email protected] or [email protected]
Abstract. Eight sites participated in the second DARPA off-line intrusion de-tection evaluation in 1999. A test bed generated live background traffic similar to that on a government site containing hundreds of users on thousands of hosts. More than 200 instances of 58 attack types were launched against vic-tim UNIX and Windows NT hosts in three weeks of training data and two weeks of test data. False alarm rates were low (less than 10 per day). Best de-tection was provided by network-based systems for old probe and old denial-of-service (DoS) attacks and by host-based systems for Solaris user-to-root (U2R) attacks. Best overall performance would have been provided by a com-bined system that used both host- and network-based intrusion detection. De-tection accuracy was poor for previously unseen new, stealthy, and Windows NT attacks. Ten of the 58 attack types were completely missed by all systems. Systems missed attacks because protocols and TCP services were not analyzed at all or to the depth required, because signatures for old attacks did not gen-eralize to new attacks, and because auditing was not available on all hosts. Promising capabilities were demonstrated by host-based systems, by anomaly detection systems, and by a system that performs forensic analysis on file sys-tem data.
Keywords: intrusion detection, evaluate, attack, audit, test bed
1 Introduction
The widespread deployment and high cost of both commercial and government-developed intrusion detection systems has led to an interest in evaluating these sys-tems. Technical evaluations that focus on algorithm performance are essential for ongoing research. They can contribute to rapid research progress by focusing efforts on difficult technical areas, they can produce common shared corpora or data bases which can be used to benchmark performance levels, and they make it easier for new re-searchers to enter a field and explore alternate approaches. System evaluations that focus on additional practical issues including cost, ease of use, and traffic handling capacity are also useful for determining capabilities of complete deployable systems. Without careful evaluations, installing an intrusion detection system could be detri-mental because it might lead to a relaxation of vigilance based on unproven assump-tions concerning system performance. It might also lead to inefficient use of trained personnel if systems produce many difficult-to-analyze false alarms. A careful assess-ment of intrusion detection systems is essential to understand capabilities and limita-tions and construct an effective security posture that makes use of detection and pre-vention mechanisms.
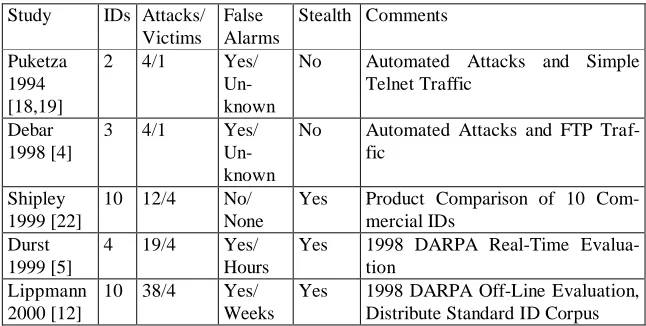
[image:2.612.145.468.138.301.2]It is difficult and costly to perform reliable, systematic evaluations of intrusion de-tection systems. As a result, few such evaluations have been performed. Table 1 sum-marizes characteristics of important past evaluations that have compared multiple intrusion detection systems. It includes early studies which describe a methodology that can be used for technical evaluations [4,18,19], the most recent and extensive system evaluation of commercial products that we are aware of [22], and the real-time [5] and off-line [12,14] components of the 1998 DARPA intrusion detection evalua-tion. The first column in Table 1 provides the first author and date of the study, the second column indicates the number of intrusion detection systems evaluated, and the third column provides the number of attack types used and also the number of unique victim machines attacked. The fourth column indicates whether the study analyzed the number of false alarms produced for normal background traffic and also the duration
Table 1. Characteristics of past intrusion detection evaluations. Study IDs Attacks/
Victims False Alarms
Stealth Comments
Puketza 1994 [18,19]
2 4/1 Yes/ Un-known
No Automated Attacks and Simple Telnet Traffic
Debar 1998 [4]
3 4/1 Yes/ Un-known
No Automated Attacks and FTP Traf-fic
Shipley 1999 [22]
10 12/4 No/ None
Yes Product Comparison of 10 Com-mercial IDs
Durst 1999 [5]
4 19/4 Yes/ Hours
Yes 1998 DARPA Real-Time Evalua-tion
Lippmann 2000 [12]
10 38/4 Yes/ Weeks
of background traffic used to measure false alarm rates. The next column indicates whether stealthy versions of attacks were used in an attempt to evade intrusion detec-tion systems, and the final column provides addidetec-tional comments on the study.
Results are not shown in Table 1 because many studies were informal and didn’t provide detailed information and because metrics differ widely across studies. The primary performance metric in all studies is the attack detection rate for each attack type used. This metric depends on details of the attacks and on the specific version of the intrusion detection system that was tested. It also is insufficient when used alone. It must be combined with false alarm rates for normal traffic to assess the human workload required to operate intrusion detection systems and dismiss false alarms. False alarm rates above hundreds per day make a system excessively expensive to deploy, even with high detection accuracy. Unless a system provides forensic informa-tion which makes alerts or putative detecinforma-tions easy to analyze, security analysts will not trust alerts and may spend many hours each day dismissing false alarms. Low false alarm rates combined with high detection rates, however, mean that alerts can be trusted and that the human labor required to confirm detections is minimized. Only recent DARPA evaluations have measured false alarm rates with a large quantity of rich background traffic. Other important metrics used by some studies include cost of commercial systems, ease of software installation and use, traffic handling capacity, and run-time memory and CPU requirements.
As can be seen from Table 1, evaluations have become more complex and extensive over the years. Initial evaluations included few systems, few attack types, did not include stealthy attacks, and included little normal background traffic to evaluate false alarm rates. The 1998 off-line DARPA evaluation includes 10 systems, 38 attack types, weeks of rich background traffic, stealthy attacks, and also led to a corpus or data base of attacks and background traffic that is being widely used for evaluation and development of intrusion detection systems. The first two evaluations in Table 1 describe initial research programs designed to develop a methodology for intrusion detection evaluation [4,18,19]. Both studies incorporated scripting software to provide repeatability by automating generation of attacks and background traffic. Few attack types were used in these studies and background traffic consisted either of a small number of automated telnet or FTP sessions. Both studies demonstrated the impor-tance of repeatability for intrusion detection system development. Initial low detection and high false alarm rates were improved by cyclical testing and development with repeatable attacks and background traffic. The second study [4] also noted that gener-ating realistic normal background traffic was complex and time-consuming in hetero-geneous computing environments.
eluded many systems. Most of the systems evaluated rely on attack “signatures” to detect old or known attacks. New signatures can often be added by hand or downloaded from a remote site. This evaluation focused on practical system charac-teristics such as ease of use and cost, and did not measure false alarm rates for nor-mal background traffic. It did, however, use network load-generating software to demonstrate that some network-based intrusion detection systems fail to detect at-tacks at high network loads.
The last two rows in Table 1 are for real-time and off-line DARPA 1998 evalua-tions. As can be seen from the table, the off-line evaluation is the most complex performed to date. It was an initial attempt at a comprehensive evaluation which included background traffic to measure false alarm rates, many attacks, and more than eight different intrusion detection systems. This exploratory evaluation was limited. It included only intrusion detection systems developed under DARPA spon-sorship, only attacks against UNIX hosts, and background traffic designed to be similar to traffic on one Air Force base. Six research groups participated in this statistically-blind evaluation to provide unbiased measurement of current perform-ance levels. The off-line evaluation, performed by MIT Lincoln Laboratory, included weeks of training and test traffic, more than 300 instances of 38 attack types, and resulted in an archival 1998 intrusion detection corpus or database [12,14]. This corpus can be processed simultaneously at many sites to evaluate and develop re-search systems and it continues to be used for algorithm development and as a base-line for future evaluations. The real-time evaluation, performed by the Air Force Research Laboratory (AFRL), evaluated a smaller number of systems which have real-time implementations using a more complex network, fewer attacks, and four hours of traffic [5]. Results of the 1998 evaluation helped determine the strengths and weaknesses of alternative technical approaches and had a strong influence on DARPA intrusion detection research goals. Further off-line and real-time evaluations which build on the initial 1998 effort were performed in 1999. This paper reports on the results of the off-line 1999 evaluation. Results and lessons learned from the 1998 off-line evaluation are first summarized, the 1999 off-line evaluation is described, 1999 results are presented, and suggestions are provided for future evaluations. Fur-ther details on the 1999 off-line evaluation are available in [3,10,13,14].
2 Summary of the 1998 Off-Line Evaluation
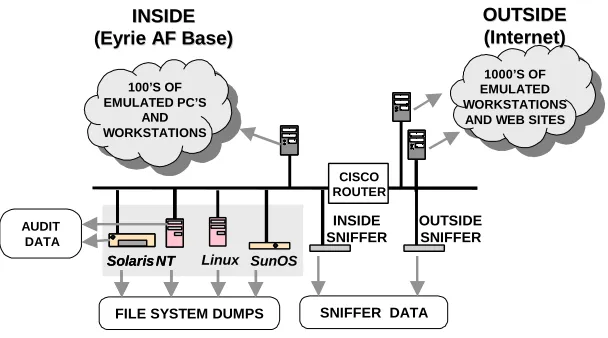
flows between the inside of one Air Force base and the outside internet. This ap-proach was selected for the evaluation because hosts can be attacked without degrad-ing operational Air Force systems and because corpora containdegrad-ing background traffic and attacks can be widely distributed without security or privacy concerns. A rich variety of background traffic is generated in the test bed which looks as if it were initiated by hundreds of users on thousands of hosts. The left side of Figure 1 repre-sents the inside of the fictional Eyrie Air Force base created for the evaluations and the right side represents the outside internet. The 1998 evaluation did not include the Windows NT victim machine or the inside sniffer shown on the left of Figure 1, but instead focused exclusively on UNIX and router attacks. Automated attacks were launched against three inside UNIX victim machines (SunOS, Solaris, Linux) and the router from outside hosts. More than 300 instances of 38 different attacks were embedded in seven weeks of training data and two weeks of test data. Machines labeled “sniffer” in Figure 1 run a program named tcpdump [11] to capture all pack-ets transmitted over the attached network segment.
Six research sites participated in the blind 1998 evaluation and results were ana-lyzed to determine the attack detection rate as a function of the false alarm rate. Performance was evaluated for old attacks included in the training data and new attacks which only occurred in the test data. Detection performance for the best sys-tems was above 60% correct at and below a false alarm rate of 10 false alarms per day for both old and new probe attacks and attacks where a local user illegally be-comes root (U2R). Detection rates were mixed for denial of service (DoS) attacks and remote-to-local (R2L) attacks where a remote user illegally accesses a local host. Although detection accuracy for old attacks in these two categories was roughly 80%, detection accuracy for new and novel attacks was below 25% even at high false alarm rates. These results demonstrated that current intrusion detection systems do not detect new attacks well and refocused research goals on techniques which can
INSIDE
INSIDE
(
(Eyrie Eyrie AF Base)AF Base)
SunOS Solaris
Solaris NTNT
CISCO ROUTER
AUDIT DATA
SNIFFER DATA FILE SYSTEM DUMPS
Linux
INSIDE SNIFFER
OUTSIDE SNIFFER 100’S OF
EMULATED PC’S AND WORKSTATIONS
1000’S OF EMULATED WORKSTATIONS
AND WEB SITES
OUTSIDE
OUTSIDE
(Internet)
[image:5.612.158.462.141.310.2](Internet)
detect new attacks. Results of the real-time evaluation generally agreed with those of the off-line evaluation. Detection rates for the systems and attacks in common were similar. Two interesting results from the off-line evaluation were that slow stealthy scans were not well detected by some intrusion detection systems and false alarm rates of a network-based system used by the Air Force were similar to those of a reference keyword-based system used in the off-line evaluation.
3 Conclusions from the 1998 Evaluation
The 1998 evaluation uncovered a widespread interest in obtaining training and test corpora containing normal traffic and attacks to develop and evaluate intrusion de-tection systems. To date, more than 90 sites have downloaded all or part of the 1998 off-line intrusion detection archival corpus from a Lincoln Laboratory web site [14]. Information from sites which have downloaded this corpus indicates that it is being used to evaluate and develop both commercial and research intrusion detection sys-tems (e.g. [23]) and to train security analysts. A processed subset of this corpus was also redistributed as part of a contest sponsored by the International Conference on Knowledge Discovery in Databases [6]. This conference attracted 24 participants who used modern approaches to pattern classification to achieve high performance on a constrained intrusion detection task.
4 Overview of the 1999 Evaluation
The 1999 evaluation was a blind off-line evaluation, as in 1998, but modified based on suggestions from 1998 and also with major extensions to enhance the analysis and cover more attack types. Figure 1 shows a block diagram of the 1999 test bed. Major changes for 1999 are the addition of a Windows NT workstation as a victim, the addition of an inside tcpdump sniffer machine, and the collection of both Windows NT audit events and inside tcpdump sniffing data for inclusion in archival data provided to participants. Not shown in this figure are new Windows NT work-stations added to support NT attacks, new inside attacks, and new stealthy attacks designed to avoid detection by network-based systems tested in 1998. The Windows NT victim machine and associated attacks and audit data were added due to in-creased reliance on Windows NT systems by the military. Inside attacks and inside sniffer data to detect these attacks were added due the dangers posed by inside at-tacks. Stealthy attacks were added due to an emphasis on sophisticated attackers who can carefully craft attacks to look like normal traffic. In addition, two new types of analyses were performed. First, an analysis of misses and high-scoring false alarms was performed for each system to determine why systems miss specific attacks and what causes false alarms. Second, participants were optionally permitted to submit attack forensic information that could help a security analyst identify important characteristics of the attack and respond. This identification information included the attack category, the name for old attacks, ports/protocols used, and IP addresses used by the attacker.
Another major change in 1999 was a focus on determining the ability of systems to detect new attacks without first training on instances of these attacks. The 1998 evaluation demonstrated that systems could not detect new attacks well. The new 1999 evaluation was designed to evaluate enhanced systems which can detect new attacks and to analyze why systems miss new attacks. Many new attacks were thus developed and only examples of a few of these were provided in training data.
5 Test Bed Network and Background Traffic
the four victim machines, and nightly dumps of security-related files on all victim machines.
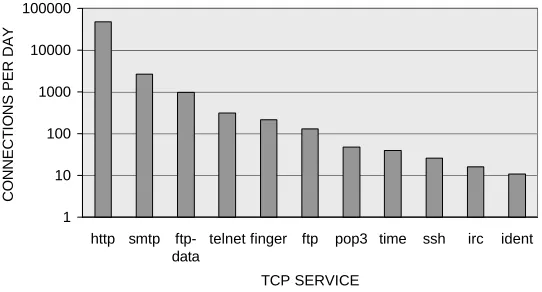
Custom software automata in the test bed simulate hundreds of programmers, sec-retaries, managers, and other types of users running common UNIX and Windows NT application programs. In addition, custom Linux kernel modifications provided by the AFRL allow a small number of actual hosts to appear as if they are thousands of hosts with different IP addresses. Figure 2 shows the average number of connec-tions per day for the most common TCP services. As can be seen, web traffic domi-nates but many other types of traffic are generated which use a variety of services. User automata send and receive mail, browse web sites, send and receive files using FTP, use telnet and ssh to log into remote computers and perform work, monitor the router remotely using SNMP, and perform other tasks. In addition to automatic traf-fic, the test bed allows human actors to generate background traffic and attacks when the traffic or attack is too complex to automate. Background traffic characteristics including the overall traffic level, the proportion of traffic from different services, and the variability of traffic with time of day are similar to characteristics measured on a small Air Force base in 1998. The average number of background-traffic bytes transmitted per day between the inside and outside of this test bed is roughly 411 Mbytes per day, with most of the traffic concentrated between 8:00 AM and 6:00 PM. The dominant protocols are TCP (384 Mbytes), UDP (26 Mbytes), and ICMP (98 Kbytes). These traffic rates are low compared to current rates at some large commercial and academic sites, but are representative of traffic measured at the beginning of this project. These rates also lead to sniffed data file sizes that can still be transported over the internet without practical difficulties. The flat test bed struc-ture without firewalls or other protective devices simplifies maintenance and attack generation. Future evaluations will include firewalls, more complex architectures,
1 10 100 1000 10000 100000
http smtp ftp-data
telnet finger ftp pop3 time ssh irc ident
TCP SERVICE
[image:8.612.169.440.147.293.2]CONNECTIONS PER DAY
attacks against firewalls, and more complex attacks including man-in-the-middle attacks that take advantage of a network hierarchy.
6 Attacks
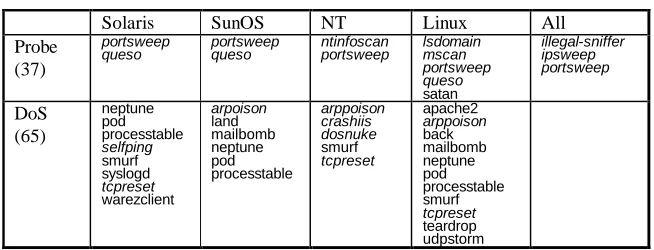
Twelve new Windows NT attacks were added in 1999 along with stealthy versions of many 1998 attacks, new inside console-based attacks, and six new UNIX attacks. The 56 different attack types shown in Tables 2 and 3 were used in the evaluation. Attacks in normal font in these tables are old attacks from 1998 executed in the clear (114 instances). Attacks in italics are new attacks developed for 1999 (62 instances), or stealthy versions of attacks used in 1998 (35 instances). Details on attacks includ-ing further references and information on implementations are available in [3,9,10,13]. Five major attack categories and the attack victims are shown in Tables 2 and 3. Pri-mary victims listed along the top of these tables are the four inside victim hosts, shown in the gray box of Figure 1, and the Cisco router. In addition, some probes query all machines in a given range of IP addresses as indicated by the column labeled “all” in Table 2.
The upper row of Table 2 lists probe or scan attacks. These attacks automatically scan a network of computers or a DNS server to find valid IP addresses (ipsweep, lsdomain, mscan), active ports (portsweep, mscan), host operating system types (queso, mscan), and known vulnerabilities (satan). All of these probes except two (mscan and satan) are either new in 1999 (e.g. ntinfoscan, queso, illegalsniffer) or are stealthy versions of 1999 probes (e.g. portsweep, ipsweep). Probes are considered stealthy if they issue ten or fewer connections or packets or if they wait longer than 59 seconds between successive network transmissions. Stealthy probes are similar to clear probes because they gather similar information concerning IP addresses, vulnerable ports, and operating system types. They differ because this information is gathered at a slower rate and because less, but more focused, information is gathered from each attack instance. For example, stealthy port sweeps are slow and focus only on ports with known vulnerabilities. The new “illegalsniffer” attack is different from the other probes. During this attack, a Linux sniffer machine is installed on the inside
Solaris SunOS NT Linux All
Probe (37)
portsweep
[image:9.612.145.472.169.294.2]queso portsweep queso ntinfoscan portsweep lsdomain mscan portsweep queso satan illegal-sniffer ipsweep portsweep DoS (65) neptune pod processtable selfping smurf syslogd tcpreset warezclient arpoison land mailbomb neptune pod processtable arppoison crashiis dosnuke smurf tcpreset apache2 arppoison back mailbomb neptune pod processtable smurf tcpreset teardrop udpstorm
network running the tcpdump program in a manner that creates many DNS queries from this new and illegal IP address.
The second row of Table 2 contains denial of service (DoS) attacks designed to dis-rupt a host or network service. New 1999 DoS attacks crash the Solaris operating system (selfping), actively terminate all TCP connections to a specific host (tcpreset), corrupt ARP cache entries for a victim not in others’ caches (arppoison), crash the Microsoft Windows NT web server (crashiis), and crash Windows NT (dosnuke).
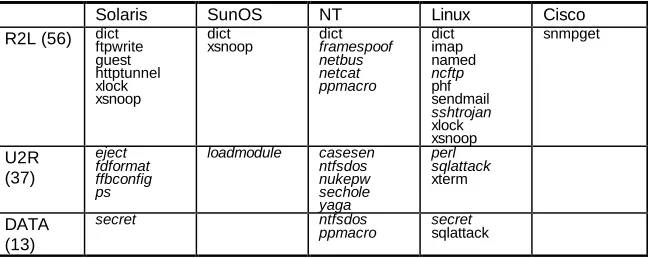
The first row of Table 3 contains Remote to Local (R2L) attacks. In these attacks, an attacker who does not have an account on a victim machine gains local access to the machine (e.g. guest, dict), exfiltrates files from the machine (e.g. ppmacro), or modifies data in transit to the machine (e.g. framespoof). New 1999 R2L attacks in-clude an NT PowerPoint macro attack (ppmacro), a man-in-the middle web browser attack (framespoof), an NT trojan-installed remote-administration tool (netbus), a Linux trojan SSH server (sshtrojan), and a version of a Linux FTP file access-utility with a bug that allows remote commands to run on a local machine (ncftp). The sec-ond row of Table 3 contains user to root (U2R) attacks where a local user on a ma-chine is able to obtain privileges normally reserved for the UNIX super user or the Windows NT administrator. All five NT U2R attacks are new this year and all other attacks except one (xterm) are versions of 1998 U2R attacks that were redesigned to be stealthy to network-based intrusion detection systems evaluated in 1998. Tech-niques used to make these U2R attacks stealthy are described in [3,10,13]. They include running the attack over multiple sessions, embedding the attack in normal user actions, writing custom buffer overflow machine code that does not spawn a root-level shell but simply “chmod’s” a file, bundling the complete attack into one shell script, setting up delayed “time bomb” attacks, and transferring the attack and the attack output using common network services. The bottom row in Table 3 con-tains Data attacks. This is a new attack type added in 1999. The goal of a Data attack is to exfiltrate special files which the security policy specifies should remain on the victim hosts. These include “secret” attacks where a user who is allowed to access the special files exfiltrates them via common applications such as mail or FTP, and other attacks where privilege to access the special files is obtained using a U2R
at-Solaris SunOS NT Linux Cisco
R2L (56) dict ftpwrite
guest httptunnel xlock xsnoop
dict
xsnoop dict framespoof netbus netcat ppmacro
dict imap named ncftp phf sendmail sshtrojan xlock xsnoop
snmpget
U2R (37)
eject fdformat ffbconfig ps
loadmodule casesen ntfsdos nukepw sechole yaga
perl sqlattack xterm
DATA (13)
secret ntfsdos
[image:10.612.146.470.227.356.2]ppmacro secret sqlattack
tack (ntfsdos, sqlattack). Note that an attack could be labeled as both a U2R and a Data attack if one of the U2R attacks was used to obtain access to the special files. The “Data” category thus specifies the goal of an attack rather than the attack mechanism.
Attack implementation was simplified for U2R attacks in 1999 by integrating at-tack automation software with the automaton used to generate telnet sessions. This made it easier to embed attacks within normal telnet sessions. In addition, attack verification was simplified by running all attacks from a separate dedicated machine and sniffing traffic to and from that machine. This made it easier to collect network traffic generated by each attack. Custom software was required to change routing tables in the test bed gateways whenever the IP address of the dedicated attacker machine changed. This made it possible to isolate network traffic generated by at-tacks for all but inside atat-tacks which were launched from the console of a victim and for attacks which installed trojans or other types of malicious software on inside machines Any network traffic for these two types of attacks had to be extracted from inside sniffer data by hand.
7 Participants and Scoring
Eight research groups participated in the evaluation using a variety of approaches to intrusion detection. Papers by these groups describing high-performing systems are provided in [7,8,15,20,21,24,25,26]. One requirement for participation in the evalua-tion was the submission of a detailed system descripevalua-tion that was used for scoring and analysis. System descriptions described the types of attacks the system was de-signed to detect, data sources used, features extracted, and whether optional attack identification information was provided as an output. Most systems used network sniffer data to detect Probe and DoS attacks against all systems [8,15,21,25] or BSM Solaris host audit data to detect Solaris R2L and U2R attacks [7,15,25]. Two systems produced a combined output from both network sniffer data and host audit data [15,25]. A few systems used network sniffer data to detect R2L and U2R attacks against the UNIX victims [15,25]. One system used NT audit data to detect U2R and R2L attacks against the Windows NT victim [20] and two systems used BSM audit data to detect Data attacks against the Solaris victim [15,25]. A final system used information from a nightly file system scan to detect R2L, U2R, and Data attacks against the Solaris victim [24]. The software program that performs this scan was the only custom auditing tool used in the evaluation. A variety of approaches were employed including expert systems that use rules or signatures to detect attacks, anomaly detectors, pattern classifiers, recurrent neural networks, data mining tech-niques, and a reasoning system that performs a forensic analysis of the Solaris file system.
Locations of attacks in the training data were clearly labeled. Two weeks of unla-beled test data were provided from late September to the middle of October. Partici-pants downloaded this data from a web site, processed it through their intrusion detection systems, and generated putative hits or alerts at the output of their intrusion detection systems. Lists of alerts were due back by early October. In addition, par-ticipants could optionally return more extensive identification lists for each attack.
A simplified approach was used in 1999 to label attacks and score alerts and new scoring procedures were added to analyze the optional identification lists. In 1998, every network TCP/IP connection, UDP packet, and ICMP packet was labeled, and participants determined which connections and packets corresponded to attacks. Although this approach pre-specifies all potential attack packets and thus simplifies scoring and analysis, it can make submitting alerts difficult because aligning alerts with the network connections and packets that generate alerts is often complex. In addition, this approach cannot be used with inside attacks that generate no network traffic. In 1999, a new simplified approach was adopted. Each alert only had to indicate the date, time, victim IP address, and score for each putative attack detec-tion. An alert could also optionally indicate the attack category. This was used to assign false alarms to attack categories. Putative detections returned by participants were counted as true “hits” or true detections if the time of any alert occurred during the time of any attack segment and the alert was for the correct victim IP address. Alerts that occur outside all attack segments were counted as “misses” or false alarms. Attack segments correspond to the duration of all network packets and con-nections generated by an attack and to time intervals when attack processes are run-ning on a victim host. To account for small timing inconsistencies across hosts, an extra 60 seconds leeway was typically allowed for alerts before and after the end of each attack segment. The analysis of each system only included attacks which that system was designed to detect, as specified in the system description. Systems weren’t penalized for missing attacks they were not designed to detect and false alarms that occurred during segments of out-of-spec attacks were ignored.
The score produced by a system was required to be a number that increases as the certainty of an attack at the specified time increases. All participants returned num-bers ranging between zero and one, and many participants produced binary outputs (0’s and 1’s only). If alerts occurred in multiple attack segments of one attack, then the score assigned to that attack for further analysis was the highest score in all the alerts. Some participants returned optional identification information for attacks. This included the attack category, the name for old attacks selected from a list of provided names, and the attack source and destination IP addresses, start time, dura-tion, and the ports/services used. This information was analyzed separately from the alert lists used for detection scoring. Results in this paper focus on detection results derived from the required alert lists.
destination ports and IP addresses, the protocol, and details concerning the attack. Details include indications that the attack is clear or stealthy, old or new, inside or outside, the victim machine type, and whether traces of the attack occur in each of the different data types that were collected.
8 Results
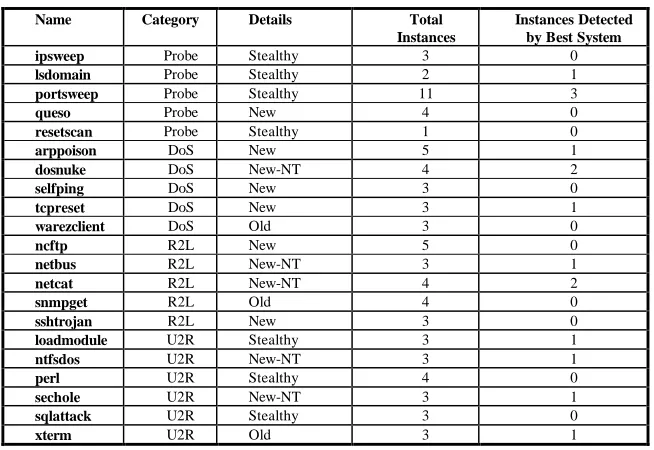
An initial analysis was performed to determine how well all systems taken together detect attacks regardless of false alarm rates. The best system was first selected for each attack as the system which detects the most instances of that attack. The detection rate for these best systems provides a rough upper bound on composite system performance. Thirty seven of the 58 attack types were detected well by this composite system, but many stealthy and new attacks were always or frequently missed. Poorly detected attacks for which half or more of the attack instances were not detected by the best system are listed in Table 4. This table lists the attack name, the attack category, details concerning whether the attack is old, new, or stealthy, the total number of instances for this attack, and the number of instances detected by the system which detected this attack best. Table 4 contains 21 attack types and is dominated by new attacks and attacks designed to be stealthy to 1998 network-based intrusion detection systems. All instances of 10 of the attack types in Table 4 were
Name Category Details Total
Instances
Instances Detected by Best System
ipsweep Probe Stealthy 3 0
lsdomain Probe Stealthy 2 1
portsweep Probe Stealthy 11 3
queso Probe New 4 0
resetscan Probe Stealthy 1 0
arppoison DoS New 5 1
dosnuke DoS New-NT 4 2
selfping DoS New 3 0
tcpreset DoS New 3 1
warezclient DoS Old 3 0
ncftp R2L New 5 0
netbus R2L New-NT 3 1
netcat R2L New-NT 4 2
snmpget R2L Old 4 0
sshtrojan R2L New 3 0
loadmodule U2R Stealthy 3 1
ntfsdos U2R New-NT 3 1
perl U2R Stealthy 4 0
sechole U2R New-NT 3 1
sqlattack U2R Stealthy 3 0
[image:13.612.144.471.194.419.2]xterm U2R Old 3 1
totally missed by all systems. These results suggest that the new systems developed for the 1999 evaluation still are not detecting new attacks well and that stealthy probes and U2R attacks can avoid detection by network-based systems.
[image:14.612.143.466.349.526.2]Further analyses evaluated system performance at false alarm rates in a specified range. The detection rate of each system at different false alarm rates can be deter-mined by lowering a threshold from 1.0 to 0.0, counting the detections with scores above the threshold as hits, and counting the number of alerts above the threshold that do not detect attacks as false alarms. This results in one or more operating points for each system which trade off false alarm rate against detection rate. It was found that almost all systems, except some anomaly detection systems, achieved their maximum detection accuracy at or below 10 false alarms per day on the 1999 corpus. These low false alarm rates were presumably due to the low overall traffic volume, the relative stationarity of the traffic, and the ability to tune systems to reduce false alarms on three weeks of training data. In the remaining presentation, the detection rate reported for each system is the highest detection rate achieved at or below 10 false alarms per day on the two weeks of test data.
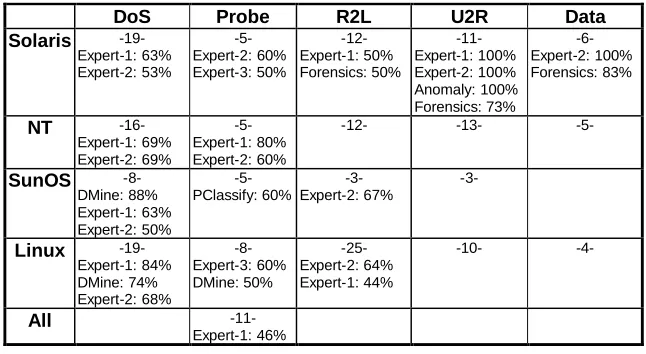
Table 5 shows average detection rates at 10 false alarms per day for each attack
category and victim type. This table provides overall results and does not separately analyze old, new, and stealthy attacks. The upper number in a cell, surrounded by dashes, is the number of attack instances in that cell and the other entries provide the percent correct detections for all systems with detection rates above 40% in that cell. A cell contains only the number of instances if no system detected more than 40% of the instances. Only one entry is filled for the bottom row because only probe attacks were against all the victim machines and the SunOS/Data cell is empty because there were no Data attacks against the SunOS victim. High-performance systems listed in Table 5. Percent attack instances detected for systems with a detection rate above 40% in each cell and at false alarm rates below 10 false alarms per day.
DoS Probe R2L U2R Data
Solaris -19- Expert-1: 63% Expert-2: 53% -5- Expert-2: 60% Expert-3: 50% -12- Expert-1: 50% Forensics: 50% -11- Expert-1: 100% Expert-2: 100% Anomaly: 100% Forensics: 73% -6- Expert-2: 100% Forensics: 83%
NT -16-
Expert-1: 69% Expert-2: 69%
-5- Expert-1: 80% Expert-2: 60%
-12- -13- -5-
SunOS -8-
DMine: 88% Expert-1: 63% Expert-2: 50% -5- PClassify: 60% -3- Expert-2: 67% -3-
Linux -19- Expert-1: 84% DMine: 74% Expert-2: 68% -8- Expert-3: 60% DMine: 50% -25- Expert-2: 64% Expert-1: 44%
-10- -4-
All -11-
Table 5 include rule-based expert systems that use network sniffing data and/or So-laris BSM audit data (Expert-1 through Expert-3 [15,25,21]), a data mining system that uses network sniffing data (Dmine [8]), a pattern classification approach that uses network sniffing data (Pclassify), an anomaly detection system which uses re-current neural networks to analyze system call sequences in Solaris BSM audit data (Anomaly [7]), and a reasoning system which performs a nightly forensic analysis of the Solaris file system (Forensics [24]).
No one approach or system provides best performance across all categories. Best performance is provided for probe and denial of service attacks for systems that use network sniffer data and for U2R and Data attacks against the Solaris victim for systems that use BSM audit data. Detection rates for U2R and Data attacks are gen-erally poor for SunOS and Linux victims where extensive audit data is not available. Detection rates for R2L, U2R, and Data attacks are poor for Windows NT which was included in the evaluation for the first time this year.
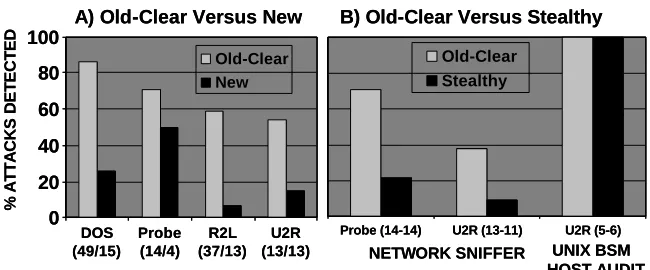
[image:15.612.148.473.314.449.2]Figure 3 shows the performance of the best intrusion detection system in each at-tack category at a false alarm rate of 10 false alarms per day. The left chart compares the percentage of attack instances detected for old-clear and new attacks and the right chart compares performance for old-clear and stealthy attacks. The numbers in parentheses on the horizontal axis below the attack category indicate the number of instances of attacks of different types. For example, in Figure 3A, there were 49 old-clear and 15 new denial-of-service attacks. Figure 3A demonstrates that detection of new attacks was much worse than detection of old-clear attacks across all attack categories, and especially for DoS, R2L, and U2R attacks. The average detection rate for old-clear attacks was 72% and this dropped to 19% for new attacks. Figure 3B demonstrates that stealthy probes and U2R attacks were much more difficult to detect for network-based intrusion detection systems that used sniffing data. Those attacks against the Solaris victim, however, were accurately detected by host-based intrusion detection systems that used BSM audit data.
Figure 3. Comparison of detection accuracy at 10 false alarms per day for (A) Old-Clear versus New attacks and (B) Old-Clear versus stealthy attacks.
0 20 40 60 80 100 DOS (49/15) Probe (14/4) R2L (37/13) U2R (13/13) Old-Clear New
Probe (14-14) U2R (13-11) U2R (5-6) Old-Clear
Stealthy
NETWORK SNIFFER UNIX BSM HOST AUDIT
% ATTACKS DETECTED
A) Old-Clear Versus New B) Old-Clear Versus Stealthy
0 20 40 60 80 100 DOS (49/15) Probe (14/4) R2L (37/13) U2R (13/13) Old-Clear New
Probe (14-14) U2R (13-11) U2R (5-6) Old-Clear
Stealthy
NETWORK SNIFFER UNIX BSM HOST AUDIT
% ATTACKS DETECTED
Attacks were detected best when they produced a consistent “signature” or se-quence of events in tcpdump data or in audit data that was different from sese-quences produced for normal traffic. A detailed analysis by participants demonstrated that attacks were missed for a variety of reasons. Systems which relied on rules or signa-tures missed new attacks because signasigna-tures did not exist for these attacks, and be-cause existing signatures did not generalize to variants of old attacks, or to new and stealthy attacks. For example “ncftp” and “lsdomain” attacks were visible in tcpdump data, but were missed because no rules existed to detect these attacks. Stealthy probes were missed because hard thresholds in rules were set to issue an alert only for more rapid probes, even though slow probes often provided as much information to attackers. Stealthy U2R attacks were missed by network-based sys-tems because rules generated for clear versions of these attacks did not generalize to stealthy versions and because attacker actions were not easily visible in sniffing data. Many of the Windows NT attacks were missed due to lack of experience with Win-dows NT audit data and attacks. A detailed analysis of the WinWin-dows NT attacks [10] indicated that all but two of these attacks (ppmacro, framespoof) can be detected from the 1999 NT audit data using attack-specific signatures which generate far fewer than 10 false alarms per day.
Systems also missed attacks because particular protocols or services were not monitored. For example, some systems missed the “arppoison” attack because the ARP protocol was not monitored. Some missed the “snmpget” attack because the SNMP service was not analyzed and some missed the “lsdomain” attack because the DNS service was not analyzed. Finally, some systems missed attacks because a pro-tocol or TCP service was not analyzed to the required depth. For example, the “lsdo-main” attack requires a system to monitor traffic to the DNS server and also detect when an “ls” command is successfully run on that server. The “selfping” command also will not be detected by a network-based intrusion detection system unless telnet sessions are extracted and analyzed to detect when a “ping” command is issued with specific arguments.
Some inside attacks launched from the console of victims and did not generate network traffic. They were detected well only on the Solaris victim by systems that use BSM audit data. Other inside machine-to-machine attacks were detected as well using inside sniffer data as attacks initiated from outside machines. One anomaly detection system [7] provided good results. It analyzed system-call sequences ex-tracted from BSM audit data and provided a high detection rate similar to that of the best signature-based systems for Solaris U2R attacks, as shown in the upper right of Table 5.
maximum of roughly 170 in-spec attacks using both host-based and network-based input data. The third system used network sniffing data alone and thus had fewer in-spec attacks (102) and the fourth system used only Solaris file-system information and thus had only 27 in-spec attacks. The remaining columns show the accuracy of the identification information provided for detected attacks. The third column shows the percentage of detected attacks where the attack category label was correct. The fourth column shows the percentage of detected attacks where the names of old at-tacks were correct. Participants were provided a list of names for old atat-tacks before the evaluation was run which were used to label attacks. Items in this column apply only to old attacks that were detected. The next column shows the percentage of detected attacks where 90% or more of the victim ports were identified and the final column shows the percentage of detected attacks where all the source IP addresses were correctly identified.
Table 6. Identification results for all attacks by four high-performance sys-tems which provided all optional identification information.
This table shows that the additional identification information provided was gen-erally accurate for attacks that were correctly detected. For example, for the first expert system, the attack category and name is correct roughly 90% of the time, and the victim ports and source IP addresses are correctly identified for more than 70% of the detected attacks. The upper three systems in Table 6 all used network sniffing data and provided good identification performance. The last Forensic analysis sys-tem, was a host-based system. Its good performance suggests that much of the identi-fication information required can be obtained from a host-based analysis that doesn’t rely on audit data.
All systems in Table 6 also provided attack start times as optional identification information. These times were computed by participating systems using off-line data with no constraints on look-ahead and thus they do not necessarily represent times that could be provided by real-time system implementations. Start time accuracy was generally good for R2L and DoS attacks. The attack start time latencies were less than 15 seconds for more than 80% of these attacks. Start time accuracy was not as good, and differed across systems for probe and U2R attacks. Start times were pro-vided for probe attacks by the first three systems in Table 6. The third system (DMine) correctly identified the start of all probes to within 15 seconds while the first two expert systems had start time latencies that were often many minutes de-layed for slower probes that spanned long time intervals.
Attacks Detected/ In-Spec
Attack Categories Correct
Attack Names Correct (Old Attacks)
Victim Ports Correct
Source IP Addresses Correct
Expert-1 85/169 91% 88% 73% 80%
Expert-2 81/173 74% 53% 51% 69%
DMine 41/102 100% 88% 61% 90%
The first two expert systems and the last system in Table 6 provided start times for U2R attacks. These attacks were unique because many of them included multiple separate telnet interactions separated by long time intervals and others were per-formed as part of long single telnet sessions containing many normal user com-mands. In attacks that included multiple telnet sessions, initial sessions were run at user privilege level to prepare for the attack. The actual attack, which provided root-level privilege on UNIX machines, was run only in following sessions. Results for the first two expert systems in Table 6 and for last Forensic analysis system differ dramatically for these U2R attacks. The first two systems detected the time instant where the attacker became root, while the Forensic analysis system traced the begin-ning of the attack either to the beginbegin-ning of the first session where attack setup ac-tions occurred or to the beginning of the telnet session where the attack occurred. Start times for 6 of the 8 U2R attacks detected by the Forensic analysis system were within 15 seconds of true start times, while start times for more than 90% of the U2R attacks detected by the first two Expert systems were delayed by more than a minute from the true attack times. These results suggest that the Forensic analysis system is accurately correlating information across multiple network sessions to arrive at accu-rate start times while the two expert systems are using the time of the root-privilege elevation as a start time.
9 Disc
u
ssion
The DARPA 1999 intrusion detection evaluation successfully evaluated 18 intrusion detection systems from 8 sites using more than 200 instances of 58 attack types em-bedded in three weeks of training data and two weeks of test data. Attacks were pri-marily launched against UNIX and Windows NT hosts. Best detection was provided by network-based systems for old probe and old denial of service attacks and by host-based systems for Solaris user-to-root attacks launched either remotely or from the local console. A number of sites developed systems that detect known old attacks by searching for signatures in network sniffer data or Solaris BSM audit data using expert systems or rules. These systems detect old attacks well when they match known signatures, but miss many new UNIX attacks, Windows NT attacks, and stealthy attacks. Promising capabilities were provided by Solaris host-based systems which detected console-based and remote-stealthy U2R attacks, by anomaly detection systems which could detect some U2R and DoS attacks without requiring signatures, and by a host-based system that could detect Solaris U2R and R2L attacks without using audit information but by performing a forensic analysis of the Solaris file sys-tem.
stationary and low-volume background traffic, lenient scoring, and extensive instru-mentation to provide inputs to intrusion detection systems. One finding that should not be misinterpreted is that most systems had false alarm rates which were low and well below 10 false alarms per day. As noted above, these low rates may be caused by the use of relatively low volume background traffic with a time varying, but rela-tively fixed proportion of different traffic types. We currently plan to verify false alarm rates using live network traffic and a small number of high-performing sys-tems. Live-traffic measurements will also be made to update traffic statistics and traffic generators used in the test bed. Results obtained with the DARPA research systems used in the evaluation also may not generalize to more recent research sys-tems or to commercial syssys-tems. Performance with the 56 attack types used in the evaluation also may not be representative of performance with more recent attacks or with other attacks against different host machines, firewalls, routers, or parts of the network infrastructure. Further evaluations are required to explore performance with commercial and other research intrusion detection systems, with more complex net-work topologies, with a wider range of attacks, and with varying mixtures and amounts of background traffic.
Comprehensive evaluations of DARPA research systems have now been per-formed in 1998 and 1999. These evaluations take time and effort on the part of the evaluators and the participants. The have provided benchmark measurements that do not now need to be repeated again until system developers are able to implement many desired improvements. The current planned short-term focus in 2000 is to provide assistance to intrusion detection system developers to advance their systems and not to evaluate performance. System development can be expedited by providing descriptions and labeled examples of many new attacks, by developing threat and attack models, and by carefully evaluating COTS systems to determine where to focus research efforts.
fea-tures should be explored. These could be provided by new system auditing software, by firewall or router audit logs, by SNMP queries, by software wrappers, and by application-specific auditing.
Acknowledgements
This work was sponsored by the Department of Defense Advanced Research Projects Agency under Air Force Contract F19628-95-C-0002. Opinions, interpreta-tions, conclusions, and recommendations are those of the author and are not necessarily endorsed by the United States Air Force.
We would like to thank Sami Saydjari for supporting this effort. Many involved participants made this evaluation possible including Dick Kemmerer, Giovanni Vigna, Mabri Tyson, Phil Porras, Anup Ghosh, R. C. Sekar, and NingNing Wu. We would also like to thank Terry Champion and Steve Durst from AFRL for many lively discus-sions and for providing Linux kernel modifications that make one host simulate many IP addresses. Finally, we would like to thank others who contributed including Marc Zissman, Rob Cunningham, Seth Webster, Kris Kendall, Raj Basu, Jesse Rabek, and Simson Garfinkel.
References
1. J. Allen, A. Christie, W. Fithen, J. McHugh, J. Pickel, E. Stoner, State of the Practice of Intrusion Detection Technologies, Carnegie Mellon University/Software Engineering Insti-tute Technical Report CMU/SEI-99-TR-028, January 2000.
2. E. G. Amoroso, Intrusion Detection: An Introduction to Internet Surveillance, Correlation, Trace Back, Traps, and Response, Intrusion.Net Books, 1999.
3. K. Das, The Development of Stealthy Attacks to Evaluate Intrusion Detection Systems, S.M. Thesis, MIT Department of Electrical Engineering and Computer Science, June 2000. 4. H. Debar, M. Dacier, A. Wespi, and S. Lampart, An Experimental Workbench for
Intru-sion Detection Systems, Research Report RZ 2998 (#93044), IBM Research DiviIntru-sion, Zu-rich Research Laboratory, 8803 Ruschlikon, Switzerland, March 9, 1999,
http://www.zurich.ibm.com/Technology/Security/extern/gsal/docs/index.html.
5. Robert Durst, Terrence Champion, Brian Witten, Eric Miller and Luigi Spagnuolo, Test-ing and evaluatTest-ing computer intrusion detection systems, Communications of the ACM, 42 (1999) 53-61.
6. C. Elkan, Results of the KDD'99 Classifier Learning Contest, Sponsored by the Interna-tional Conference on Knowledge Discovery in Databases, September, 1999, http://www-cse.ucsd.edu/users/elkan/clresults.html.
8. S. Jajodia, D. Barbara, B. Speegle, and N. Wu, Audit Data Analysis and Mining (ADAM), project described in http://www.isse.gmu.edu/~dbarbara/adam.html, April, 2000.
9. K. Kendall, A Database of Computer Attacks for the Evaluation of Intrusion Detection Systems, S.M. Thesis, MIT Department of Electrical Engineering and Computer Science, June 1999.
10. J. Korba, Windows NT Attacks for the Evaluation of Intrusion Detection Systems, S.M. Thesis, MIT Department of Electrical Engineering and Computer Science, June 2000. 11. Lawrence Berkeley National Laboratory Network Research Group provides tcpdump at
http://www-nrg.ee.lbl.gov.
12. Richard P. Lippmann, David J. Fried, Isaac Graf, Joshua W. Haines, Kristopher R. Kend-all, David McClung, Dan Weber, Seth E. Webster, Dan Wyschogrod, Robert K. Cunning-ham, and Marc A. Zissman, Evaluating Intrusion Detection Systems: the 1998 DARPA Off-Line Intrusion Detection Evaluation, in Proceedings of the 2000 DARPA Information Survivability Conference and Exposition (DISCEX), Vol. 2, IEEE Press, January 2000. 13. R. P. Lippmann and R. K. Cunningham, Guide to Creating Stealthy Attacks for the 1999
DARPA Off-Line Intrusion Detection Evaluation, MIT Lincoln Laboratory Project Report IDDE-1, June 1999.
14. MIT Lincoln Laboratory, A public web site http://www.ll.mit.edu/IST/ideval/index.html, contains limited information on the 1998 and 1999 evaluations. Follow instructions on this web site or send email to the authors (rpl or [email protected]) to obtain access to a password protected site with more complete information on these evaluations and results. Software scripts to execute attacks are not provided on these or other web sites. 15. P. Neumann and P. Porras, Experience with EMERALD to DATE, in Proceedings 1st
USENIX Workshop on Intrusion Detection and Network Monitoring, Santa Clara, Califor-nia, April 1999, 73-80, http://www.sdl.sri.com/emerald/index.html.
16. Steven Northcutt, Network Intrusion Detection; An Analysis Handbook, New Riders Publishing, Indianapolis, 1999.
17. T. H. Ptacek and T. N. Newsham, Insertion, Evasion, and Denial of Service: Eluding Network Intrusion Detection, Secure Networks, Inc. Report, January 1998.
18. N. Puketza, K. Zhang, M. Chung, B. Mukherjee, and R. A. Olsson, A methodology for testing intrusion detection systems,' IEEE Transactions on Software Engineering, 22, 1996, 719-729.
19. N. Puketza, M. Chung, R. A. Olsson, and B. Mukherjee, A Software Platform for Testing Intrusion Detection Systems, IEEE Software, September/October, 1997, 43-51.
20. A. Schwartzbard and A.K. Ghosh, A Study in the Feasibility of Performing Host-based Anomaly Detection on Windows NT, in Proceedings of the 2nd Recent Advances in Intru-sion Detection (RAID 1999) Workshop, West Lafayette, IN, September 7-9, 1999. 21. R. Sekar and P. Uppuluri, Synthesizing Fast Intrusion Prevention/Detection Systems from
High-Level Specifications, in Proceedings 8th Usenix Security Symposium, Washington DC, Aug. 1999, http://rcs-sgi.cs.iastate.edu/sekar/abs/usenixsec99.htm.
23. D. Song, G. Shaffer, and M. Undy, Nidsbench – A Network Intrusion Detection System Test Suite, Second International Workshop on Recent Advances in Intrusion Detection (RAID), September 1999, http://www.anzen.com/research/nidsbench/nidsbench-slides/nidsbench-slides.html.
24. M. Tyson, P. Berry, N. Williams, D. Moran, D. Blei, DERBI: Diagnosis, Explanation and Recovery from computer Break-Ins, project described in
http://www.ai.sri.com/~derbi/, April. 2000.
25. G. Vigna, S.T. Eckmann, and R.A. Kemmerer, The STAT Tool Suite, in Proceedings of the 2000 DARPA Information Survivability Conference and Exposition (DISCEX), IEEE Press, January 2000.