Critical field behavior and antiband instability under controlled surface electromigration on Si(111)
C. O Coileain, V. Usov,*and I. V. Shvets
Centre for Research on Adaptive Nanostructures and Nanodevices, School of Physics, Trinity College, Dublin 2, Ireland
S. Stoyanov
Department of Phase Transitions and Crystal Growth, Institute of Physical Chemistry, Bulgarian Academy of Sciences, BG-1113 Sofia, Bulgaria
(Received 12 April 2011; revised manuscript received 17 June 2011; published 9 August 2011) In this study we investigate step bunching and antiband surface instabilities on Si(111). We experimentally study the effects of a controlled electromigration field on the onset of antibands. We analyze the initial stage of antiband formation on step bunched surfaces under conditions of constant temperature of 1270◦C, while systematically varying the applied electromigration field. The relationship between the electromigration field and minimum terrace width required to initiate the antiband formation has been established. Also, we systematically measured values of the critical electromigration field, which is required to initiate the step-bunching process on Si(111) at 1130◦C (regime II) and 1270◦C (regime III). The dependence of the critical field on the mean atomic terrace width has been investigated and discussed.
DOI:10.1103/PhysRevB.84.075318 PACS number(s): 68.35.bg, 68.35.Fx, 68.37.Ps, 68.47.Fg
I. INTRODUCTION
The dynamics and evolution of crystalline surfaces have long been the subject of scientific attention,1 and this has
been further stimulated by their recent potential technological applications.2,3 The biased diffusion of Si atoms on vicinal Si(111) induced by an applied electric field at temperatures above 860◦C was particularly at the focus due to its complex temperature and electric current orientation dependences.4–6
The electric field applied along the miscut in one particular direction results in closely spaced step bands, each constituting only several atomic heights, while the electric field in the opposite direction causes the atomic steps to develop into several-micrometers-wide flat terraced regions separated by step bunches with a high density of atomic steps and heights of up to hundreds of nanometers. Additionally, this behavior is complicated by the requirement of converse directions of electromigration necessary to induce the step bunching for four specific temperature regimes.7In the temperature regimes
I (∼850–950◦C) and III (∼1200–1300◦C) the step-bunching process is driven by the step-down adatom electromigration. A reversal of the adatom drift is required for regimes II (∼1040–1190◦C) and IV (>1300◦C), such that bunching takes place only if the adatoms drift is in the step-up direction.4,8
The fundamental mechanism responsible for step bunching is expected to be different for these regimes, with the regimes II and III being the subject of investigation in this paper.
Prolonged annealing, with the dc current driven along the miscut direction, allows the surface morphology to further develop, giving rise to new patterns.9 Specifically, the
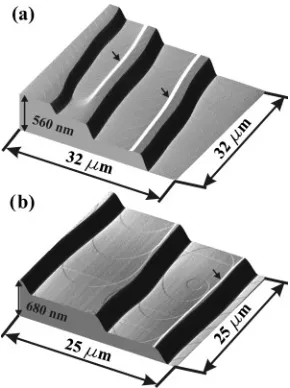
elec-tromigration of adatoms causes steps crossing the terraces to twist until they acquire a reversed alignment and form bands with opposite inclination, as compared to the primary step bunches, close to the terrace edges (antibands) [Fig.1(a)]. The gradual evolution of the atomic steps crossing the terraces and the creation of sublimation spirals were identified as being responsible for the formation of these antibands in previous experimental studies.9 Figure1(b)demonstrates neighboring terraces containing these features, with the former being the
subject of investigation in this paper. In addition, there have been theoretical studies on the step-bending effects produced by electric currents driven parallel to the atomic steps.10
Dynamics of atomic steps under the influence of an external electromigration force can be accurately modeled using the generalized Burton-Cabrera-Frank (BCF) theory, which describes step bunching driven by the step-down adatom electromigration observed in temperature regimes I and III.5,11 The theory assumes that drifting Si adatoms are unable to cross atomic steps but instead attach to them due to the exchange between the crystal phase and the surface layer of adatoms. An adatom concentration gradient is created across the terrace as a result of adatom electromigration in the down-step direction and the limited rate of adatom attachment at the step edges. In the case of step kinetics limiting sublimation, adatoms arriving at the lower edge cannot be instantly accepted by atomic steps; thus the local adatom concentration is comparatively elevated. The concentration gradient causes the atomic crossing steps to recede along terraces in an uneven manner, i.e., the step velocity near the upper step edge of the terrace is greater than that at the lower edge. This leads to the characteristic long-S-shape deformation of the crossing steps as the terraces widen.
FIG. 1. Surface morphologies created on Si(111) by extended annealing at 1270◦C. (a) AFM image of Si(111) annealed with electric field E = 3.6 V/cm, showing 10- (middle terrace) and 14-nm-high antibands located close to terrace edges. Antibands are indicated by arrows. (b) AFM image of Si(111) obtained by annealing withE= 2.0 V/cm showing two neighboring terraces, where the antibands developed by sublimation spirals (lower terrace) and bending of crossing steps (upper terrace).
terrace widthLand applied electromigration fieldEsatisfy the necessary condition
qeffEL2
˜
βa2 >2, (1)
where qeff is an effective charge of Si adatoms on Si(111),
˜
β is the atomic step stiffness, anda is the atomic spacing.12 This clearly proposes that a minimum terrace width is required for the onset of antibands at any given applied electric field. Reduction of the electromigration field results in a widening of the terrace width required to achieve the same stage of crossing-step evolution. Therefore modifying the electric field will have a direct effect on the adatom concentration gradient, thus allowing manipulation of the antiband formation.
When the applied electric field is reduced below critical (Ecr), the electromigration force is no longer sufficient to
initiate the coarsening step-bunching process characterized by the gradual growth of step-bunch heights and terrace width with the annealing time. DeterminingEcris essential because
it is related to the fundamental thermodynamic quantityg(T), which is associated with the contribution of step-step repulsion to the surface free energyf(ρ) of vicinal crystal surfaces given by13–16
f(ρ)=f(0)+kρ+gρ3, (2)
where ρ is the density of steps. It should also be intuitive that a repulsive interstep interaction would necessitate a stronger critical field to induce the step-bunching process on surfaces with a reduced initial interstep distancel, which can be determined by the surface’s overall miscut angle α from a low-index surface. Existing theoretical models provide different relationships betweenEcr andl, depending on the
sublimation conditions on the surface.17 Investigating the
Ecr(l) dependency and comparing it to theoretical predictions
would provide valuable information about the sublimation mechanism responsible for the development of step-bunching instability on Si(111).
Studies of vicinal Si(111) are often primarily concerned with the earlier stages of the step-bunching instability,6
which is induced by the maximum attainable electric field applied along the miscut direction. Consequently, despite extensive experimental and theoretical work, few advances have been made in understanding the phenomena that arise on surfaces subjected to extended annealing. Experimental data available onEcr to date are also very limited,18,19 and their
dependence on the initial interstep distance and sublimation temperature remains unknown. Here we study experimentally the development of the antiband instability under the influence of the reduced electromigration field. We were able to study morphologies of step-bunched surfaces at the onset stage of antiband formation, created by annealing with moderatedE. We were able to test the relationship between the terrace width, the electromigration field, and the onset of antiband formation predicted by theoretical studies. Also, we systematically measure values ofEcrfor Si(111) with different initial interstep
distanceslat 1130◦C (regime II) and 1270 ◦C (regime III) and compare measuredEcr(l) dependences to the predictions
of theoretical models.
II. EXPERIMENTAL PROCEDURE
We examined the onset of step bunching and antiband instabilities in Si(111) using a vacuum setup with a base pressure of 2×10⁻¹⁰ Torr, which combines independently
controlled dc current and irradiative heating.18The setup uses a
heating shroud, supplied by an empty effusion cell, into which a dc-current annealing sample stage is inserted. The sample temperature is extracted from the sample’s resistance, using silicon’s large negative temperature coefficient for electrical resistivity. The capacity to decouple the dc-current heating from the sample temperature enabled us to control the strength of the electric field while maintaining the sample at a desired temperature. The strongest electric field was obtained when the dc current was the only source of heating during annealing while the minimum applicable field was determined byEcr.
Rectangular 20×1.3 mm2samples were diced fromn-type
1270◦C (regime III) was chosen as the antiband instability develops relatively rapidly at this temperature compared to other temperature regimes, at the high rate of step bunching of approximately 1 step/s.20Longer annealing times were used
for samples annealed with weaker electric fields.
When studying theEcr(l) dependence, samples of different
misorientation angles were annealed at 1130 ◦C (regime II) for 12 h with current in the step-up direction and 1270 ◦C (regime III) for 6 min with current in the step-down direction. The extent of carbon and oxygen contamination on the Si surface was determined in a separate experiment by Auger electron spectroscopy analysis, which showed that after flash annealing to 1250 ◦C the surface was free from carbon and oxygen contamination and remained clean after annealing for 12 h at 1130◦C.18After the annealing sequence the samples
were maintained at 650◦C for an hour using only irradiative heating. Finally, the samples were removed from vacuum, and the surfaces were analyzed ex situ using atomic force microscopy (AFM).
III. RESULTS AND DISCUSSION
Figure2 shows surface morphologies formed on Si(111) with a misorientation of 1.1◦ toward the [11-2] direction as a result of extended annealing at 1270 ◦C with different applied electric fields. Normally, two samples were annealed with the same electric field. Annealing Si(111) for 15 min by dc current only (E = 3.6 V/cm) created morphology
FIG. 2. Surface morphologies created on Si(111) by extended annealing at 1270 ◦C with different electric fields applied in the step-down direction. The step bunches are aligned along the [1-10] direction, while the down-step [11-2] direction is toward the right in all images. For weakened electromigration fields, wider terrace widths were required to initiate development of the step-bunching instability. Circled are the terrace areas containing crossing steps in a steady-state symmetric S shape. (a) A derivative image of a surface annealed for 15 min with E= 3.6 V/cm and currentI =3.8 A. The crossing steps on the narrower sections of the terraces are less developed toward the antiband. (b) A derivative image of a sample annealed for 30 min withE=2.8 V/cm (I=2.9 A). (c) A derivative image of Si(111) annealed for 60 min withE=1.7 V/cm (I=1.8 A). (d) A derivative image of a sample annealed for 60 min withE= 1.4 V/cm (I=1.5 A).
characterized by bunches of closely spaced steps separated by 3.5–5.5-μm-wide terraces [Fig.2(a)]. Although 15 min was the shortest annealing time used in the experiment, most crossing steps acquired an asymmetric shape beyond the steady-state S shape, indicating that they were progressing toward antiband formation. The importance of annealing times was evident from a sample annealed by dc current exclusively for 30 min, where the majority of terraces developed antibands by com-pletion of the annealing time. The step bunches have a wavy structure, and as a result, crossing steps at different stages of their evolution could be observed on each terrace due to variations in terrace width. For example, crossing steps on wider sections of a terrace marked as 1 in Fig. 2(a) have clearly progressed beyond the antiband onset point, while those constricted into a narrower section are in the steady-state S shape and aligned to the [11-2] direction perpendicular to the step bunches.
For samples annealed with weakened electromigration fields, wider terraces were found to be necessary to initiate antiband formation [Figs.2(b)–2(d)]. To allow for this, the longer annealing timest were used in order to create wider terraces, based on the known relationship L ∼ t1/2.21 In
addition, moderation of electromigration field reduced the rate of step bunching further, extending the required annealing times. Thus forE=2.8 V/cm the onset of antiband formation was achieved after 30-min annealing [Fig. 2(b)], while for
E=1.7 and 1.4 V/cm, 60-min annealing was used [Fig.2(c) and2(d), respectively]. Despite the extended annealing times and wider terraces created by weaker electric fields, the shape of most crossing steps did not progress to the steady state or further toward the antiband formation. In contrast to the surfaces annealed with the greater electric fields, the steps on most terraces either curved into a long S shape or failed to achieve a regular pattern and extended over a distance of tens of micrometers along the step bunches.
Crossing steps in the steady S shape spanning terrace segments of different widths were observed on all studied samples, with the maximum width up to 80% larger than the minimum. Qualitatively, this is in agreement with the inequality (1), which gives a necessary but insufficient con-dition for the onset of the antiband instability. Thus for a fixed value ofE, the lower limit of this relationship is defined by the width of the narrowest terrace where the steady-state profile of crossing steps can be achieved. Figure3shows the width of the narrowest observed terrace segments containing crossing steps in the steady-state shape Lm plotted against
electromigration fieldE. Figure3clearly demonstrates that the minimum terrace width required to initiate antiband formation progressively increases as the electric field is reduced. The shaded area in Fig.3indicates terraces where the minimum requirements forE andL are not satisfied and consequently the formation of antibands cannot be achieved. To attain a quantitative understanding, theLm(E) data were fitted with a power-law function, and the relationshipE=40.5Lm−1.96±0.05
was obtained (for [E]=V/cm and [Lm]=μm), which is in
good agreement with the theoretical relationship (1) predicting
E∼Lm−2dependence. Variation of the electromigration force
in this theoretical study was achieved by changing the effective charge for a fixed value of applied electric field,12 while the
[image:3.608.82.263.402.581.2]L -m Minimum terrace width ( m)µ
E
-E
lectric
field
(V/cm)
E~L-1.96 +/- 0.05
FIG. 3. (Color online) The width of the narrowest terrace seg-ments containing crossing steps in the steady-state shape (Lm) vs
electromigration fieldE, demonstrating theE∼Lm−2 dependence.
The shaded area in the graph indicates terraces where the minimum requirements forE and L are not satisfied and, consequently, the formation of antibands cannot be achieved. The graph points obscure the error bars along the Eaxis. Ten to 15 sites of 50 ×50 μm2
were randomly selected across the entire step-bunched area of each sample. The minimum widthLm was drawn from 30–40 separate
terraces containing crossing steps in the steady-state S shape.
field, is experimental proof of the criteria for the onset of the antiband instability. Direct comparison of these relationships results in the numerical value of 2 ˜βa2/qeff=40.5 V ˚A. Fora=
0.3 nm and the extrapolated value of ˜β=28 meV/A,˚ 12,22,23a value of the effective chargeqeff =0.012|e| can be estimated,
whereeis the elementary electric charge. This value is lower thanqeff =(0.13–0.35)|e| obtained in previous experimental studies6,12,20but is close to 0.02|e| deduced from first-principles
calculations.24
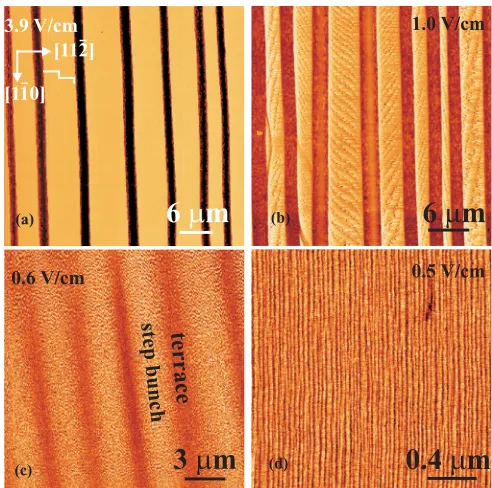
The minimum limit of the electromigration field in the study of antiband formation was determined by the critical fieldEcr, as applying an electric field weaker thanEcrresulted in the cessation of the step-bunching process. Figure4shows morphological changes on a vicinal Si(111) when the electric field applied throughout the annealing process is reduced from the attainable maximum to critical. The surface produced by exclusively direct current heating (maximum attainable
E) is characterized mostly by wide (2–4μm wide) terraces separated by narrow (approximately 1.0 μm wide) step bunches [Fig.4(a)]. Annealing with weaker applied electric fields increases the interstep distance and thus results in the formation of wider step bunches, broadening at the expense of terraces and eventually accounting for most of the surface area [Fig. 4(b)]. Upon annealing with an electromigration field close to critical, the step bunches expand as far as the neighboring bunches, while relatively narrow, less than 1μm wide, terraces can be still observed in some areas [Fig.4(c)]. Annealing with the critical electric fieldEcr or weaker fields results in the formation of a compressed step-density wave, where the number of atomic steps is relatively small compared to the coarsening step bunches and is not affected by the duration of annealing [Fig.4(d)].
Values of Ecr were determined for samples of different
miscut angles α at 1130 and 1270 ◦C (regimes II and III, respectively) and plotted as a function of the initial average interstep distancel(Fig.5). Figure5clearly shows that in both
6 m
3.9 V/cm[112]
[110]
(a) (b)
6 m
1.0 V/cm
3 m
0.6 V/cm
(c)
step
bunch
terrace
0.4 m
0.5 V/cm
(d)
FIG. 4. (Color online) The step-bunching morphology on a Si(111) surface created at 1130 ◦C by annealing with different electromigration fields. The surface is off cut 2◦ toward the [11-2] direction. The direction of the miscut is from left to right in all images, as shown by a stairway symbol in Fig.4(a). Darker areas correspond to step bunches. (a) Phase AFM image of a step-bunched Si(111) surface obtained entirely by dc annealing withE=3.9 V/cm. (b) Phase AFM image of Si(111) after annealing withE=1.0 V/cm. (c) Phase AFM image demonstrating that the step bunches expand and occupy most of the surface after annealing atE= 0.6 V/cm. (d) Phase AFM image of Si(111) after annealing withE=0.5 V/cm; the applied electric field is below critical and is insufficient to initiate the step-bunching process.
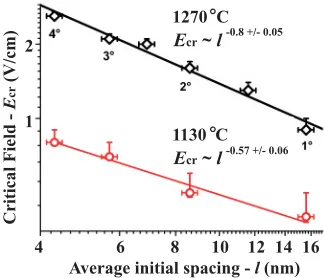
temperature regimes, reducinglresults in a stronger interstep repulsive interaction, and a notable increase in the applied electric field is required to initiate the step-bunching process. Furthermore, increasing temperature from 1130 to 1270◦C increasesEcrby a factor of 2.3–3.3. Such a dramatic increase
could be the result of different step-bunching mechanisms operating in the second and third temperature intervals, with the applied electric field being more effective in the second regime as a driving force for the instability. The enhanced interstep repulsive interaction arising from changes in the step morphology cannot be excluded. Fitting Ecr(l) data with a power law shows thatEcrdepends differently onlin the two in-vestigated temperature intervals. While in regime II (1130◦C) Ecr(l) follows a dependence that is close to 1/
√
l, a relationship close toEcr∼1/lwas observed in regime III (1270◦C).
[image:4.608.312.558.68.312.2] [image:4.608.95.247.72.203.2]1130 C
Ecr~l-0.57 +/- 0.06
1270 C
Ecr~l-0.8 +/- 0.05
4 6 8 10 12 14 16
Average initial spacing - (nm)l
Critical
Field
-(V/cm)
E
cr
1 2
FIG. 5. (Color online) Dependence of the critical electric field Ecron the initial average interstep distancelat 1130 and 1270◦C
(temperature regimes II and III, respectively). The annotated angles next to experimental points indicate the corresponding degree of miscut off the Si(111) plane in the [11-2] direction. Some error bars are obscured by the graph points.
from the kink positions, and detachment from the steps. Depending on the relative rates of these processes, there are two distinguished sublimation regimes in the third temperature interval. First, the attachment-limited regime is characterized by relatively slow adatom attachment-detachment kinetics and fast diffusion on terraces. Second, the diffusion-limited regime is characterized by relatively slow surface adatom diffusion and fast kinetics at the steps. Sublimation proceeds differently in these regimes; therefore they should be considered and ana-lyzed independently, and results should be compared with the experiment. For both regimes, the stability of a vicinal surface with respect to the unavoidable fluctuations in the step density is determined by the sign of the parameters=B2q2−B4q4,
where qis the wave number of the Fourier mode.13,14,17 For
small wave numbers the sign ofsis determined by the sign of B2. The surface is unstable for B2 >0, i.e., the fluctuations in the distribution of the interstep distances grow with the sublimation time, while for B2 < 0, the amplitude of the
fluctuations decreases, indicating that the surface is stable. In the case of attachment-detachment-limited sublimation (fast diffusion on terraces), the linear stability analysis gives13,17,25
B2= −n
e s
2ds
vdrift+Vcr ds
Kτs
, (3)
wherenes is the adatom surface equilibrium concentration, is the area of one atomic site, andτsis the adatom’s average
lifetime in the state of mobile adsorption. Here ds =Ds/K
is the characteristic length, whereDs is the adatom surface diffusion coefficient and K is the step kinetic coefficient. The adatom drift velocity is given by the equation vdrift =
qeffEDs/kBT, where kB is Boltzmann’s constant and T
is absolute temperature. Vcr = 12Kg/kBT l3 has units of
velocity and characterizes the step-step repulsion. The surface becomes unstable (B2 > 0) when the drift velocity vdrift is
negative (i.e., adatom electromigration is in the down-step direction) and its absolute value is larger than the second
term in the square brackets in the Eq. (3). Thus, the onset of step-bunching instability is determined by the condition
vdrift+Vcr
ds
Kτs
=0, (4)
which results in the equation for the absolute value of critical electromigration fieldEcr::
|Ecr| =
12g
Kqeffτsl3. (5)
Clearly, this relationship between the critical field and the initial interstep distance is too strong to account for the experimentally observedEcr∼1/ldependence. However, in the limit of slow surface diffusion, the equations of step motion are different, and linear stability analysis of these equations gives17
B2= −
ds
l2n
e s
vdrift+Vcrα2
l2
λ2
s
, (6)
where λs is the adatom’s mean diffusion path and α=
1+(qeffEλs/2kT)2≈1. An equation for absolute value of
Ecrcan be obtained in the same way as before, resulting in
|Ecr| = 12g
dsλ2sqeffl
. (7)
Qualitatively, this dependence is in agreement with the experimentally observed Ecr ∼ 1/l relationship, indicating
that in temperature interval III (1270 ◦C in our case), the sublimation process is diffusion limited and characterized by relatively slow surface adatom diffusion and fast kinetics at the atomic steps. The same conclusion was drawn in another experimental study from the relationship between the initial terrace width and the minimum terrace width within step bunches.25 It is essential to point out that Eq. (1), which
specifies the criteria for an onset of the antiband instability, was derived for the case of attachment-detachment-limited kinetics.12 Theoretical analysis of antiband formation under
the conditions of diffusion-limited sublimation is not available to date; therefore the question of the sublimation regime in the third temperature interval remains open and will be a subject of further investigation.
In the diffusion-limited regime the characteristic lengthds is smaller than l, and its lower limit is determined by the atomic distanceaon a crystal surface.25Thus, for a quantitative
estimate we can substitute into Eq. (7)ds=a=0.3 nm,=
a2,g=0.34 eVnm,20,26λ
s=10μm,6,20,27l=8.6 nm (a miscut
angleα=2◦), andqeff =0.012|e|, as obtained from studying antibands. The obtained value ofEcr =1.4 V/cm is in good
agreement with the value ofEcr =1.6 V/cm experimentally
measured for the sample with the same miscut of 2◦.
IV. CONCLUSIONS
We created step-bunch morphologies on Si(111) by pro-longed annealing at 1270◦C and investigated the effects of annealing with a reduced electromigration field on the evolu-tion of terraces’ crossing steps toward antiband formaevolu-tion. The relationship between the minimum terrace widthLmrequired for the antibands onset and the applied electromigration fieldE
[image:5.608.91.253.72.211.2]measured, in accordance with the predictions of the existing theoretical model.
Values of the critical fieldEcr, i.e., the minimum
electromi-gration field required to initiate the step-bunching process, were measured for samples with different misorientation angles toward the [11-2] direction at 1130 and 1270 ◦C (regimes II and III, respectively) and were plotted as a function of the average initial interstep distancel. Reducinglresulted in a stronger interstep repulsive interaction and a notable increase in the applied electric field, required to initiate the step-bunching process. Moreover, increasing temperature from 1130 to 1270◦C increasedEcr by approximately a factor of
3. The Ecr(l) dependence was found to be different in the
two investigated temperature intervals. A relationship close to Ecr(l)∼1/√l was measured for regime II, while a stronger
dependence close toEcr ∼1/lwas observed for regime III.
The Ecr ∼ 1/l dependence provided strong evidence that
adatom transport in temperature regime III is diffusion limited and characterized by relatively slow surface adatom diffusion and fast kinetics at the atomic steps. However, the question of the sublimation regime in the third temperature interval remains open. Good agreement was found between measured values of Ecr and values estimated using the analytical
expression derived for the case of sublimation with the slow diffusion.
ACKNOWLEDGMENT
The financial support of Science Foundation Ireland, Contract No. 06–IN.1/I91, is gratefully acknowledged.
1J. Krug, inMultiscale Modeling in Epitaxial Growth, edited by
A. Voigt, International Series of Numerical Mathematics, Vol. 149 (Birkhauser, Verlag, 2005) p. 69.
2I. V. Shvets, H. C. Wu, V. Usov, F. Cuccureddu, S. K. Arora, and
S. Murphy,Appl. Phys. Lett.92, 023107 (2008).
3F. Cuccureddu, V. Usov, S. Murphy, C. O Coileain, and I. V. Shvets,
Rev. Sci. Instrum.79, 053907, (2008).
4A. Latyshev, A. Aseev, A. Krasilnikov, and S. Stenin,Surf. Sci.
213, 157 (1989).
5S. Stoyanov and V. Tonchev, Phys. Rev. B 58, 1590
(1998).
6K. Fujita, M. Ichikawa, and S. Stoyanov,Phys. Rev. B60, 16006
(1999).
7F. Leroy, D. Karashanova, M. Dufay, J. M. Debierre, T. Frisch,
J. J. M´etois, and P. M¨uller,Surf. Sci.603, 507 (2009).
8M. Degawa, H. Minoda, Y. Tanishiro, and K. Yagi,Surf. Sci.461,
L528 (2000).
9A. Latyshev, A. Krasilnikov, and A. Aseev,Surf. Sci. 311, 395
(1994).
10D. J. Liu, J. D. Weeks, and D. Kandel,Phys. Rev. Lett.81, 2743
(1998).
11J. Krug, V. Tonchev, S. Stoyanov, and A. Pimpinelli,Phys. Rev. B
71, 045412 (2005).
12K. Thurmer, D. Liu, E. D. Williams, and J. D. Weeks,Phys. Rev.
Lett.83, 5531 (1999).
13B. Ranguelov and S. Stoyanov,Phys. Rev. B77, 205406 (2008). 14B. Ranguelov and S. Stoyanov,Surf. Sci.603, 2907 (2009). 15P. Nozieres,J. Phys. (Paris)48, 1605 (1987).
16H. Jeong and E. D. Williams,Surf. Sci. Rep.34, 171 (1999). 17S. Stoyanov, in Nanophenomena at Surfaces, edited by
M. Michailov, Springer Series in Surface Sciences, Vol. 47 (Springer, Berlin, 2011) p. 253.
18V. Usov, C. O Coileain, and I. V. Shvets,Phys. Rev. B82, 153301
(2010).
19V. Usov, C. O Coileain, and I. V. Shvets,Phys. Rev. B83, 155321
(2011).
20Y. Homma and N. Aizawa,Phys. Rev. B62, 8323 (2000). 21D. J. Liu and J. D. Weeks,Phys. Rev. B57, 14891 (1998). 22K. Sudoh, T. Yoshinobu, H. Iwasaki, and E. D. Williams,Phys. Rev.
Lett.80, 5152 (1998).
23J. M. Bermond, J. J. Metois, J. C. Heyraud, and F. Floret,Surf. Sci.
416, 430 (1998).
24D. Kandel and E. Kaxiras,Phys. Rev. Lett.76, 1114 (1996). 25B. J. Gibbons, S. Schaepe, and J. P. Pelz, Surf. Sci.600, 2417
(2006).