The Association of Southeast Asian Nations (ASEAN) internal and external economic integration results in two major free trade markets including the ASEAN Economic Community (AEC) and the Regional Comprehensive Economic Partnership (RCEP). The AEC offers the opportunities in the form of a huge market of US$ 2 800 billion and over 625 million people in 2015. This region is collectively the third largest economy in Asia and the seventh largest economy in the world. The prospective RCEP countries have a population of 3.4 billion people and a gross do-mestic product of US$ 49 500 billion (ASEAN 2017). Petri et al. (2012) believe that the ASEAN economic integration could gain a similar result to those com-ing from the European scom-ingle market, amountcom-ing to 5.3% of the region’s income. The benefits could be doubled if the regional integration can lead to new free trade agreements with key external partners and the whole region will share in these benefits.
The ASEAN countries, however, encounter both internal challenges consisting of competitions among the member countries; import substitution policies of industrialization; small extent of intra-ASEAN trade; and wide differences in economic size,
devel-opment level, and industrial competence giving rise to divergent perceptions of benefits and external ob-stacles including strong globalization, global market competition, rapid economic and trade growth in India and China, and the proliferation of preferential trade agreements (Chia 2013; Ravenhill 2008). Although the ASEAN countries are diverse in terms of social, economic, and political structures, they are in the similar geographical area and natural conditions (Siah et al. 2009). These may cause the countries to become competing with each other. Naya and Plummer (1997) confirm that the ASEAN economic cooperation has not developed significantly and it may be due to the dominance of politics or the effects of trade diversion in a region characterised by low levels of intra-regional trade.
The agriculture is a key contributor to the ASEAN countries’ economies in three manners: (i) it is an im-portant component of GDP in Cambodia, Myanmar, Lao, Vietnam, and Indonesia; (ii) there is significantly high rate of employment in agricultural sector in Lao, Cambodia, Vietnam, Thailand, and Indonesia; and (iii) the sector accounts for the significant share of export values in Myanmar, Indonesia, Thailand,
Assessing the agricultural trade complementarity
of the Association of Southeast Asian Nations countries
Viet HOANG*
University of Economics Ho Chi Minh City, Ho Chi Minh City, Vietnam *Corresponding author: [email protected]
Hoang V. (2018): Assessing the agricultural trade complementarity of the Association of Southeast Asian Nations countries. Agric. Econ. – Czech, 64: 464–475.
Abstract: This paper aims to investigate the agricultural trade complementarity of the Association of Southeast Asian Nations (ASEAN) countries on the global agricultural market over the period 1997–2015 by employing the trade comple-mentarity index (TCI), the export similarity index (ESI), and Spearman’s rank correlation coefficients for competitiveness indicators. The results indicate that: (i) the ASEAN countries’ agricultural export patterns are weakly complementary in matching the regional import demands; while (ii) they are relatively complementary in exporting agricultural products to the world market; (iii) the countries’ agricultural competitiveness patterns are more affected by and benefited from the global integration than the regional integration; and (iv) the countries, moreover, tend to become more substitutable over time. The research results suggest that the ASEAN countries should cooperate and utilise the internal markets to enhance the competitiveness and predominantly focus on the external global markets.
Keywords: Association of Southeast Asian Nations, agriculture, competitiveness, complementary, similarity
Vietnam, and Malaysia. Moreover, the countries have similar comparative advantages in agricultural products such as rice, natural rubber, spices, vegeta-ble fats and oils, wood in chips, fuelwood, fish, and crustaceans (Hoang et al. 2017). Thus, this research is motivated to identify whether the ASEAN countries are complementary on the world market.
The study aims to investigate the trade comple-mentarity of the ASEAN countries on the world agricultural market by employing: (i) the trade com-plementarity index (TCI); (ii) the export similarity index (ESI); and (iii) the Spearman’s rank correlation coefficients for competitiveness indices such as the revealed comparative advantage, the relative trade advantage, and the normalized revealed comparative advantage over the period 1997–2015. The result will contribute to both economic literature and practical implications. First, the paper expands the empirical studies of the complementarity and competitiveness indices in the ASEAN context. Second, the findings provide the vital complementarity and competitive-ness indicators for organisational busicompetitive-ness strategies, national development and trade policies, and regional integration programs.
LITERATURE REVIEW
The international trade integration and free trade agreements bring both benefits and challenges to the member countries. The member countries will achieve more social welfare from the difference of demands, resource endowments, and production and trade patterns while they face the competition from the similarity of the factors, production, and trade. The trade complementarity rather than sub-stitutability and competition will result in the rapid growth of trade flows between the partners. According to Drysdale (1969), complementarity is used to define the extent to which countries have dissimilar resources and patterns of production, and they are, therefore, likely to trade intensively with each other. Specifically, he describes the concept of complementarity “in a relative sense and measures the extent to which one country’s export pattern matches another country’s import pattern more closely than it matches the pattern of world imports”. Finger and Kreinin (1979) confirm that if the exports between countries are not similar or there is no commodity overlap in export, then there is a trade creation and vice versa. Vaillant and Ons (2002) explain the trade complementarity as a measure
of the level of similarity between the export supply of a country and the import demand of its partners. Wu and Zhou (2006) add that if there are overlaps in the two countries’ comparative advantage or trade patterns and thus there must be competition between them in the areas. The empirical measures of aggre-gate trade performance and complementarity can identify the general direction and thrust in which a country’s investment and trade should take in order to exploit international differences in product and factor supply and demand (Vollrath and Johnston 2001). There are various methods to empirically anal-yse the complementarity, similarity, competition, and substitutability between countries based on trade performance data.
Drysdale (1969) proposes TCI for an industry or a country in its partner country or region. The TCI measures the extent to which a country’s ex-port to its partner country is relatively large since the product composition of the exporting country matches that of importing country more closely than it matches the commodity composition of the world trade. There are two measures of the level of trade complementarity derived from the two-flow trades of these countries. The index has been modified and employed by scholars such as Vaillant and Ons (2002), Andreosso-O’Callaghan (2009). Vollrath and Johnston (2001) propose a framework of the trade complemen-tarity index (TCIv) with the different components. The main parts of this formula are the relative export advantage and the relative import advantage. The TCIv measures the degree to which one country’s relative export share structure corresponds with another’s across certain commodities. In other words, the index assesses the market match between two countries where a country is selling what the other country wants to buy (Chen and Yang 2008).
of export similarity to identify the similarity of the trade patterns of countries in a common market in which both countries compete. The measure in-volves to working out the sector share of total exports for each country and, after that, for each pair of coun-tries, and to sum the minimum of the two countries’ shares for a given sector across all sectors. The index has been employed by authors such as Linnemann and Beers (1988), Shuai and Wang (2011), and Nguyen et al. (2017).
The trade complementarity between two coun-tries can be measured by the bilateral trade flows, and their trade flows to the world market using the trade intensity index proposed by Kojima (1964) or Brown (1949). The index is presented in two forms, namely the export intensity index and import in-tensity index. These indices reflect the ratio of the share of a country’s trade with its partner relative to the share of world trade destined for the partner (Wu and Zhou 2006).
The extent of the association between trade com-petitiveness indices of countries is an excellent mea-sure of substitutability or complementarity between two countries. The degree and nature of the asso-ciation between trade competitiveness indices can be identified by using the Spearman’s rank correla-tion coefficient. In other words, by testing the ranks of agricultural sectors in two countries, the correlation would explain the nature of the products – substitut-able or complementary - which are sold by the two countries (Jayawickrama and Thangavelu 2010).
MATERIALS AND METHODS
Trade complementarity index
Drysdale (1969) proposes the trade complemen-tarity index (TCI). The main idea of the index is to measure the extent to which one country’s export pattern matches another country’s import pattern more closely than it matches the pattern of world imports. The greater this similarity, the more likely trade between them is. The TCI can be presented as follows:
TCI n aj w a bj
ab j j j
a w a b
X M M M
X M M M
−
= × ×
−
∑
(1)where j a
X is the country a’s export of commodity j;
a
X is country a’s total export; Mw is the world
im-port; Ma is country a’s total import; Mwj is the world import of commodity j; j
a
M is the country a’s import of commodity j; j
b
M is the country b’s import of commodity j. Mb is country b’s total import. The
value of TCI greater (less) than the unity indicates the existence of strong (weak) complementarity between the export specialisation of country a and the import specialisation of country b. The TCI value of unity means that the export and import specialisations are similar to the world economy specialisation and, therefore, the existence of comparative advantage cannot explain the bilateral trade.
Export similarity index
Finger and Kreinin (1979) suggest the export simi-larity index (ESI) to measure the degree of simisimi-larity of exports between two countries on the world market. The ESI also explains the trade complementarity be-tween two countries by comparing the export patterns of the countries on the world market. The model can be defined as follows:
(
)
ESI , 100 n min aj, bj j
a b X X ab w
X X
= ×
∑
(2)where ESI (ab, w) is the similarity degree of export patterns of country a and country b to the world mar-ket; j/
a a
X X is the share of commodity j in country
a’s total export to the world market; and j/
b b X X is the share of commodity j in country b’s total ex-port to the world market. The ESI value ranges from 0 to 100. If the exports of both countries to the world market are entirely the same, this index is 100; if they are totally different, it is zero. The greater (smaller) values of the ESI mean, the higher (lower) degree of the export similarity or the lower (higher) degree of the export complementarity. The increase of the ESI indicates that country a and country b are get-ting more substitutable or compeget-ting and vice versa.
Spearman’s rank correlation coefficients of the competitiveness indicators
associa-tion between trade competitiveness indicators. The Spearman’s rank correlation coefficient can be com-puted by using the formula as follows:
2
2
6 ρ 1
1 n j j s d n n
(3)where j = 1,2, ... , n is agricultural sector, dj is the difference between the ranks of the competitiveness in sector j in two countries. The ρs value ranges from
negative one to positive one. A positive (negative)
ρs indicates that the two countries are substitutable
(complementary) on the world market. The closer
ρs to the unity, the stronger is the export substi-
tutability between the two countries and vice versa. If the two countries have the same competitiveness ranking across sectors, the difference between rank-ings become zero and Spearman’s rank correlation coefficient equal one, and the countries have perfectly substitutable agricultural competitiveness structures. The increase of ρs indicates that the weaker country
catches up quickly with the stronger country due to the change in the competitiveness (Jayawickrama and Thangavelu 2010).
In this paper, the competitiveness indicators for Spearman’s rank correlation coefficients include the revealed comparative advantage (RCA), the relative trade advantage (RTA), and the normalised revealed comparative advantage (NRCA) which are calculated in Hoang (2017).
The RCA was proposed by Balassa (1965). The idea of the RCA index is to compare the performance of a country in a commodity with the performance of a reference group of countries using export flows by using the observed export patterns. The RCA index can be defined as follows:
RCAj aj wj a a w X X X X = ÷
(4)
where j a
X represents the country a’s export of prod-uct j; Xa is country a’s total export; Xwj is the world export of commodity j; Xw is the world export. The
RCA values range between zero and +∞, and the comparative-advantage-neutral point is one.
Vollrath (1991) develops the RTA index to measure the competitive advantage. The index is calculated as the difference between the relative export advantage (RXA) and the relative import advantage (RMA). The Vollrath’s indices are formulated as follows:
Relative export advantage (RXA):
RXAj aj wj a a w X X X X = ÷
(5)
Relative import advantage (RMA):
RMAj aj wj a a w M M M M = ÷
(6)
Relative trade advantage (RTA):
RTAj RXAj RMAj
a= a− a (7)
where the description of X is similar to those in the RCA index and M is explained similarly to X. The RTA values are between –∞ and +∞ and the comparative-advantage-neutral point is zero. The RTA values are positive in the case of competitive advantages and negative in opposite situations.
Yu et al. (2009) propose the NRCA index to measure the degree of deviation of a specific country’s actual export from its neutral level in terms of its relative scale with respect to the world export market and thus establishes its comparability across commodity and country. The country a’s export of commod-ity j at the neutral point, ˆj
a
X is derived from the comparative-advantage-neutral point of the RCA index. The NRCA index can be presented shortly as follows:
NRCAj aj aj ˆaj aj a wj a
w w w w w
X X X X X X
X X X X X
∆ −
= = = − (8)
where the NRCA values range from –0.25 to 0.25 with the neutral point of zero when the actual export is identical to the expected export of the country. The NRCA > 0 presents the country a’s actual export of commodity j is higher than the expectation. The NRCA < 0 indicates that the country a’s actual export of commodity j is lower than the expectation.
Data
such as the United Nations Comtrade (UN Comtrade 2017) and the International Trade Center (ITC 2017).
RESULTS AND DISCUSSION
The agricultural trade complementarity of the ASEAN countries
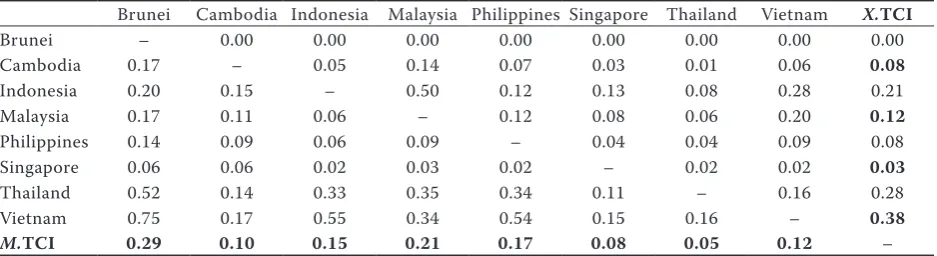
The Table 1 shows that all TCI values are smaller than one and relatively close to zero. These results, generally, imply that the ASEAN countries are weakly complementary or strongly competing in the agricultural trade. In other words, the agricultural export patterns of the ASEAN countries weakly match the agricultural import patterns of the partner countries in the ASEAN region in comparison with the agricultural commod-ity composition of the word trade. The M.TCI values indicate the mean import complementarity of one country to other ASEAN countries. The result shows that the agricultural import patterns of Brunei and Malaysia are the most strongly complementary to the agricultural export patterns of other ASEAN countries while those of Thailand and Singapore are the most weakly complementary to the export patterns of the ASEAN countries. The X.TCI values explain the mean export complementarity of one country to other ASEAN countries. The result states that the agricultural export patterns of Vietnam and Thailand are the most strongly complementary to the agricultural import patterns of other ASEAN countries. Vietnam’s agricultural sup-ply is the most strongly complementary to the demand of Brunei, Indonesia, and Philippines with the TCI values of 0.75, 0.55, and 0.54, respectively whilst the
supplies of Brunei and Singapore are not complemen-tary to those of the ASEAN countries.
The trend analysis of the mean TCI values shows that the agricultural complementarity degree of the ASEAN countries slightly decreases over the period 1997–2015. This indicates that the ASEAN countries become less complementary or more competing with each other along with their regional and global integration processes (Figure 1).
The agricultural export similarity of the ASEAN countries
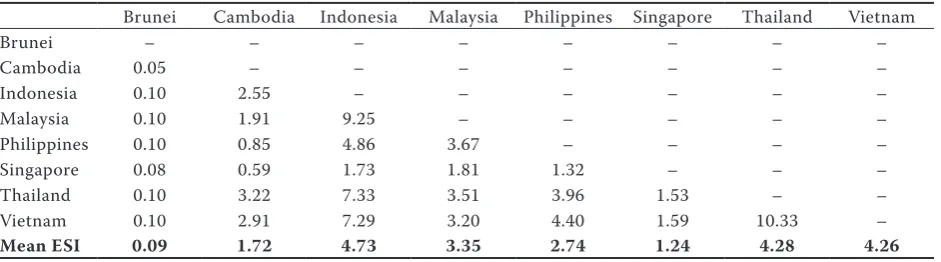
[image:5.595.64.533.582.710.2]The ESI explains the trade complementarity between the countries with the focus on comparing their export patterns on the world market. The results, in general, show the significantly low degree of similarities in the agricultural export patterns of the ASEAN coun-tries with the mean ESI value of 2.8. This means that the ASEAN countries are strongly complementary in exporting the agricultural products to the global market. The ESI results contrast with those of the TCI analysis. The possible explanation for these different results between the TCI and the ESI is that the TCI measures the match of a country’s export supply for its partner’s import demand while the ESI pays atten-tion to comparing the export patterns among these countries. Indonesia, Thailand, and Vietnam have the highest degree of agricultural export similarities to other ASEAN countries with the ESI values of 4.73, 4.28, and 4.26, respectively. Brunei, Singapore, and Cambodia obtain the lowest degree of agricultural export similarities to other ASEAN countries. The country pairs of Thailand – Vietnam and Indonesia
Table 1. Agricultural trade complementarity by the trade complementarity index (TCI)
Brunei Cambodia Indonesia Malaysia Philippines Singapore Thailand Vietnam X.TCI
Brunei – 0.00 0.00 0.00 0.00 0.00 0.00 0.00 0.00
Cambodia 0.17 – 0.05 0.14 0.07 0.03 0.01 0.06 0.08
Indonesia 0.20 0.15 – 0.50 0.12 0.13 0.08 0.28 0.21
Malaysia 0.17 0.11 0.06 – 0.12 0.08 0.06 0.20 0.12
Philippines 0.14 0.09 0.06 0.09 – 0.04 0.04 0.09 0.08
Singapore 0.06 0.06 0.02 0.03 0.02 – 0.02 0.02 0.03
Thailand 0.52 0.14 0.33 0.35 0.34 0.11 – 0.16 0.28
Vietnam 0.75 0.17 0.55 0.34 0.54 0.15 0.16 – 0.38
M.TCI 0.29 0.10 0.15 0.21 0.17 0.08 0.05 0.12 –
M.TCI values indicate the mean import complementarity of one country to other ASEAN countries; X.TCI values explain the mean export complementarity of one country to other ASEAN countries
– Malaysia the most similar in agricultural export patterns (Table 2).
The trend analysis for the mean ESI values over the period 1997-2015 indicates the increasing similar-ity in the agricultural export patterns of the ASEAN countries. This means that the ASEAN countries have become more similar or competing with each other along with their regional and global integration pro-cesses (Figure 2).
The agricultural trade complementarity by Spearman’s rank correlation coefficients
This study classifies ρs values into 4 groups to iden-
tify the degree of the agricultural trade complemen-tarity: (i) strong complementarity (–1, –0.5); (ii) weak complementarity (–0.5, 0); (iii) weak substitutability (0, 0.5); and (iv) strong substitutability (0.5, 1).
Spearman’s rank correlation coefficients of the RCA indicators
The positive ρs values of the RCA indicators
in Table 3 show that the ASEAN countries are com-peting on the world market and they have the weak substitutability in agricultural competitiveness struc-tures with the mean ρs value of 0.43. Indonesia has
the strongest agricultural substitutability for other ASEAN countries with the ρs value of 0.51 while
[image:6.595.66.524.101.275.2]Brunei obtains the weakest agricultural substitutabil-ity for other ASEAN countries. Indonesia-Philippines, Indonesia-Singapore, and Indonesia-Malaysia are the pairs of countries with the strongest agricul-tural substitutability whilst Cambodia-Thailand, Singapore-Thailand, and Malaysia-Vietnam are the pairs of countries with the strongest agricultural complementarity.
Table 2. ASEAN countries’ agricultural export similarity by the export similarity index (ESI)
Brunei Cambodia Indonesia Malaysia Philippines Singapore Thailand Vietnam
Brunei – – – – – – – –
Cambodia 0.05 – – – – – – –
Indonesia 0.10 2.55 – – – – – –
Malaysia 0.10 1.91 9.25 – – – – –
Philippines 0.10 0.85 4.86 3.67 – – – –
Singapore 0.08 0.59 1.73 1.81 1.32 – – –
Thailand 0.10 3.22 7.33 3.51 3.96 1.53 – –
Vietnam 0.10 2.91 7.29 3.20 4.40 1.59 10.33 –
Mean ESI 0.09 1.72 4.73 3.35 2.74 1.24 4.28 4.26
[image:6.595.64.535.612.743.2]Source: own calculations based on UN Comtrade data (2017)
Figure 1. Trend of ASEAN countries’ agricultural complementarity indicators
Source: own calculations based on UN Comtrade data (2017)
0.00 0.05 0.10 0.15 0.20 0.25 0.30 0.35
19
97
19
98
19
99
20
00
20
01
20
02
20
03
20
04
20
05
20
06
20
07
20
08
20
09
20
10
20
11
20
12
20
13
20
14
20
15
The increasing trend of the ρs values indicates that
the agricultural competitiveness structures by the RCA of the ASEAN countries are becoming more and more substitutable or competing with each other. In other words, the weaker countries catch up quickly with the stronger countries due to the change in the agricultural competitiveness (Figure 3).
Spearman’s rank correlation coefficients of the RTA indicators
The ρs values of the RTA indicators show the
stronger agricultural complementarity of the ASEAN countries by the RTA against the RCA with the mean coefficient value of 0.15 and some negative ρs val-
ues. Brunei is the strongest complementary while Indonesia is the strongest substitute for other ASEAN countries in the agricultural competitiveness struc-tures. Singapore-Thailand and Brunei-Vietnam are significantly complementary (Table 4). Moreover,
the decreasing trend of the ρs values of the RTA
indicators means that the degree of the agricultural complementarity of the ASEAN countries is becom-ing stronger (Figure 3). In other words, the ASEAN countries are less competing with each other on the world agricultural market. The result is contrary to those of the RCA indicators.
Spearman’s rank correlation coefficients of the NRCA indicators
The result of the NRCA indicators is similar to the RCA indicators. The positive ρs values of the
NRCA indicators show that the ASEAN countries are competing on the world market and they have the relative substitutability in agricultural competi-tiveness structures with the mean ρs value of 0.37.
[image:7.595.63.533.113.243.2]Indonesia also has the strongest substitutability for other ASEAN countries while Cambodia obtains
Figure 2. Trend of ASEAN countries’ agricultural export similarity indicators
Source: own calculations based on UN Comtrade data (2017) 0.00
1.00 2.00 3.00 4.00 5.00 6.00
19
97
19
98
19
99
20
00
20
01
20
02
20
03
20
04
20
05
20
06
20
07
20
08
20
09
20
10
20
11
20
12
20
13
20
14
20
15
[image:7.595.64.521.281.452.2]Export similarity indicators
Table 3. Spearman’s rank correlation coefficients of the revealed comparative advantage (RCA) indicators
Brunei Cambodia Indonesia Malaysia Philippines Singapore Thailand Vietnam
Brunei – – – – – – – –
Cambodia 0.52 – – – – – – –
Indonesia 0.30 0.40 – – – – – –
Malaysia 0.35 0.35 0.62 – – – – –
Philippines 0.40 0.40 0.66 0.46 – – – –
Singapore 0.35 0.34 0.64 0.59 0.53 – – –
Thailand 0.40 0.20 0.44 0.32 0.57 0.27 – –
Vietnam 0.29 0.49 0.48 0.28 0.43 0.34 0.51 –
Mean 0.37 0.39 0.51 0.42 0.49 0.44 0.39 0.40
the weakest substitutability (Table 5). The decreas-ing trend of the ρs values of the NRCA indicators
[image:8.595.69.529.104.319.2]means that the level of the agricultural complemen-tarity of the ASEAN countries is becoming stronger (Figure 3). In other words, the ASEAN countries are less and less competing with each other on the world agricultural market over time.
The research results, in general, demonstrate that the ASEAN countries are weakly complementary in matching the regional agricultural import demands while they are relatively complementary in exporting agricultural products to the global market. These coun-tries’ agricultural trade flows and competitiveness pat-terns are more affected by and benefited from the global integration than the regional integration. It is
remark-able that the ASEAN countries tend to become more and more competing or substitutable on both regional and global markets. The potential explanation for these issues is the economic linkages, dependences or trade relations between the ASEAN and the external markets, especially the giant and close markets. China (including Hong Kong), the United States of America (the U.S.), Japan, India, and Australia are the top agricultural trade partners of the ASEAN countries with the shares of the ASEAN agricultural export of 15, 10.5, 7.3, 6, and 2.3%, respectively in 2016. These markets, in total, ac-count for over 41% of agricultural export value, equal to US$ 49 809 million, and 38% of agricultural import value, equal to US$ 38 714 million, in the ASEAN coun-tries in 2016 (Figures 4–5). China, India, and Australia
Table 4. Spearman’s rank correlation coefficients of the relative trade advantage (RTA) indicators
Brunei Cambodia Indonesia Malaysia Philippines Singapore Thailand Vietnam
Brunei – – – – – – – –
Cambodia 0.35 – – – – – – –
Indonesia –0.05 0.17 – – – – – –
Malaysia –0.01 0.08 0.52 – – – – –
Philippines 0.13 0.17 0.50 0.39 – – – –
Singapore 0.41 0.09 0.21 0.16 0.05 – – –
Thailand –0.24 –0.02 0.25 0.08 0.33 –0.30 – –
Vietnam –0.21 0.22 0.37 –0.01 0.29 –0.10 0.43 –
Mean 0.06 0.15 0.28 0.17 0.27 0.08 0.08 0.14
[image:8.595.65.533.405.533.2]Source: own calculations based on UN Comtrade data (2017)
Figure 3. Trend of Spearman’s rank correlation coefficients of competitiveness indices
NRCA – normalised revealed comparative advantage; RCA – revealed comparative advantage; RTA – relative trade advantage Source: own calculations based on UN Comtrade data (2017)
0.10 0.20 0.30 0.40 0.50 0.60
19
97
19
98
19
99
20
00
20
01
20
02
20
03
20
04
20
05
20
06
20
07
20
08
20
09
20
10
20
11
20
12
20
13
20
14
20
15
RCA RTA NRCA
are the most increasing import markets of the ASEAN’s agricultural export with the annual growth rate of 14, 18, and 13%, respectively, over the period 2001–2016.
It is suggested that the ASEAN countries have to expand and predominantly focus on the external global markets based on the international trade and economic agreements and partnerships of the asso-ciation or the individual member countries to avoid the fierce competition in the regional markets and to enhance the economic and trade development. This strategy may cause the higher competition pres-sure on the world agricultural commodity markets.
The trade structure and its dynamics commonly reflect the deep structure of a country’s economy and production in nature as the resources and competitive advantages cannot change quickly despite sudden
[image:9.595.64.533.113.243.2]shocks, new technology, and institutional systems. Though the ASEAN countries, in general, have ad-vantages to produce agricultural products from the appropriate natural environment, fertile soil, and abundant water, they face the problems of increasing input costs, unstable and growing market prices due to the land degradation, the climate change, the nega-tive environmental impact, and changing politics and economic conditions (Hoang et al. 2017). Moreover, the food price crisis in 2007–2008 results in the sig-nificantly negative impact on the ASEAN countries’ food security and thus they have to change the agri-cultural production system and food policy to ensure the national food security such as the Philippines with the promoting self-sufficiency, subsidies to farmers, and consumer price controls or subsidies; Malaysia
Table 5. Spearman’s rank correlation coefficients of the normalised revealed comparative advantage (NRCA) indicators
Brunei Cambodia Indonesia Malaysia Philippines Singapore Thailand Vietnam
Brunei – – – – – – – –
Cambodia 0.09 – – – – – – –
Indonesia 0.34 0.19 – – – – – –
Malaysia 0.36 0.13 0.74 – – – – –
Philippines 0.28 0.17 0.59 0.44 – – –
Singapore 0.27 0.09 0.58 0.59 0.36 – – –
Thailand 0.39 0.17 0.48 0.47 0.54 0.34 – –
Vietnam 0.30 0.28 0.57 0.33 0.47 0.31 0.53 –
Mean 0.29 0.16 0.50 0.44 0.41 0.36 0.42 0.40
Source: own calculations based on UN Comtrade data (2017)
Figure 4. Shares of top markets in ASEAN’s total agricultural export (%)
Source: own calculations based on ITC data (2017)
0 2 4 6 8 10 12 14 16 18
2001 2002 2003 2004 2005 2006 2007 2008 2009 2010 2011 2012 2013 2014 2015 2016
[image:9.595.67.525.509.724.2]and Myanmar with the promoting self-sufficiency; Vietnam, Cambodia, and Thailand with export restric-tions; Thailand, Indonesia, Malaysia, and Cambodia with consumer price controls or subsidies (Chandra and Lontoh 2010; Wana and Andreosso-O’Callaghan 2017). The change of agricultural production sys-tems and food policies of the ASEAN countries may remarkably affect the agricultural trade flows in the ASEAN region, the agricultural trade competitive-ness patterns on the world market, and significantly explain the reasons why these countries tend to be more substitutable in the internally regional markets while they are more complementary on the interna-tional markets.
CONCLUSION
This study assesses the agricultural complemen-tarity degree of the ASEAN countries on the world market along with the regional and global economic integration processes. The results by the TCI, gen-erally, imply that the ASEAN countries are weakly complementary or strongly competing in the agri-cultural trade in the world market. In other words, the agricultural export patterns of the ASEAN coun-tries weakly match the agricultural import patterns of the partner countries in the ASEAN region in comparison with the agricultural commodity compo-sition of the word trade. In addition, the falling trend
of the mean TCI values shows that the agricultural complementarity degree of the ASEAN countries slightly decreases over the period 1997–2015. In other words, the ASEAN countries are becoming less complementary.
The results by the ESI, however, show the low de-gree of similarity in the agricultural export patterns of the ASEAN countries with the mean ESI value of 2.8. This means that these countries are relatively complementary in exporting the agricultural products to the world market. The different result between the TCI and the ESI indicates that the ASEAN countries are not complementary in matching their partners’ agricultural import demand while they are complemen-tary in supplying agricultural products to the world markets. In other words, the countries will obtain more benefit from exporting agricultural products to the world markets than to the regional markets. The growing trend of the mean ESI values shows that these countries are becoming more competing on the world market.
[image:10.595.67.532.99.321.2]Spearman’s correlation coefficients for the com-petitiveness indicators, in general, show that the ASEAN countries’ agricultural competitiveness patterns are relatively substitutable on the world market. Singapore-Thailand, Brunei-Vietnam, and Brunei-Thailand are the most complementary pairs whilst Indonesia-Philippines, Indonesia-Malaysia, and Thailand-Vietnam the most substitutable pairs in the agricultural trade competitiveness patterns.
Figure 5. Shares of the top markets in ASEAN’s total agricultural import (%)
Source: own calculations based on ITC data (2017)
0 2 4 6 8 1 12 14 16 18
2001 2002 2003 2004 2005 2006 2007 2008 2009 2010 2011 2012 2013 2014 2015 2016
The study, generally, suggests that the ASEAN coun-tries should cooperate to take advantage of their eco-nomic resources and internal markets as a “common domestic” market to enhance the competitiveness and predominantly focus on the external markets based on the global trade and economic agreements and partnerships of the association and the member coun-tries such as the RCEP, the TPP-CPTPP (Trans-Pacific Partnership), and their bilateral free trade agreements. Moreover, the ASEAN countries should specialise in producing and exporting the agricultural products with comparative advantages and import the uncompeti-tive products to enhance the regional trades, effecuncompeti-tively utilise their economic resources, and create higher social welfare based on the elimination of import and export restrictions and the reduction in production subsidies.
Acknowledgement
Thank Ms. An Nguyen for her assistance to the research.
REFERENCES
Andreosso-O’Callaghan B. (2009): Economic structural complementarity: how viable is the Korea-EU FTA? Journal of Economic Studies, 36: 147–167.
Association of Southeast Asian Nations (ASEAN) (2017): Available at http://asean.org/asean-economic-commu-nity/ (accessed May 10, 2017).
Balassa B. (1965): Trade liberalisation and “revealed” com-parative advantage. The Manchester School, 33: 99–123. Benedictis L.D., Tajoli L. (2007): Openness, similarity in
export composition, and income dynamics. The Jour-nal of InternatioJour-nal Trade & Economic Development, 16: 93–116.
Brown A.J. (1949): Applied Economics: Aspects of World Economy in War and Peace. George Allen and Unwin, London.
Chandra A.C., Lontoh L.A. (2010): Regional Food Se-curity and Trade Policy in Southeast Asia: The Role of ASEAN. International Institute for Sustainable Development, Manitoba.
Chia S.Y. (2013): The ASEAN economic community: Progress, challenges, and prospects. Working Paper No. 440. ADBI Working Paper – Asian Development Bank Institute.
Drysdale P. (1969): Japan, Australia, New Zealand: the prospect for western pacific economic integration. Eco-nomic Record, 45: 321–342.
Finger J.M., Kreinin M.E. (1979): A measure of export similarity and its possible uses. The Economic Jour-nal, 89: 905–912.
Hoang V.V. (2017): Investigating the Agricultural Com-petitiveness in the ASEAN Countries. Research Report. University of Economics, Ho Chi Minh City.
Hoang V.V., Tran T.K., Tu V.B. (2017): Assessing the agri-cultural competitive advantage by the RTA index: A case study in Vietnam. AGRIS on-line Papers in Economics and Informatics, 9: 15–26.
International Trade Center (ITC) (2017): ITC Trade Map. Available at https://www.trademap.org/ (accessed May 10, 2017).
Jayawickrama A., Thangavelu M. (2010): Trade linkages between China, India and Singapore: Changing com-parative advantage of industrial products. Journal of Economic Studies, 37: 248–266.
Kojima K. (1964): The pattern of international trade among advanced countries. Hitotsubashi Journal of Econom-ics, 5: 16–36.
Linnemann H., Beers C.V. (1998): Measures of export-im-port similarity and the Linder hypothesis once again. Re-view of World Economics, 124: 445–457.
Naya S.F., Plummer M.G. (1997): Economic co-operation after 30 years of ASEAN: ASEAN Economic Bulletin, 14: 117–126.
Nguyen T.N.A., Pham T.H.H., Vallee T. (2017): Similar-ity in trade structure: Evidence from ASEAN + 3. The Journal of International Trade & Economic Develop-ment, 26: 1–25.
Petri P.A., Plummer M.G., Zhai F. (2012): ASEAN economic community: A general equilibrium analysis. Asian Eco-nomic Journal, 26: 93–118.
Ravenhill J. (2008): Fighting irrelevance: an economic community with ASEAN characteristics. The Pacific Review, 21: 469–488.
Shuai C.M., Wang X. (2011): Comparative advantages and complementarity of the Sino-US agricultural trade: an empirical analysis. Agricultural Economics – Czech, 57: 118–131.
Siah K.L., Choong C.K., Yusop Z. (2009): AFTA and the intra-trade patterns among ASEAN-5 economies: Trade-enhancing or trade-inhibiting? International Journal of Economics and Finance, 1: 117–126.
United Nations Comtrade (UN Comtrade) (2017): UN Comtrade Database. Available at http://comtrade.un.org/ data/ (accessed May 10, 2017).
Vollrath T. (1991): A theoretical evaluation of alterna-tive trade intensity measures of revealed comparaalterna-tive advantage. Review of World Economics, 127: 265–280. Vollrath T.L., Johnston P.V. (2001): The Changing Struc-ture of Agricultural Trade in North America Pre- and Post-CUSTA/NAFTA: What Does It Mean? Economic Research Service, USDA, Washington, DC.
Wana C., Andreosso-O’Callaghan B. (2017): Global financial and food price crisis: A double shock on ASEAN food security. Asian Journal of Agriculture and Develop-ment, 14: 1–15.
Wu Y., Zhou Z. (2006): Changing bilateral trade between China and India. Journal of Asian Economics, 17: 509–518. Yu R., Cai J., Leung P.S. (2009): The normalized revealed
comparative advantage index. The Annals of Regional Science, 43: 267–282.
Yang J., Chen Ch. (2008): Agricultural trade between China and ASEAN: Dynamics and Prospects. In: Chen Ch., Duncan R. (eds): Agriculture and Food Security in China. ANU Press, Acton.